

When is the US Retail Sales data for March and how could it affect EUR/USD?
US Retail Sales data preview
The United States (US) Retail Sales data for March is scheduled to be published today at 12:30 GMT.
The US Census Bureau is expected to report that Retail Sales, a key measure of consumer spending, grew at a stronger pace of 1.4% on a monthly basis against 0.6% in February.
The consumer spending measure excluding automobiles is also estimated to have risen 1.4% Month-on-Month (MoM), up from the previous release of 0.5%. Meanwhile, the so-called Retail Sales Control Group data, which measures the value in total receipts of retail and food stores excluding receipts from auto dealers, building-materials retailers, gas stations, office supply stores, mobile home dealers, and tobacco stores, is seen rising at a moderate pace of 0.2% vs. 0.5% in February.
Investors will pay attention to the US Retail Sales data to get cues about the current status of households' demand, which could have a limited impact on the Federal Reserve’s (Fed) monetary policy outlook.
How could US Retail Sales data affect EUR/USD?
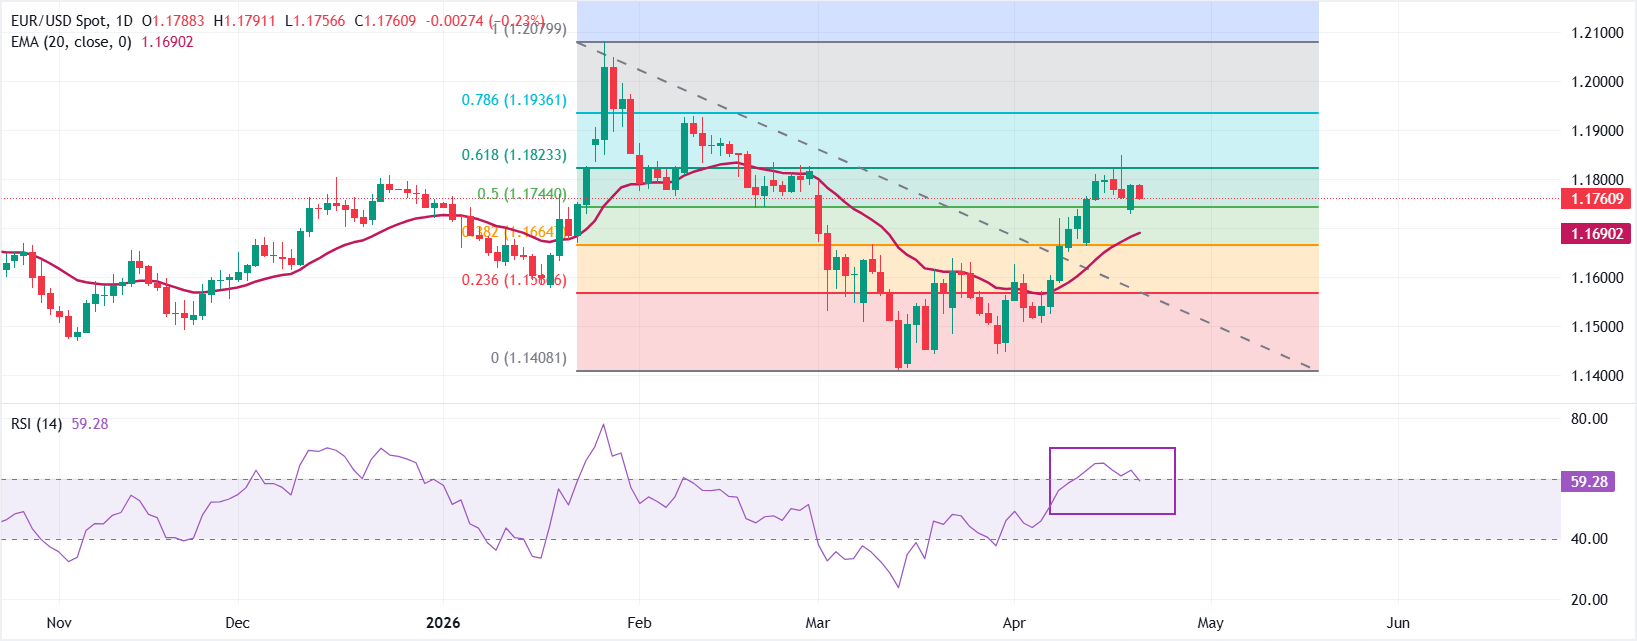
EUR/USD trades 0.25% lower at around 1.1760 ahead of the US Retail Sales data release. However, the near-term trend of the pair remains bullish as it holds above the 20-day exponential moving average (EMA), which is at 1.1690, and the 50.0% Fibonacci retracement at 1.1744.
The Relative Strength Index (14) is around 59 points to positive, yet not overstretched, momentum that reinforces the bullish bias as long as the price stays supported above the reclaimed mid-range retracement.
On the downside, immediate support is now aligned at the 50.0% retracement near 1.1744, followed by the 20-day EMA at 1.1690 and the 38.2% retracement at 1.1665, with deeper protection emerging at the 23.6% level at 1.1567. Looking up, initial resistance is located at the 61.8% Fibonacci retracement at 1.1823, with further barriers at the 78.6% level near 1.1936 and the recent cycle high and 100.0% retracement around 1.2080, where bulls may face stronger supply.
(The technical analysis of this story was written with the help of an AI tool.)
Economic Indicator
Retail Sales (MoM)
The Retail Sales data, released by the US Census Bureau on a monthly basis, measures the value in total receipts of retail and food stores in the United States. Monthly percent changes reflect the rate of changes in such sales. A stratified random sampling method is used to select approximately 4,800 retail and food services firms whose sales are then weighted and benchmarked to represent the complete universe of over three million retail and food services firms across the country. The data is adjusted for seasonal variations as well as holiday and trading-day differences, but not for price changes. Retail Sales data is widely followed as an indicator of consumer spending, which is a major driver of the US economy. Generally, a high reading is seen as bullish for the US Dollar (USD), while a low reading is seen as bearish.
Read more.Next release: Tue Apr 21, 2026 12:30
Frequency: Monthly
Consensus: 1.4%
Previous: 0.6%
Source: US Census Bureau
Retail Sales data published by the US Census Bureau is a leading indicator that gives important information about consumer spending, which has a significant impact on the GDP. Although strong sales figures are likely to boost the USD, external factors, such as weather conditions, could distort the data and paint a misleading picture. In addition to the headline data, changes in the Retail Sales Control Group could trigger a market reaction as it is used to prepare the estimates of Personal Consumption Expenditures for most goods.
Recommended Articles


