

Crypto Today: Bitcoin, Ethereum, XRP tick up as steady ETF inflows reinforce recovery outlook
- Bitcoin extends gains above $76,000 as institutional demand for spot ETFs increases.
- Ethereum presses into the 100-day EMA at $2,352 as risk-on sentiment boosts related investment products.
- XRP builds rebound momentum above the $1.42 support as cumulative inflows into ETFs rise to $1.28 billion.
Cryptocurrency prices are broadly recovering on Tuesday, led by Bitcoin’s (BTC) rebound above $76,000 at the time of writing, as investors hinge on any announcement of a second round of talks between the United States (US) and Iran as the two-week ceasefire winds down. Ethereum (ETH) is doubling down on its recovery attempt, aiming to reclaim its monthly high of $2,465. Meanwhile, Ripple (XRP) has shown resilience, extending gains for the second consecutive day and hovering above the $1.42 support level.
Despite the conflicts in the Middle East ahead of the potential second round of peace negotiations between the US and Iran on Tuesday in Pakistan, crypto market sentiment is gradually improving.
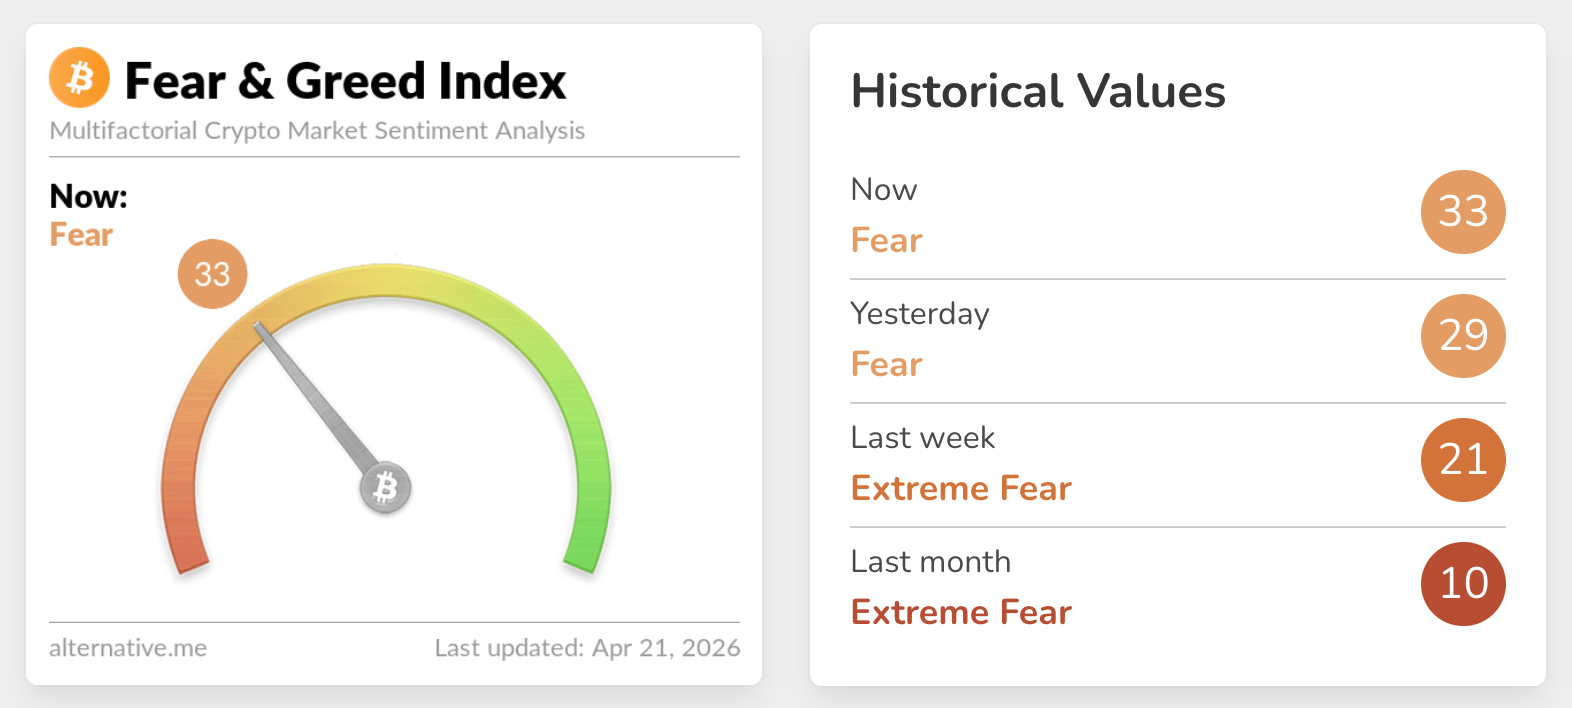
The crypto Fear & Greed Index sits at 33 on Tuesday, still in the fear territory but up from 29 the previous day and from 21 last week. As risk appetite improves, demand for crypto assets is also gaining traction, as evidenced by steady inflows into US-listed Exchange-Traded Funds (ETFs).
Bitcoin, Ethereum and XRP recovery gather pace, bolstered by ETF inflows
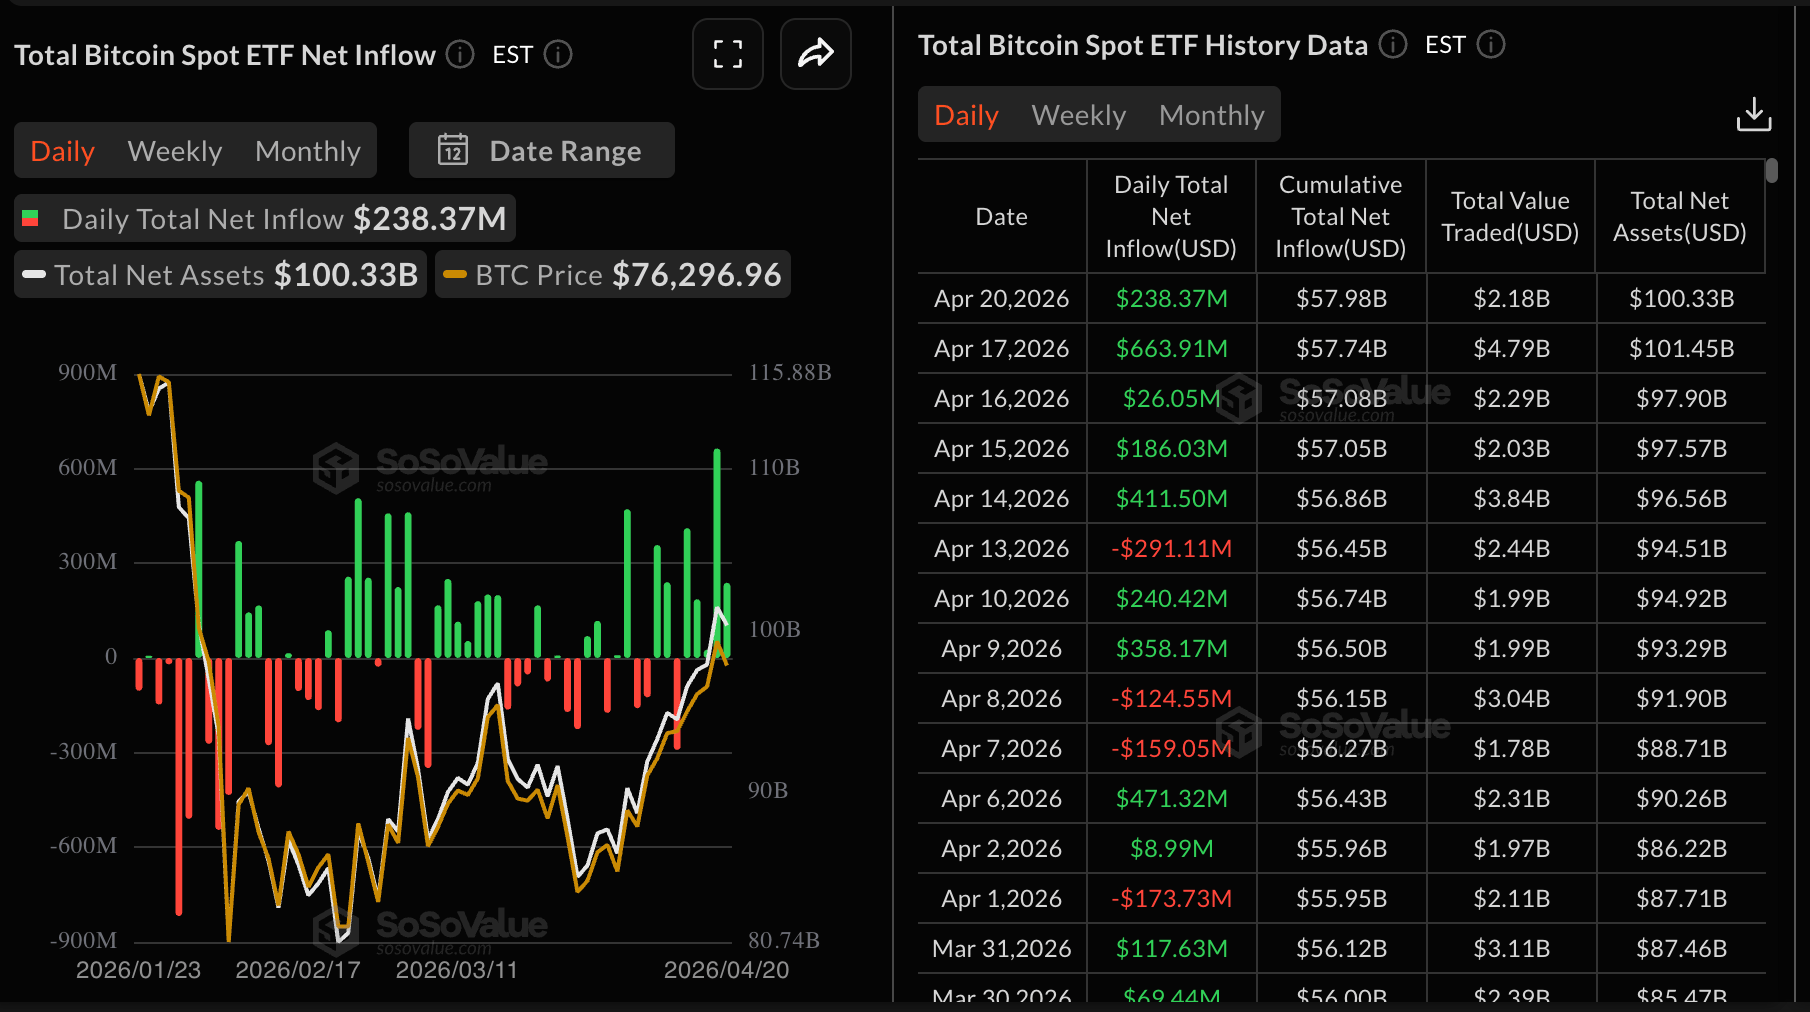
Bitcoin spot ETFs marked their fifth consecutive day of inflows on Monday, attracting roughly $238 million. Cumulative inflows average $57.98 billion while net assets under management stand at $100.33 billion. If demand for spot ETFs continues to grow steadily, the tailwind could reinforce Bitcoin’s recovery toward the psychological $80,000 level.
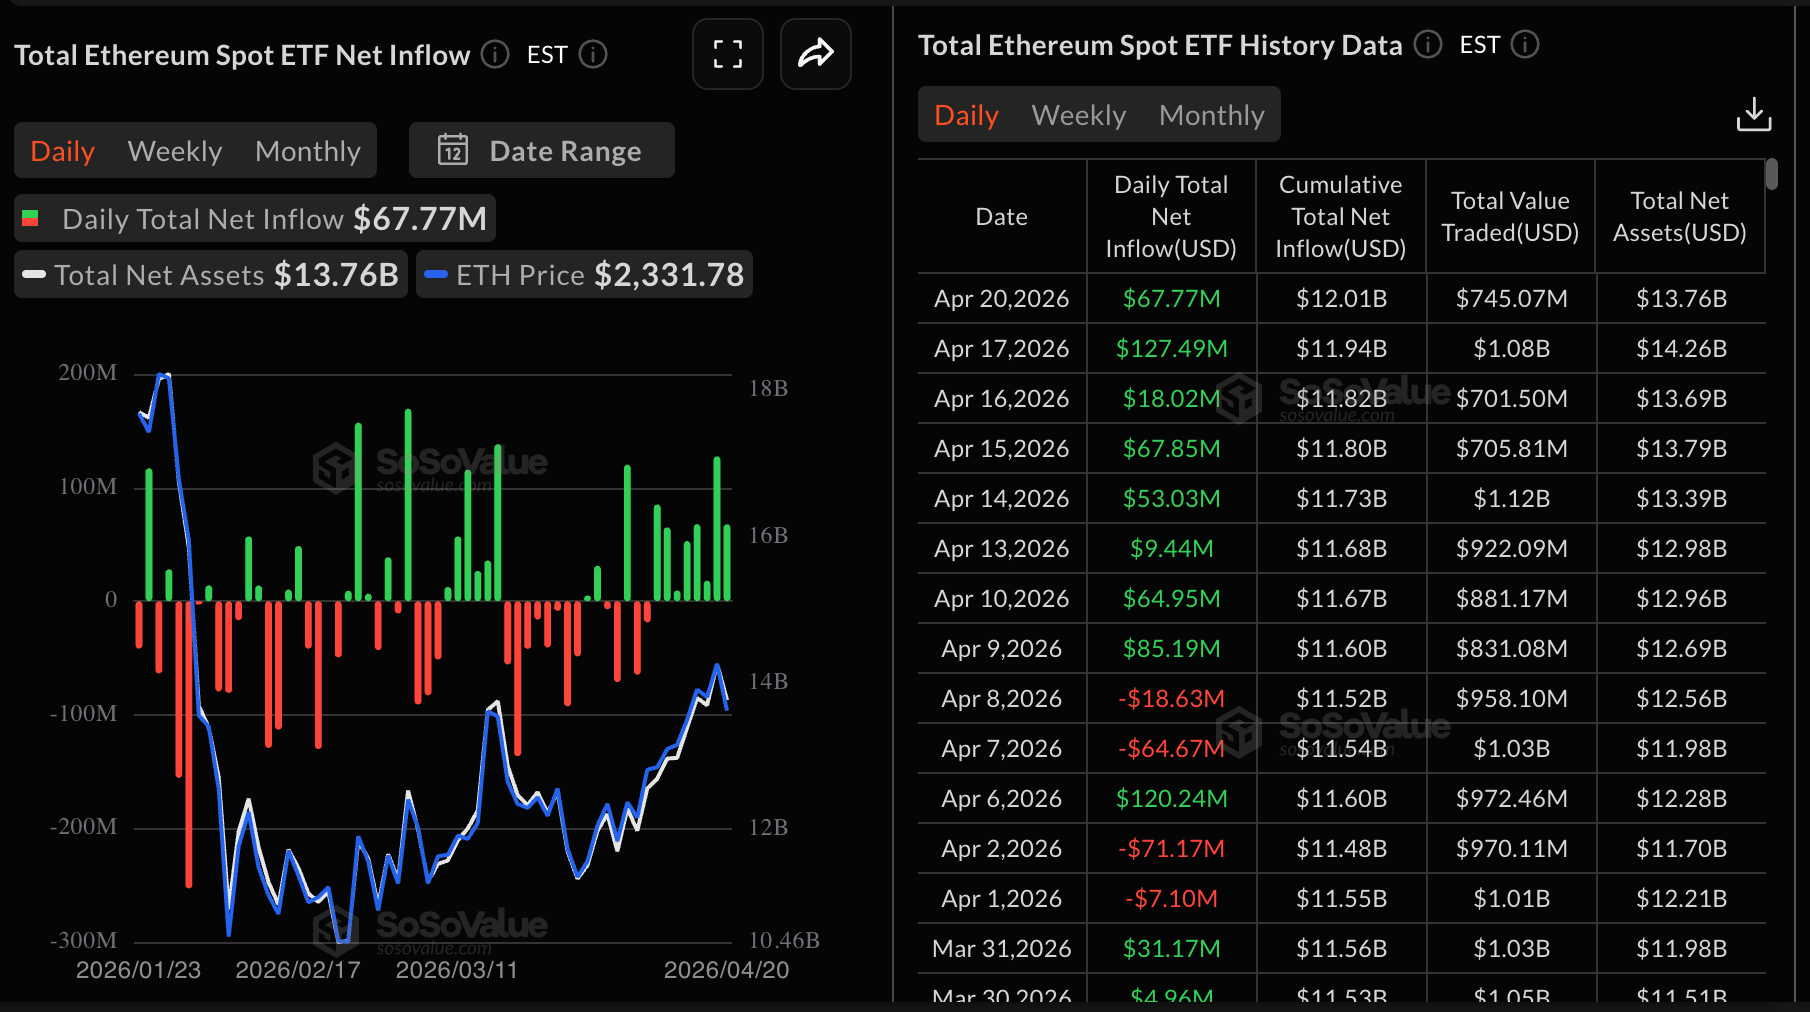
The demand for Ethereum-based digital investment products also remains steady, with nearly $68 million in inflows into spot ETFs recorded on Tuesday. SoSoValue data shows that the bullish streak is now on its eighth day, bringing cumulative inflows to $12.01 billion and net assets under management to $13.76 billion.
Meanwhile, XRP spot ETFs saw inflows of $3 million on Tuesday, down from $13.74 million the previous day. Cumulative inflows stand at $1.28 billion while net assets under management average $1.08 billion.
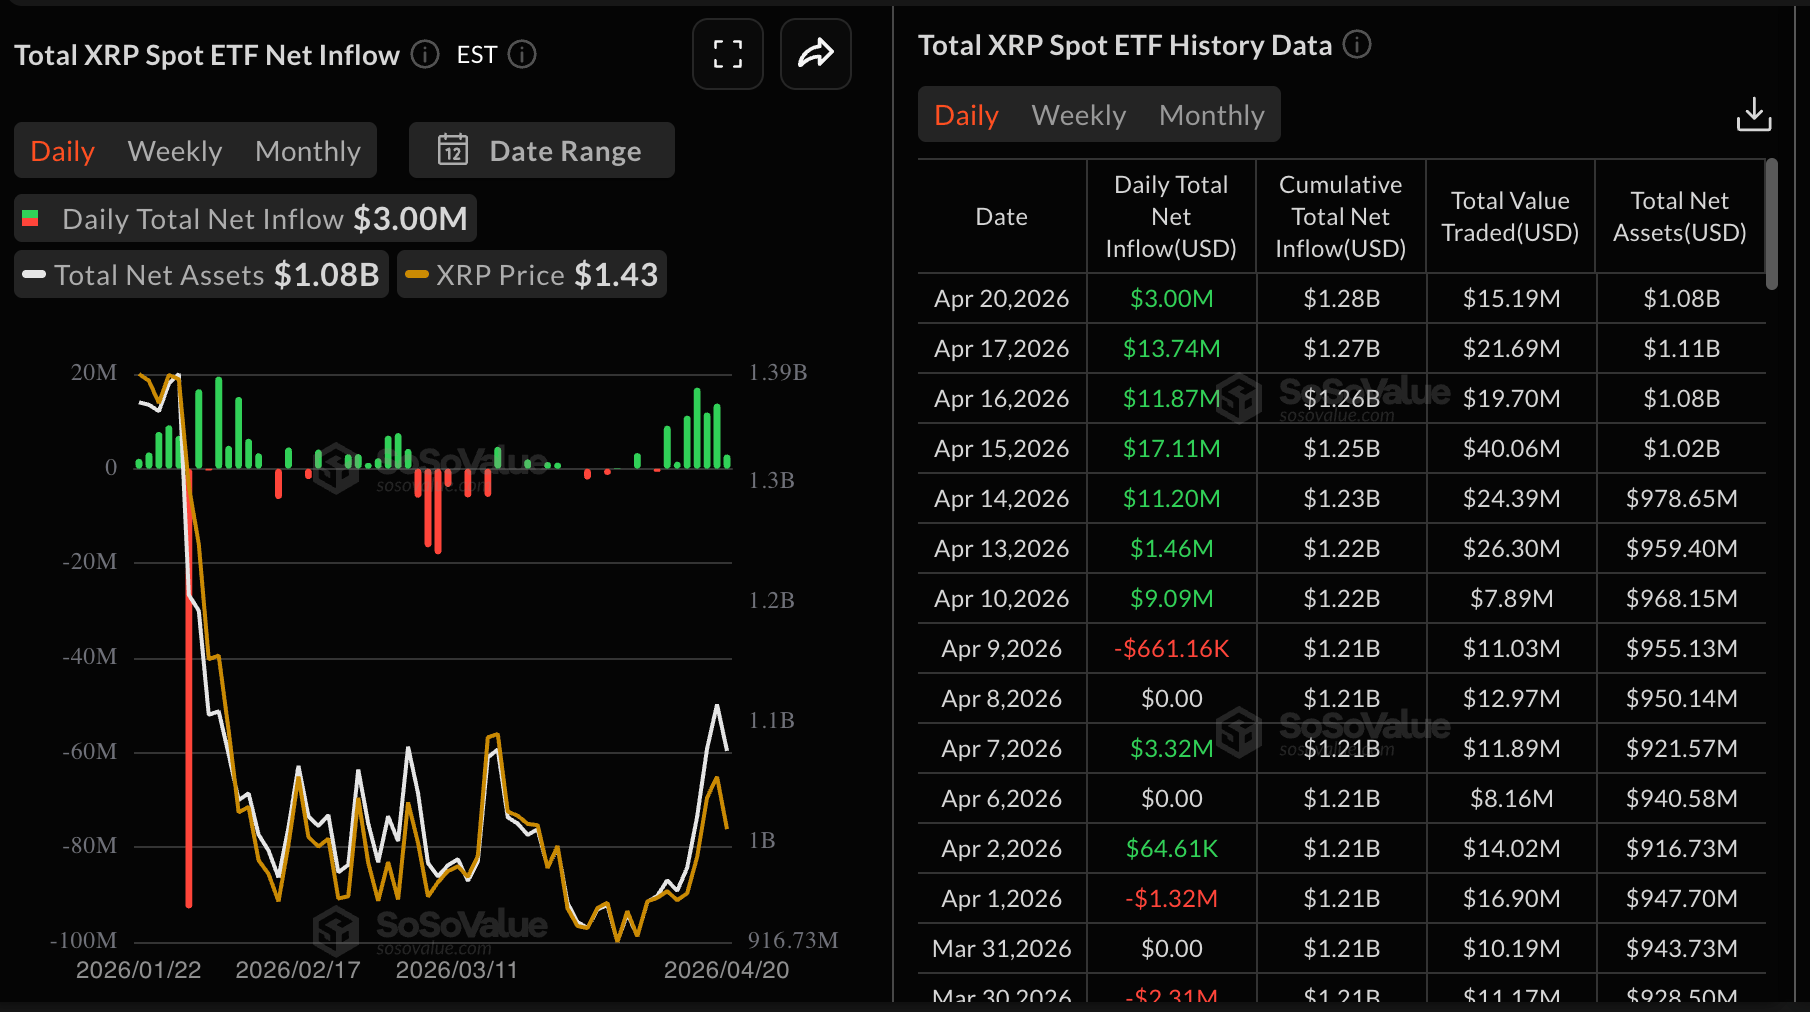
Chart of the day: Bitcoin poised to extend gains
Bitcoin trades at around $76,500, maintaining a bullish near-term bias as price holds above the 50-day and 100-day Exponential Moving Averages (EMAs) at roughly $72,121 and $75,339, respectively. The recent reclaim and defense of these medium-term trend supports suggest dips are being absorbed, while positive readings from the Relative Strength Index (RSI) near 62 on the daily chart and a firmly positive Moving Average Convergence Divergence (MACD) histogram hint that upside momentum remains constructive.
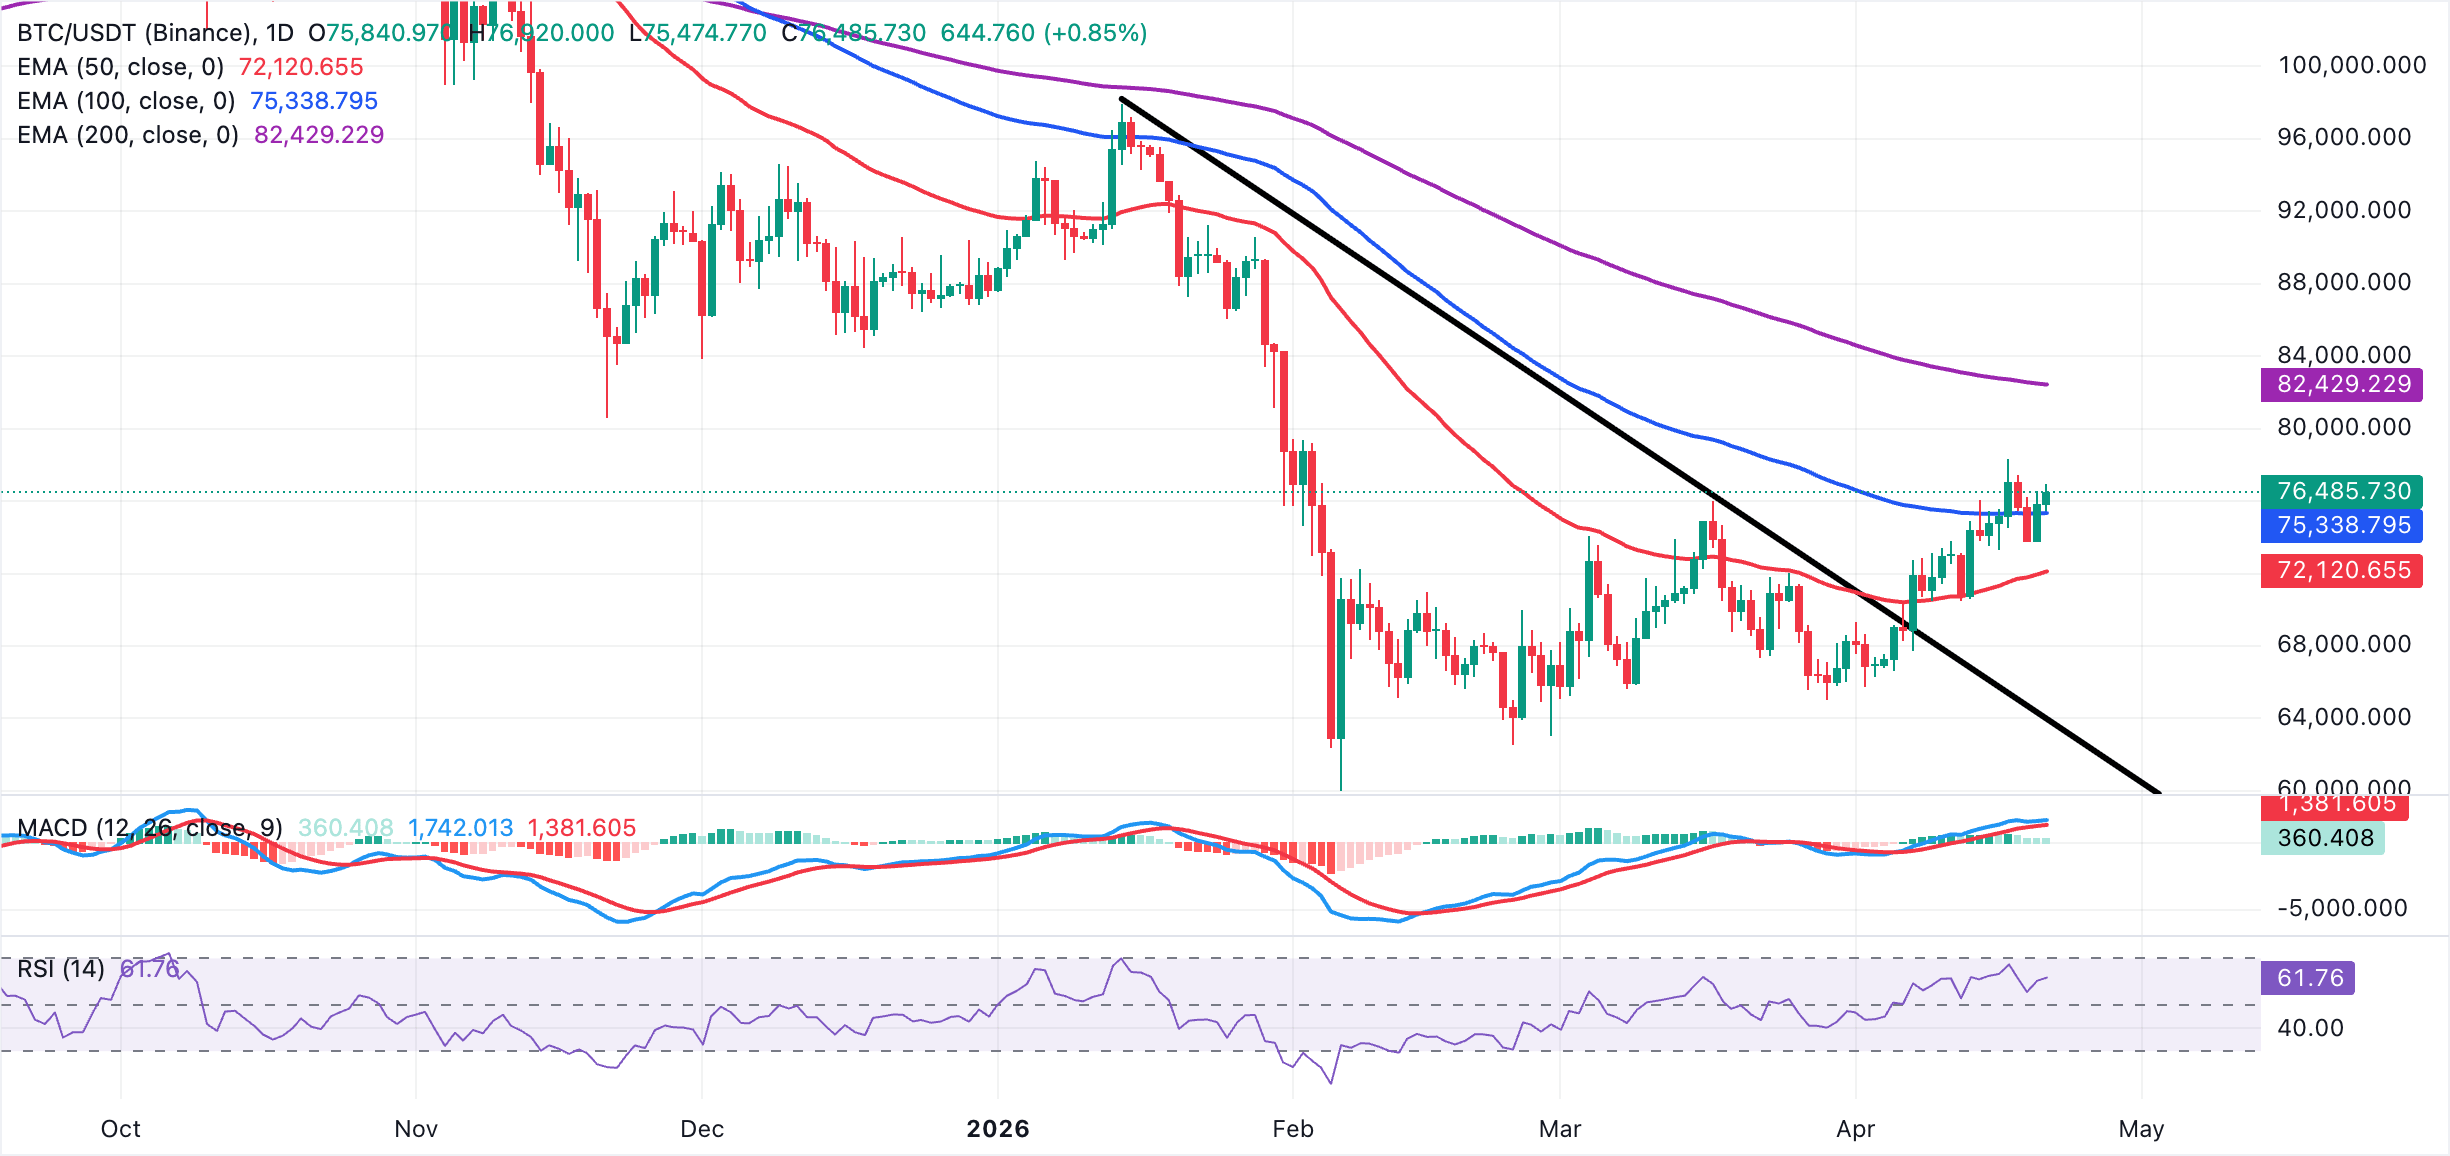
On the topside, the next notable barrier is seen around $78,000, last week's high, followed by the 200-day EMA near $82,429, which could cap advances on initial tests. On the downside, immediate support lies at the 100-day EMA around $75,339, with a deeper cushion at the 50-day EMA near $72,121. A sustained break below these layers would be needed to undermine the current bullish structure and signal a more meaningful corrective phase.
Altcoins technical outlook: Ethereum and XRP gather breakout momentum
Ethereum trades at $2,328 and holds above the 50-day EMA at $2,216, signaling a modestly constructive undertone. Still, ETH's advance appears curtailed as price sits right below the 100-day EMA at $2,352 and the 200-day EMA at $2,608, keeping the broader recovery in check. The RSI around 56 on the daily bchart leans to the bullish side, while the MACD histogram remains mildly positive, suggesting upside momentum is present but not yet strong enough to challenge the higher-timeframe bearish structure defined by the long-term moving averages.
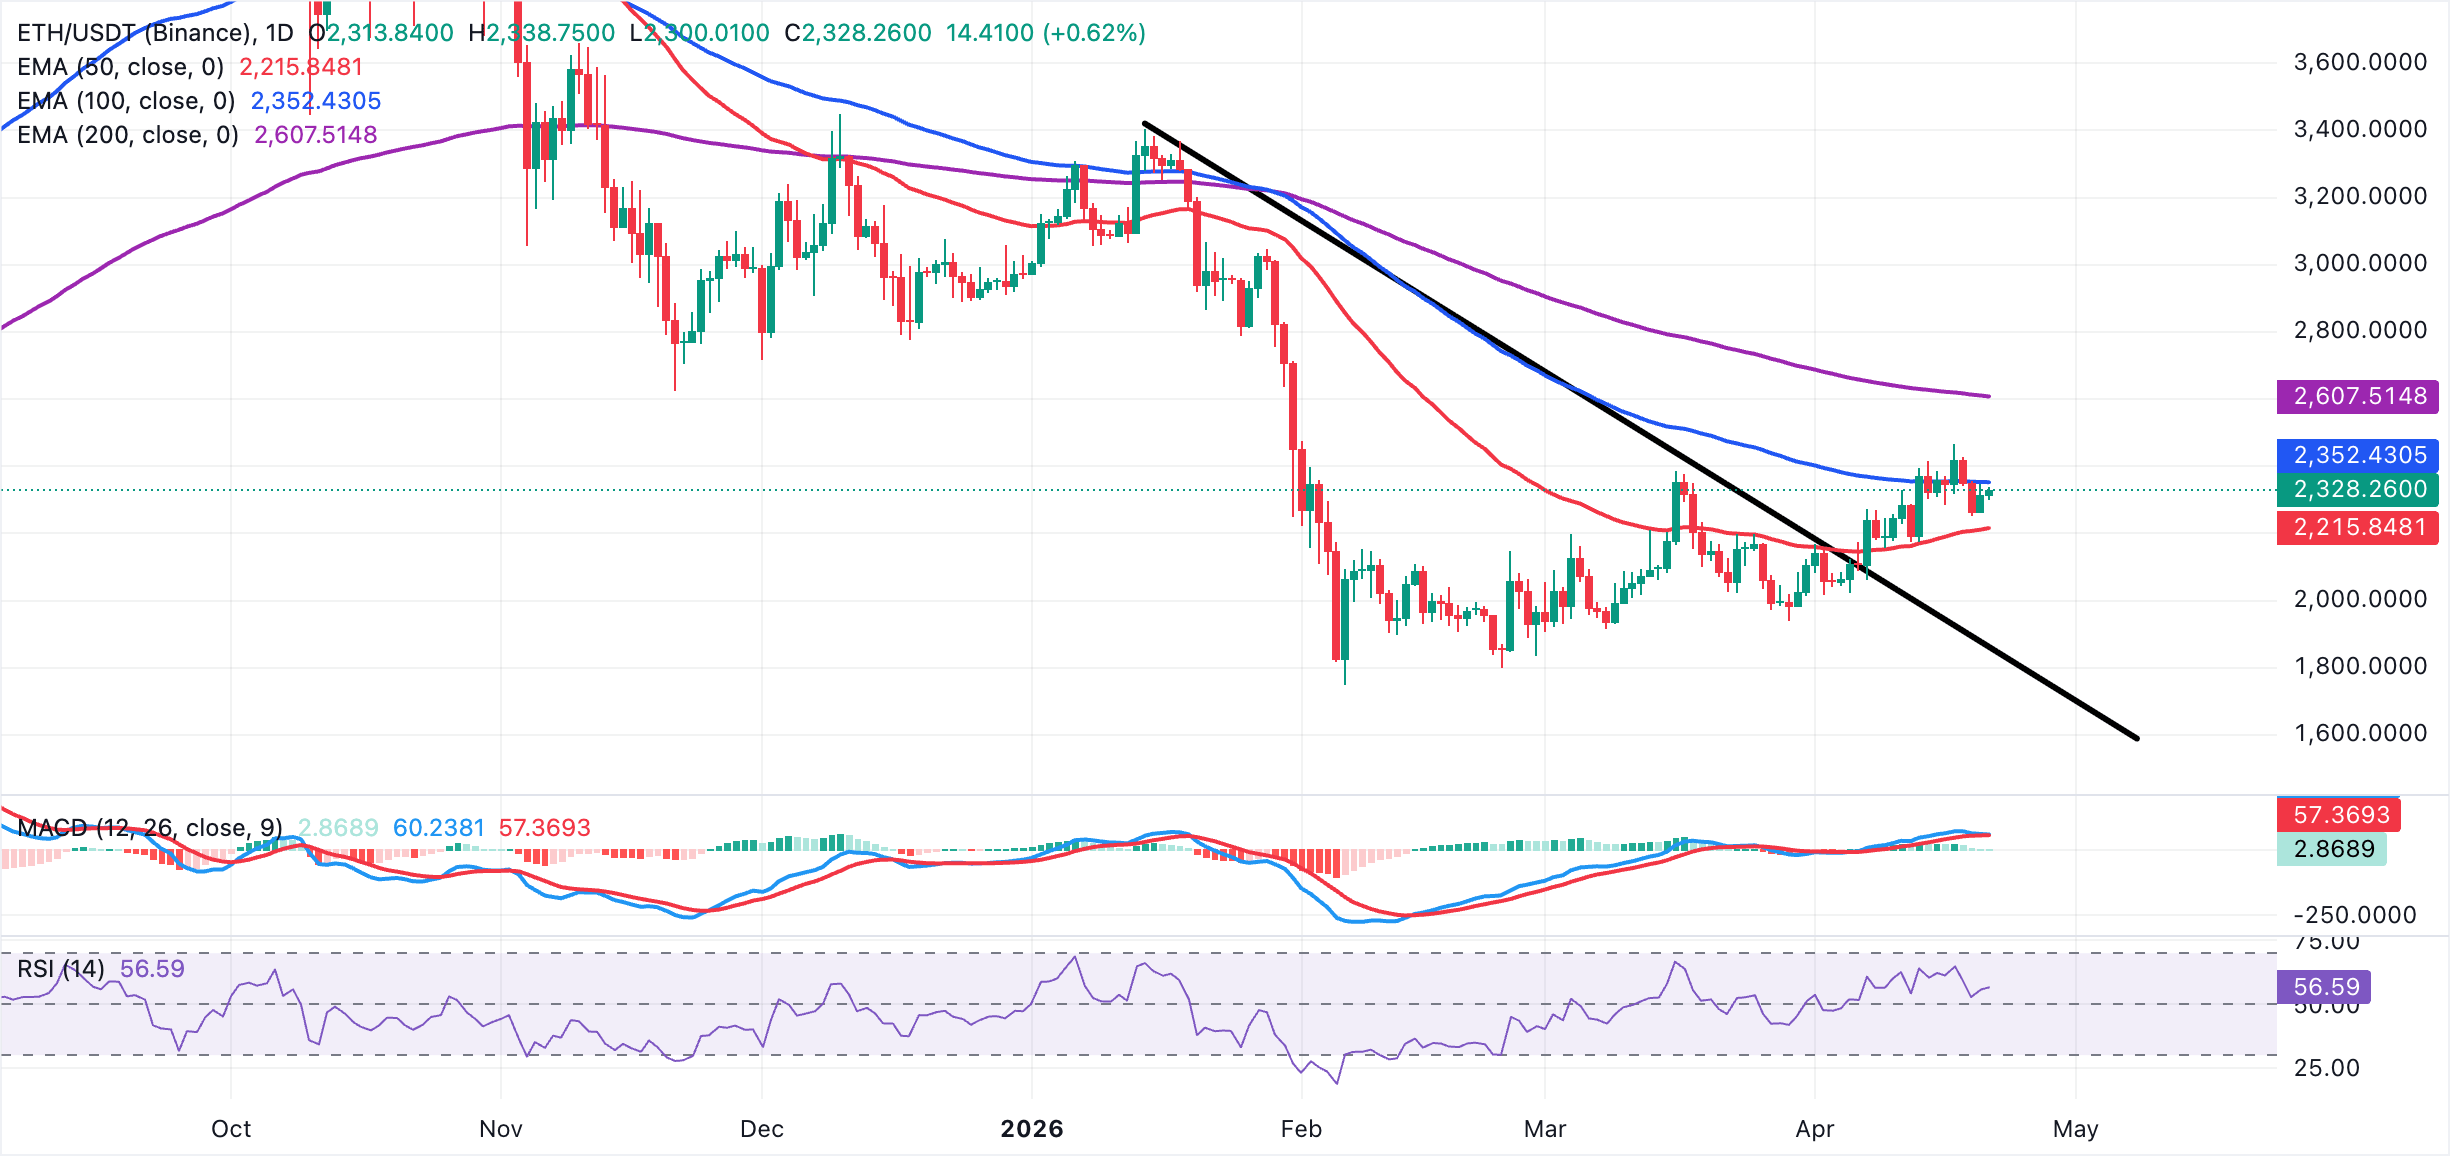
On the topside, immediate resistance emerges at the 100-day EMA at $2,352, which guards the path toward the more significant barrier at the 200-day EMA around $2,608. On the downside, initial support is aligned with the 50-day EMA at roughly $2,216, whereby a sustained break below this floor would expose ETH to a deeper pullback. Holding above the same 50-day EMA would keep the door open for another attempt to press into the $2,352 region and potentially higher.
As for XRP, the price holds at $1.44, supported by the 50-day EMA at $1.42 and the 23.6% Fibonacci retracement at $1.4208, applied between the January 6 high of $2.42 and the February 6 low of $1.12. XRP upholds a mildly constructive near-term tone despite sitting well below the 100-day and 200-day EMAs at $1.54 and $1.80, respectively.
A positive MACD histogram on the daily chart, with the RSI around 57, suggests bullish momentum is building. However, broader upside remains constrained by the higher moving averages and overhead Fibonacci retracement barriers.
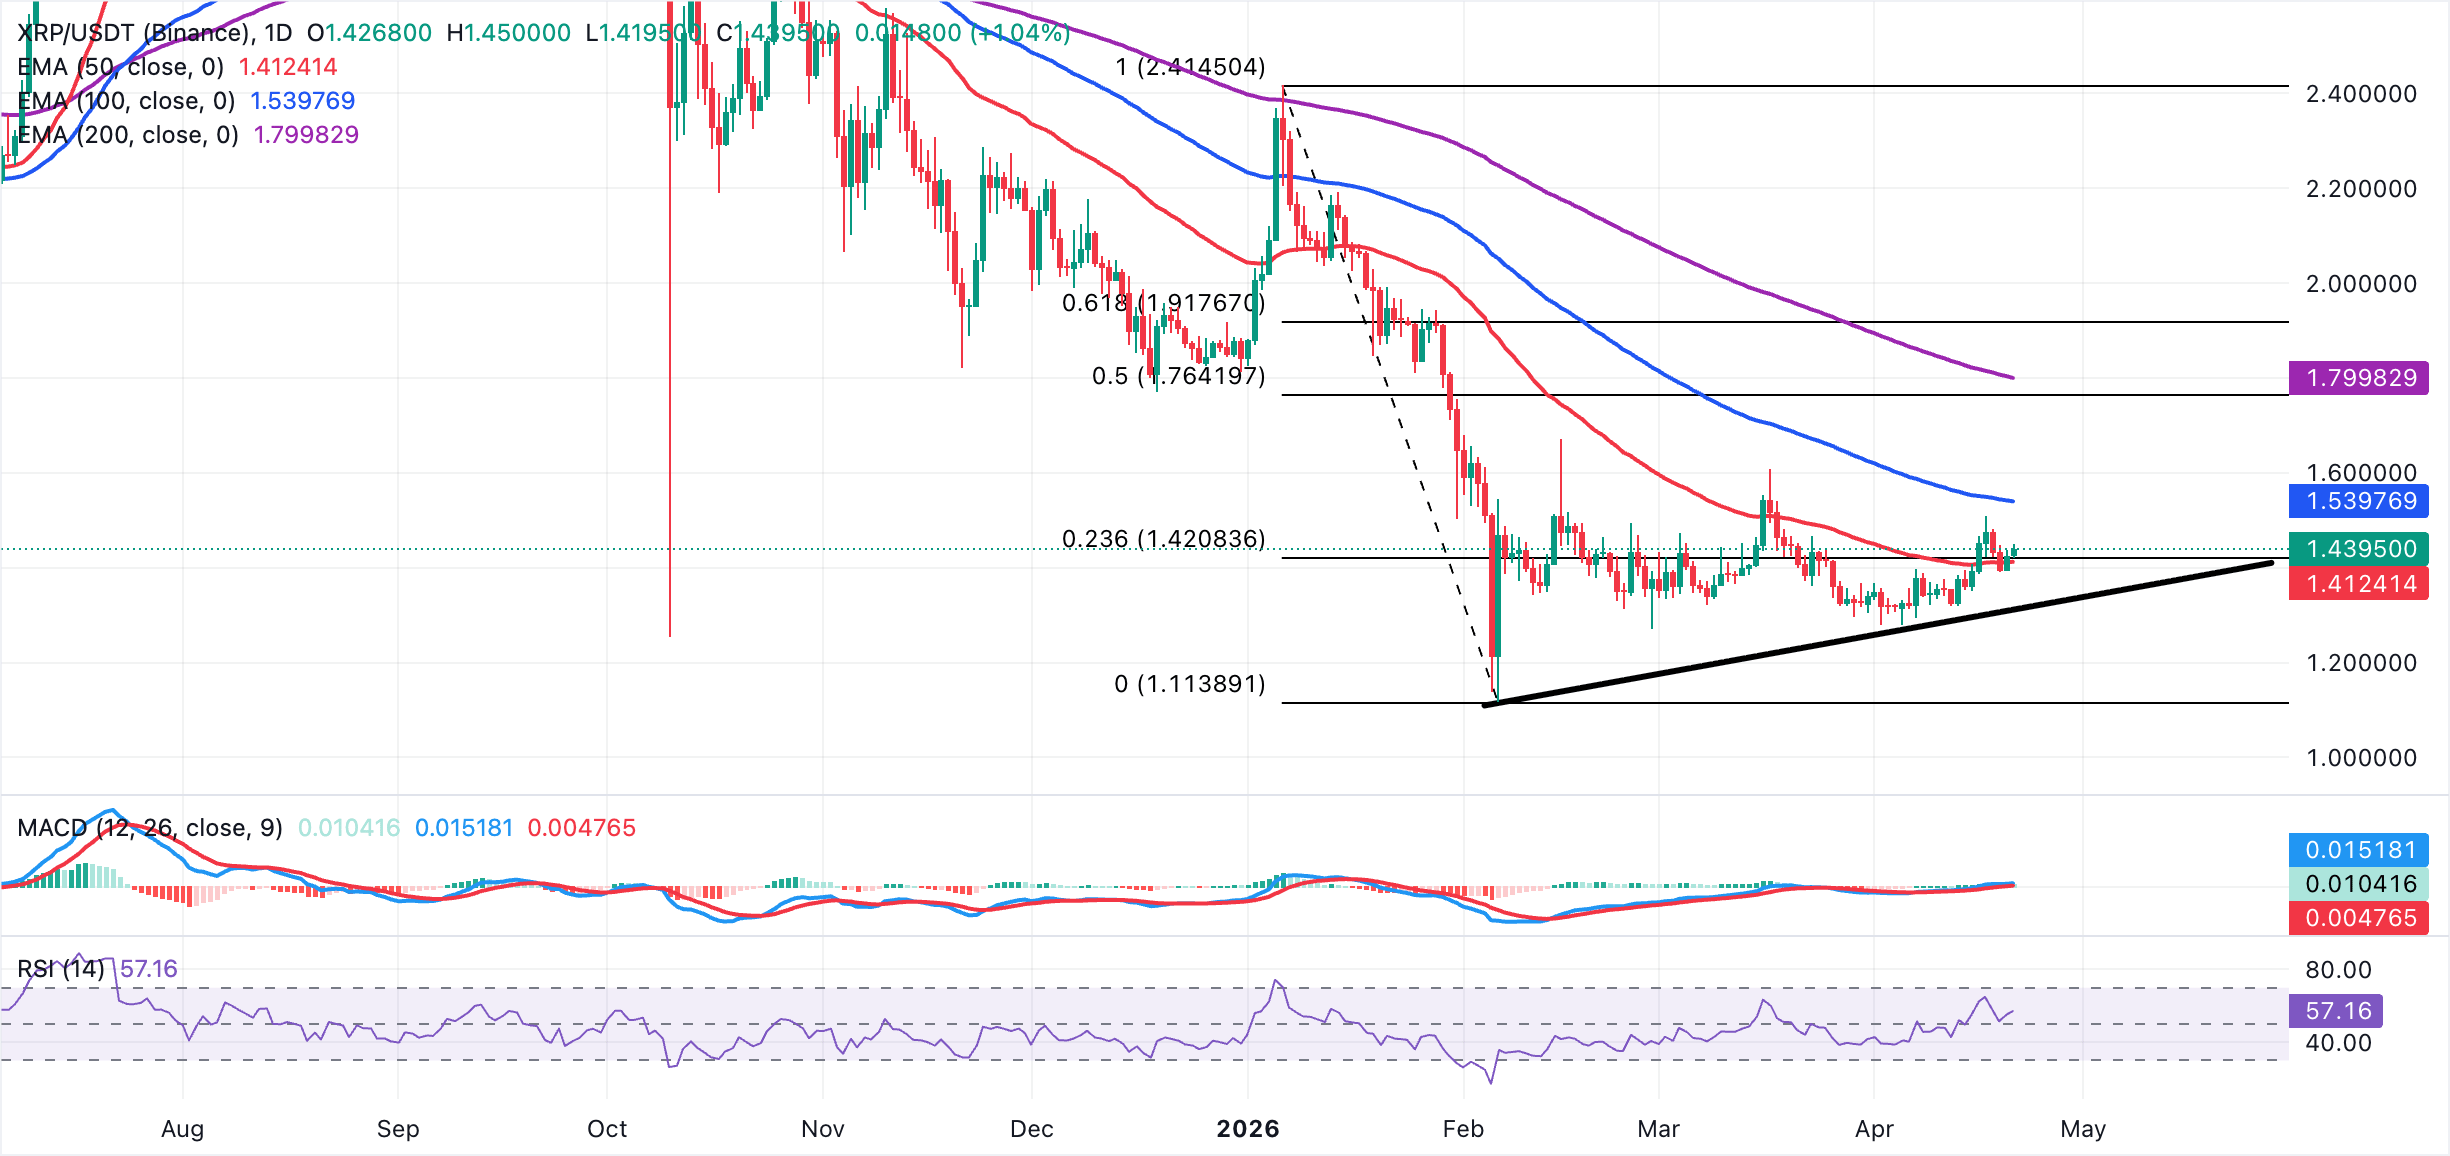
On the downside, initial support is seen at the 23.6% Fibonacci retracement at $1.42, reinforced by the 50-day EMA at $1.41, slightly below it. A deeper pullback could revisit the former trendline break area near $1.31 before exposing the Feburary 6 low at $1.12. On the topside, initial resistance emerges at the 100-day EMA at $1.54, followed by the 38.2% Fibonacci retracement at $1.61 and the 200-day EMA at $1.80.
(The technical analysis of this story was written with the help of an AI tool.)
Crypto ETF FAQs
An Exchange-Traded Fund (ETF) is an investment vehicle or an index that tracks the price of an underlying asset. ETFs can not only track a single asset, but a group of assets and sectors. For example, a Bitcoin ETF tracks Bitcoin’s price. ETF is a tool used by investors to gain exposure to a certain asset.
Yes. The first Bitcoin futures ETF in the US was approved by the US Securities & Exchange Commission in October 2021. A total of seven Bitcoin futures ETFs have been approved, with more than 20 still waiting for the regulator’s permission. The SEC says that the cryptocurrency industry is new and subject to manipulation, which is why it has been delaying crypto-related futures ETFs for the last few years.
Yes. The SEC approved in January 2024 the listing and trading of several Bitcoin spot Exchange-Traded Funds, opening the door to institutional capital and mainstream investors to trade the main crypto currency. The decision was hailed by the industry as a game changer.
The main advantage of crypto ETFs is the possibility of gaining exposure to a cryptocurrency without ownership, reducing the risk and cost of holding the asset. Other pros are a lower learning curve and higher security for investors since ETFs take charge of securing the underlying asset holdings. As for the main drawbacks, the main one is that as an investor you can’t have direct ownership of the asset, or, as they say in crypto, “not your keys, not your coins.” Other disadvantages are higher costs associated with holding crypto since ETFs charge fees for active management. Finally, even though investing in ETFs reduces the risk of holding an asset, price swings in the underlying cryptocurrency are likely to be reflected in the investment vehicle too.
Recommended Articles


