
US Dollar Index steadies near 100.00 as fiscal risks cap upside despite upbeat PMI data
- DXY recovers from a two-week low after bouncing off key support at 99.50.
- US fiscal concerns grow after the House passed Trump’s tax bill, and Moody’s credit downgrade adds pressure.
- S&P Global PMI beats expectations, signaling stronger business activity in May
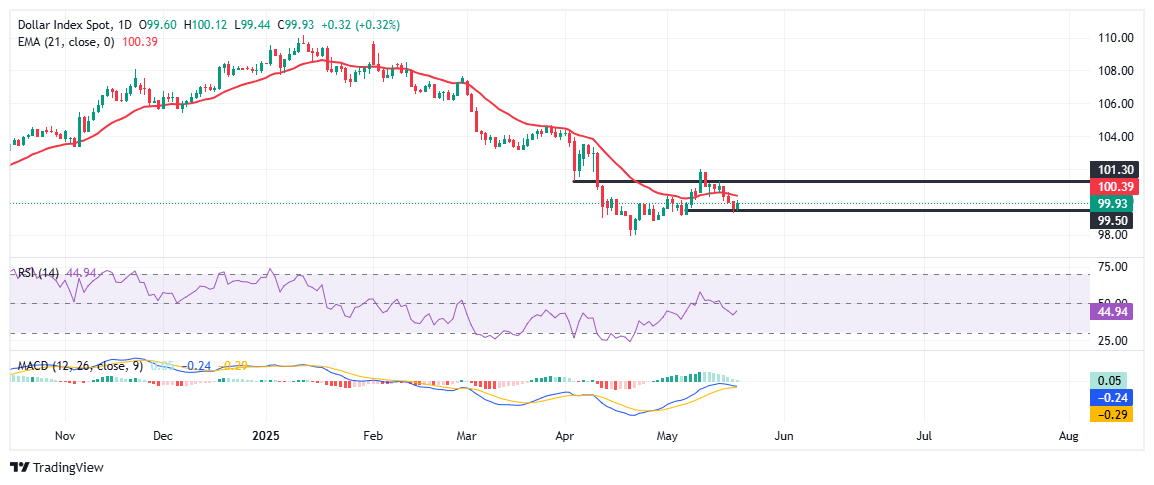
- Technical resistance is seen at the 21-day EMA (100.40).
The US Dollar index (DXY), which tracks the US Dollar (USD) against a basket of six major currencies, is trading cautiously around the 100.00 mark on Thursday after recovering from a two-week low and bouncing off key support at the 99.50 psychological level earlier in the day. While the Greenback shows signs of resilience, upside remains capped as broader risk sentiment remains fragile amid growing fiscal uncertainty in the United States (US).
The US House of Representatives narrowly approved President Donald Trump’s tax bill by a single vote, intensifying fears over the country’s rising debt burden. The bill, projected to increase the federal deficit by nearly $3 trillion over the next decade, now awaits a Senate vote expected in August.
Adding to the pressure, Moody’s downgraded the US credit rating to Aa1, citing unsustainable debt levels and a lack of fiscal discipline. Meanwhile, stalled trade negotiations are weighing on investors’ confidence, fueling a risk-off mood that has kept US Dollar gains in check.
However, economic data released on Thursday offered a glimmer of support. US business activity accelerated in May, with the S&P Global Flash Composite Purchasing Managers Index (PMI) climbing to 52.1 from 50.6 in April, while the Manufacturing PMI jumped to 52.3 from 50.2, and Services PMI also rose to 52.3 from 50.8 — both beating expectations and highlighting resilience in the private sector despite policy headwinds.
From a technical perspective, the Dollar Index remains in a corrective phase within a broader downtrend that began in March. The DXY is consolidating just beneath the 21-day Exponential Moving Average (EMA) at 100.40. A sustained break above this zone would open the door toward the 101.30–101.50 level, a former support-turned-resistance.
Momentum indicators present a mixed picture with the Relative Strength Index (RSI) hovering around 45.79, showing indecision with a lack of bullish momentum, while the Moving Average Convergence Divergence (MACD) is attempting a bullish crossover. However, it remains below the zero line — a sign that bullish conviction is still lacking.
On the downside, 99.50 remains a critical floor. A break below would likely attract further selling, potentially dragging the index toward the 98.80–99.00 region.
Recommended Articles


