

The Oil price corrects from an almost five-month high of $75.54 as the US is not expected to strike Iran immediately.
The White House stated that it will discuss about Iran in next two weeks.
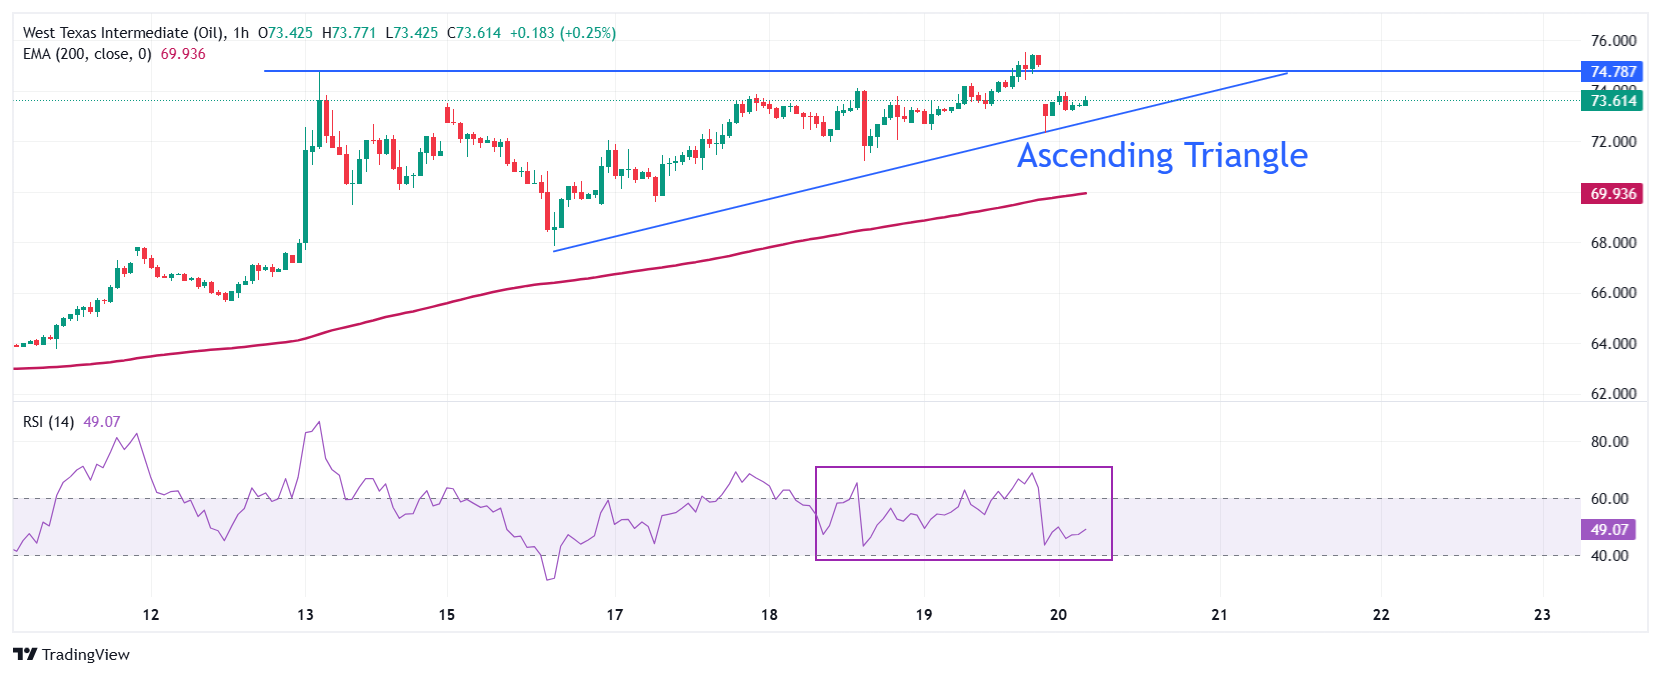
An Ascending Triangle formation on an hourly timeframe indicates volatility contraction.
West Texas Intermediate (WTI), futures on NYMEX, recovers its early losses and ticks up to near $73.70 during Asian trading hours on Friday. The Oil price opened on a weak note as comments from the White House signaled that they have no intentions to strike Iran immediately.
US Press Secretary Karoline Leavitt stated on Thursday that there is a chance of negotiations with Iran, and Washington will decide about attacking Iran in the next two weeks.
These comments from the White House have eased fears of escalating Middle East tensions, resulting in a pause in the Oil price rally. Meanwhile, demand for safe-haven assets, such as the US Dollar (USD), has also diminished. The US Dollar Index (DXY), which tracks the Greenback’s value against six major currencies, corrects to near 98.60 from the weekly high of 99.15 posted on Thursday.
The appeal of safe-haven assets strengthened on Thursday after a report from Bloomberg indicated that senior US officials are preparing for the possibility of a strike on Iran in the coming days.
WTI Oil price trades in an Ascending Triangle formation on the hourly timeframe, which indicates indecisiveness among market participants. The horizontal resistance of the above-mentioned chart pattern is plotted from the June 13 high around $74.75, while the upward-sloping trendline is placed from the June 16 low of $67.85.
The 200-hour Exponential Moving Average (EMA) slopes higher around $70.00, suggesting that the overall trend is upside.
The 14-day Relative Strength Index (RSI) wobbles inside the 40.00-60.00 range, indicating a sharp volatility contraction.
The Oil price would extend its upside towards the January 21 high of $77 and the psychological level of $80, if it breaks above the June 19 high of $75.54.
On the contrary, a downside move below the June 18 low of $71.20 would expose it to the 200-hour EMA, followed by the June 16 low of $67.85.
WTI hourly chart
* The content presented above, whether from a third party or not, is considered as general advice only. This article should not be construed as containing investment advice, investment recommendations, an offer of or solicitation for any transactions in financial instruments.


