


Bitcoin Weekly Forecast: The calm before the storm

- Bitcoin Drops to $70,000. U.S. Government Refuses to Bail Out Market, End of Bull Market or Golden Pit?
- Gold rallies further beyond $5,050 amid flight to safety, dovish Fed expectations
- Bitcoin Bottom Debate: $70,000 or $50,000?
- A Crash After a Surge: Why Silver Lost 40% in a Week?
- Bitcoin Slips Below 75,000 Mark. Will Strategy Change Its Mind and Sell?
- Bitcoin Rout. Bridgewater Founder Dalio Publicly Backs Gold.
Bitcoin price holds above the 50-day EMA at $103,260; a decisive close below this level could trigger a sharp correction.
A potential US strike on Iran hangs over markets as Trump is set to decide within two weeks on America's role in the Israel-Iran conflict.
Despite risk aversion, corporate and institutional demand remained robust this week.
Bitcoin (BTC) price remains steady above a key support level, trading slightly above $106,000 at the time of writing on Friday. The uncertainty looms as geopolitical tensions between Iran and Israel show no sign yet of an exit strategy from either side. US President Donald Trump is expected to decide within two weeks on a potential role for the US in the Israel-Iran conflict. Despite the cautious sentiment, corporate and institutional interest in BTC held firm so far this week.
How did Bitcoin react to the Iran-Israel war?
The ongoing war between Iran and Israel, which has been taking place since last week, continued to escalate with no sign yet of an exit strategy from either side. Bitcoin's price action remained broadly resilient at the start of the week on Monday despite escalating tensions in the Middle East. The largest cryptocurrency by market capitalization held above its key psychological threshold of 100,000 despite the initial shock, compared to April last year, when BTC fell more than 8% amid similar Iran-Israel turmoil.
However, on Tuesday, BTC declined 2.10% as news emerged that President Trump had stated on social media that the US was aware of the location of the Iran’s leader but was choosing not to take any action, and then added, “UNCONDITIONAL SURRENDER!” according to the Wall Street Journal.
Moreover, Israeli Channel 12 media outlet reportedly said on Tuesday that the US could join the war against Iran that same night.
BTC price consolidated over the next two days as the US didn't take any military action against Iran, hinting at some sign of relief for investors.
Later on Friday, Reuters reported that Trump will decide in the next two weeks whether the US will get involved in the Israel-Iran war. As of now, the US possible strike on Iran remains calm, which pushes the BTC price slightly up, trading around $106,000 at the time of writing on Friday.
However, further escalation or US intervention could lead to a disruption in the cryptocurrency market, resulting in a sharp correction in the Bitcoin price.
Macroeconomic developments
The US Federal Reserve (Fed) kept its interest rate unchanged at the 4.25%–4.50% range at its June meeting on Wednesday, as widely expected. The Federal Open Market Committee (FOMC) still sees around 50 basis points of rate cuts through the end of 2025.
Fed Chair Jerome Powell warned that ongoing policy uncertainty will keep the Fed in a rate-hold stance, and any rate cuts will be contingent on labor and inflation data. The markets remained neutral on this news, as an unchanged interest rate was highly expected.
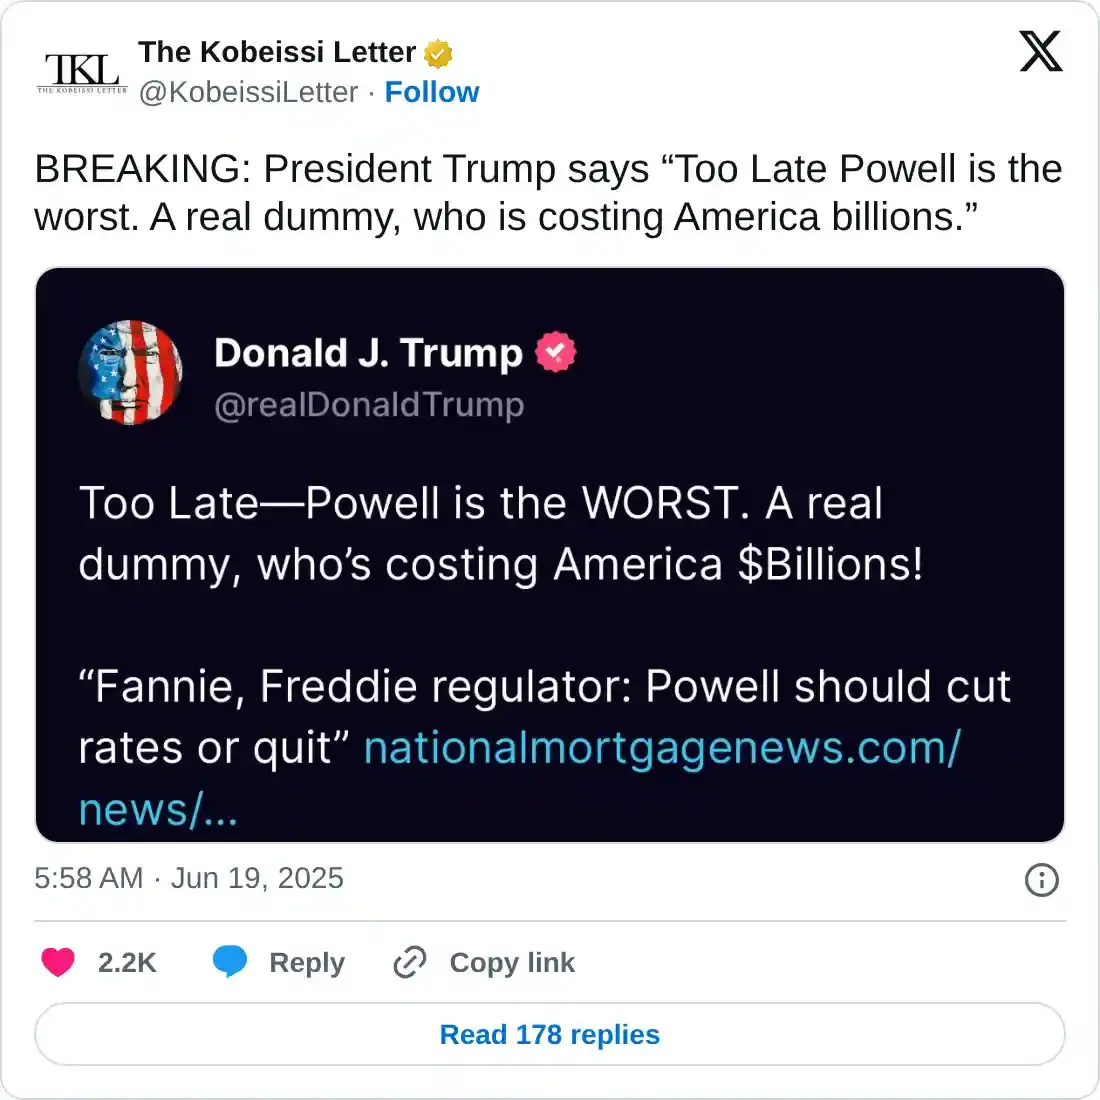
On Thursday, US President Trump posted on his Truth Social account, “Too Late—Powell is the WORST. A real dummy, who’s costing America $Billions!”
US Senate passes GENIUS bill
The US Senate passed the GENIUS bill on Tuesday and now awaits final deliberation in the House before it can move on to the President's desk.
The US Senate’s decision on a stablecoin regulatory bill marks a milestone for the crypto industry. This decision has a positive outlook, as it helps establish a legal framework for stablecoins, which could enhance their legitimacy and facilitate wider adoption. Additionally, this could also boost the stablecoin market capitalization, which is considered the crypto gateway and has a positive correlation with Bitcoin price.
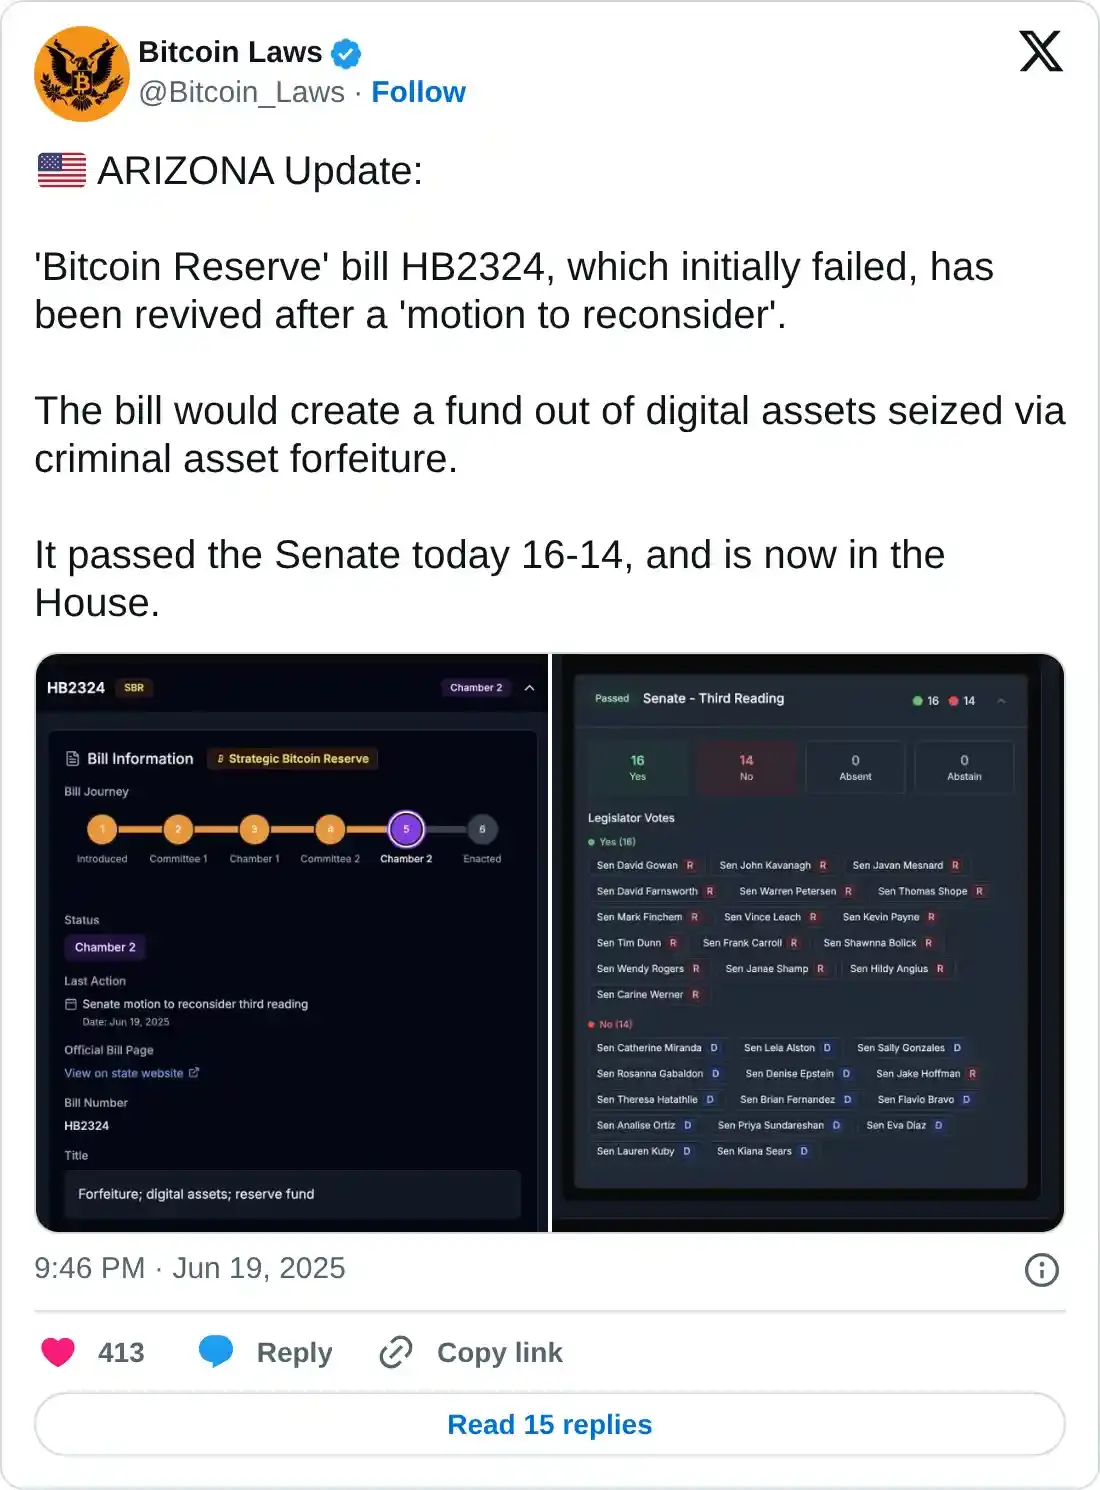
Moreover, Arizona’s Bitcoin reserve bill HB2324, which initially failed, has been revived after the state’s Senate passed a motion to reconsider the bill on Thursday. This bill would establish a fund from digital assets seized through criminal asset forfeiture. It has passed the Senate with a 16-14 vote and is now in the House.
On-chain data shows early signs of weakness
CryptoQuant's weekly report highlights the fading demand for Bitcoin. According to the Bitcoin Apparent Demand chart, the growth is 118,000 in the last 30 days, down from its previous peak of 228,000 reached on May 27. Additionally, the demand has fallen below its 30-day Moving Average, indicating that the demand for Bitcoin is softening.
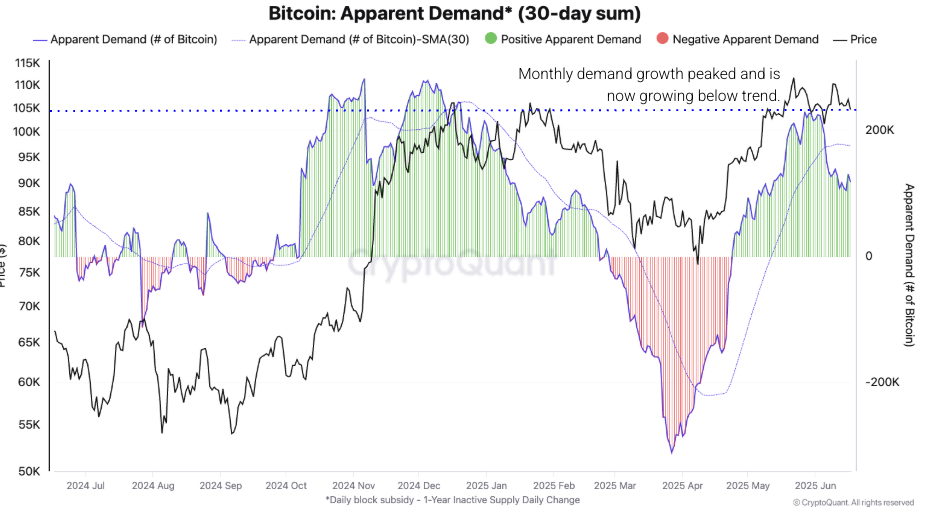
Bitcoin Apparent Demand (30-day sum) chart. Source: CryptoQuant
The chart below shows that the demand for new BTC entrants has also weakened, with its demand momentum turning sharply negative, further supporting a bearish thesis.
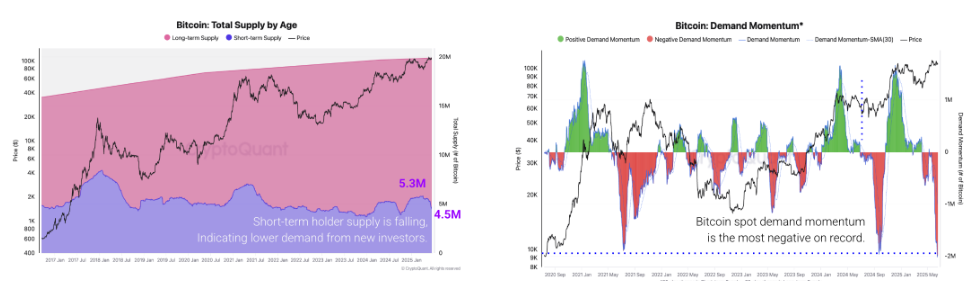
Bitcoin Total Supply by Age chart (Left) and Bitcoin demand momentum chart (Right). Source: CryptoQuant
The analyst projects that if demand continues to weaken, Bitcoin could find support near $92,000, as shown in the chart below.
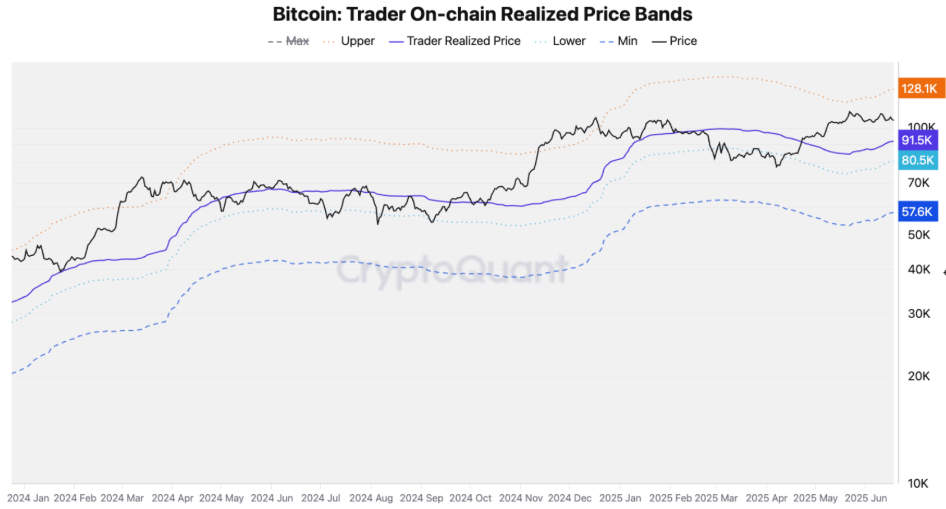
Bitcoin trader on-chain realized price bands chart. Source: CryptoQuant
Some signs of optimism
Despite the rising uncertainty in the market, institutional and corporate demand for Bitcoin remained robust as of this week. Japanese investment firm Metaplanet announced on Monday that it had purchased an additional 1,112 BTC, bringing the total holding to 10,000 BTC. On the same day, Strategy, formerly MicroStrategy, announced that it had added 10,100 BTC for $1.05 billion at an average price of $104,080 per BTC. The firm currently holds 592,100 BTC.
Later on Thursday, Semler Scientific announced its three-year plan to boost its Bitcoin holdings to 105,000 BTC by the end of 2027. The firm currently holds 3,808 BTC, as reported in its first-quarter financial statements.
The corporate interest in Bitcoin indicates a growing acceptance of BTC as a strategic asset, which boosts its legitimacy and potentially drives long-term adoption.
Institutional demand for Bitcoin has remained strong so far this week. According to SoSoValue data, US spot Bitcoin Exchange Traded Funds (ETFs) have recorded a total inflow of $1.02 billion so far this week, continuing their two-week streak of inflows.
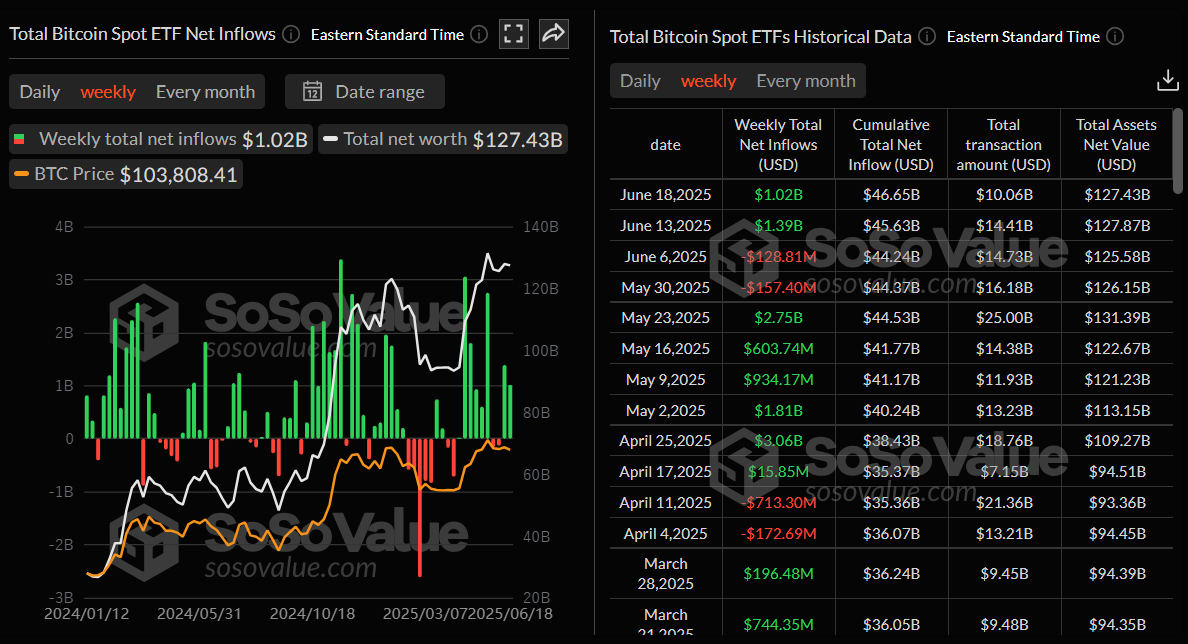
Total Bitcoin spot ETFs weekly chart. Source: SoSoValue
BTC could head toward $100,000 if it closes below the 50-day EMA
Bitcoin price drew liquidity from its Fair Value Gap (FVG) around $108,064 on Monday and declined by 2.10% the following day. BTC has tested and found support multiple times around the 50-day Exponential Moving Average (EMA) at approximately $103,200, highlighting its strength as a dynamic support. At the time of writing on Friday, BTC recovers slightly, trading at $106,400.
If BTC continues its correction and closes below the 50-day EMA at $103,200 on a daily basis, it could extend the decline to retest its key psychologically important level at $100,000.
The Relative Strength Index (RSI) momentum indicator on the daily chart is steading just above its neutral level of 50, reading 52, which indicates indecisiveness among investors. The Moving Average Convergence Divergence (MACD) indicator displayed a bearish crossover last week. It also shows rising red histogram bars below its neutral level, indicating bearish momentum and giving credence to a downward trend.
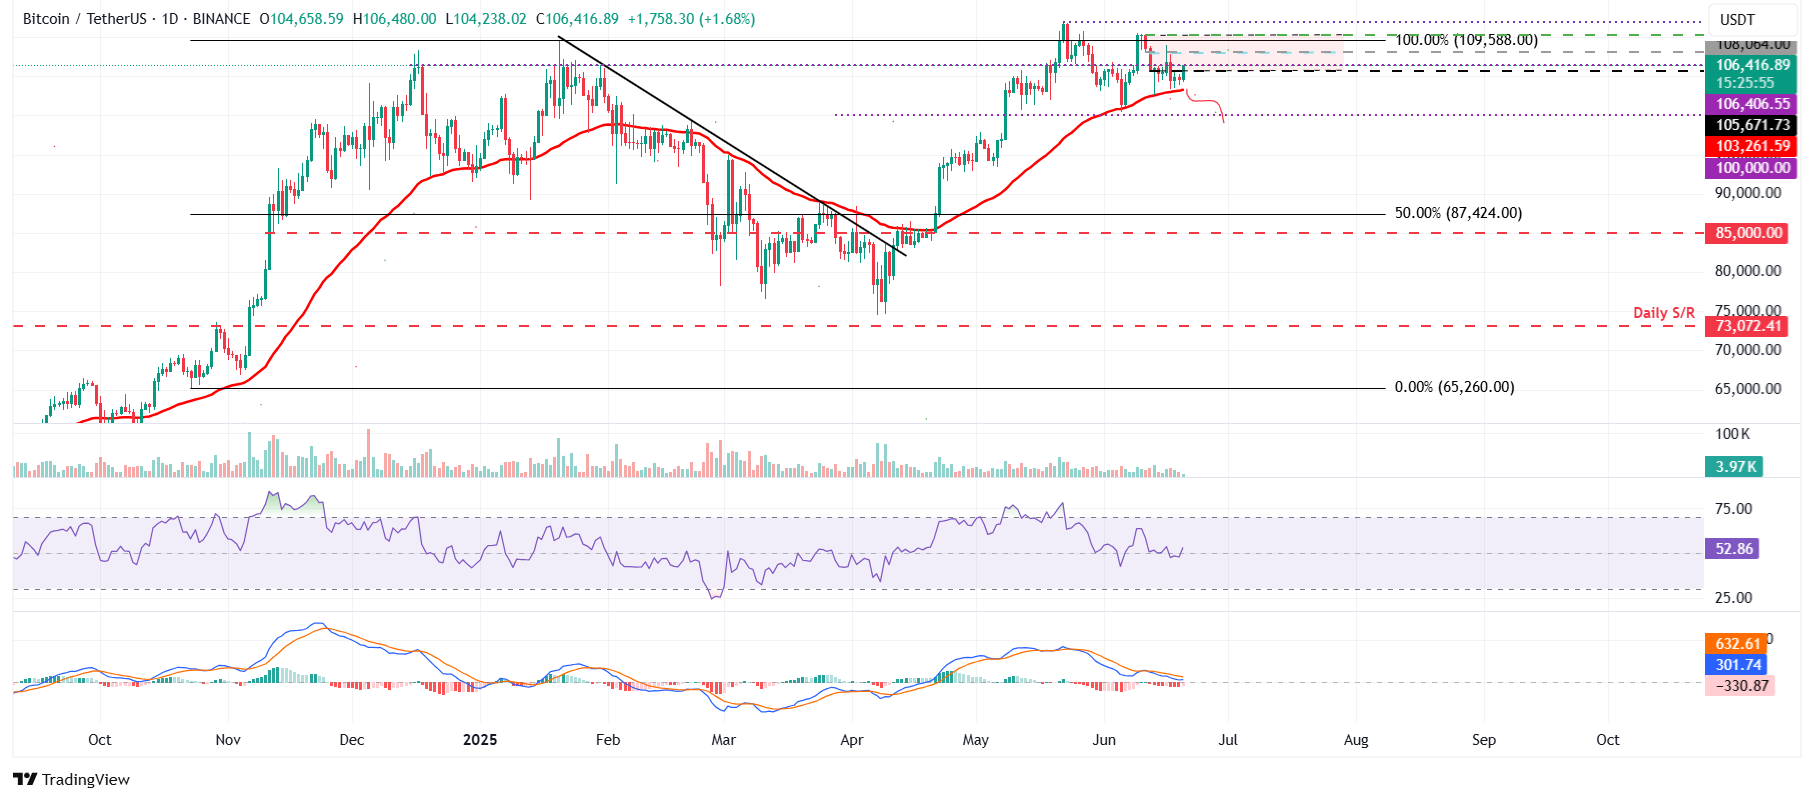
BTC/USDT daily chart
However, if BTC closes above its FVG level at $108,064, it could extend the recovery toward retesting the May 22 all-time high of $111,980.
Are you looking to stay ahead of market trends? Join Mitrade’s WhatsApp channel now to unlock endless trading opportunities!
By following Mitrade on WhatsApp, you’ll gain:
Leading Edge: Real-time market updates to track price movements in forex, commodities, and indices.
Professional Insights: Expert analysis and trading strategies to boost your performance.
Global Perspective: Stay informed on central bank policies, geopolitical events, and macroeconomic trends.
Scan the QR code to join instantly and receive timely notifications, ensuring you never miss critical market insights.

Read more
* The content presented above, whether from a third party or not, is considered as general advice only. This article should not be construed as containing investment advice, investment recommendations, an offer of or solicitation for any transactions in financial instruments.


