


US Dollar remains on the back foot after Trump lashes out at Powell
- The US Dollar trades flat on Tuesday after hitting a three-year low on Monday.
- Markets brace for a slew of Fed speakers and Tesla earnings after the closing bell.
- The US Dollar Index remains below the 100.00 marker as Trump intensifies his attacks on Fed Chair Jerome Powell.
The US Dollar Index (DXY), which tracks the performance of the US Dollar (USD) against six major currencies, trades broadly flat on Tuesday near a three-year low, consolidating Monday’s losses. Markets got caught by surprise as the US Dollar took a hit during Asian trading hours while European and US markets were trading on limited capacity due to the Easter Monday bank holiday. United States President Donald Trump has shifted his focus now to the Federal Reserve (Fed) and lashed out at its Chairman Jerome Powell, calling him “a major loser" for not lowering interest rates while looking at ways to get rid of the Chairman, putting further downward pressure on the Greenback.
On the economic calendar front, all eyes are on the leading Purchasing Managers Index (PMI) preliminary data for April on Wednesday and the Durable Goods orders on Thursday. For this Tuesday, a slew of Fed speakers are lined up to speak, while the less-important Richmond Fed Manufacturing data for April will also be published.
In US equity markets, the focus will be on the Tesla (TSLA) earnings call after the US closing bell, when CEO Elon Musk could announce his departure date from the Department of Government Efficiency (DOGE).
Daily digest market movers: Fed speakers all around
- At 13:30 GMT, Patrick Harker, President of the Federal Reserve Bank of Philadelphia, participates in a seminar on economic development at the University of Pennsylvania, focusing on regional growth and financial inclusion.
- At 14:00 GMT, Fed Vice Chair Philip Jefferson gives a speech on "Economic mobility and the Dual Mandate" at the Federal Reserve Bank of Philadelphia Economic Mobility Summit, Philadelphia.
- The Richmond Fed Manufacturing Index for April is due in that same time span, around 14:00 GMT. Expectations are for further contraction to -6, coming from -4 in the previous reading.
- Minneapolis Fed President Neel Kashkari will speak around 17:40 GMT as he participates in a Q&A at the US Chamber of Commerce Global Summit in Washington DC.
- Closing remarks for this Tuesday around 22:00 GMT from Federal Reserve Bank Governor Adriana Kugler, who gives a speech on "Transmission of Monetary Policy" at the Heller-Hurwicz Economics Institute 2025 Roundtable, Minneapolis.
- After the US closing bell, all eyes will shift to Tesla earnings. Rumors are that Tesla Chairman Elon Musk is set to announce in the call his departure date from the Department of Government Efficiency (DOGE), NBC reports.
- Equities are looking for direction on Tuesday with minor losses in Europe while US equities are up 1% on average as they try to rebound from Monday’s losses.
- The CME FedWatch tool shows the chance of an interest rate cut by the Federal Reserve in May’s meeting at 10.4% against no changes at 89.6%. The June meeting is still having around 62% chances for a rate cut.
- The US 10-year yields trade around 4.41% after US bonds have been selling off quite substantially over the past few weeks.
US Dollar Index Technical Analysis: Dipping its toe
The US Dollar Index (DXY) is saying goodbye to the 100.00 marker for now. Incurred losses from Monday are being consolidated this Tuesday while the Relative Strength Index (RSI) is penetrating the oversold area. More downside could be rather limited from here as some sort of technical bounce looks likely before the DXY could drop another leg lower.
On the upside, first resistance comes in at 99.58, which could trigger a firm rejection in any recovery attempts. Should Dollar bulls resurface, look for 100.22 with a break back above 100.00 as a bullish signal of their return. A firm recovery would be a return to 101.90, which acted as head-and-shoulders base line since 2023.
On the other hand, the low at 97.73 is very close by and could snap at any moment. Further below, a rather thin technical support comes in at 96.94, before starting to look at the lower levels of this new price range. These would be at 95.25 and 94.56, which would mean fresh lows not seen since 2022.
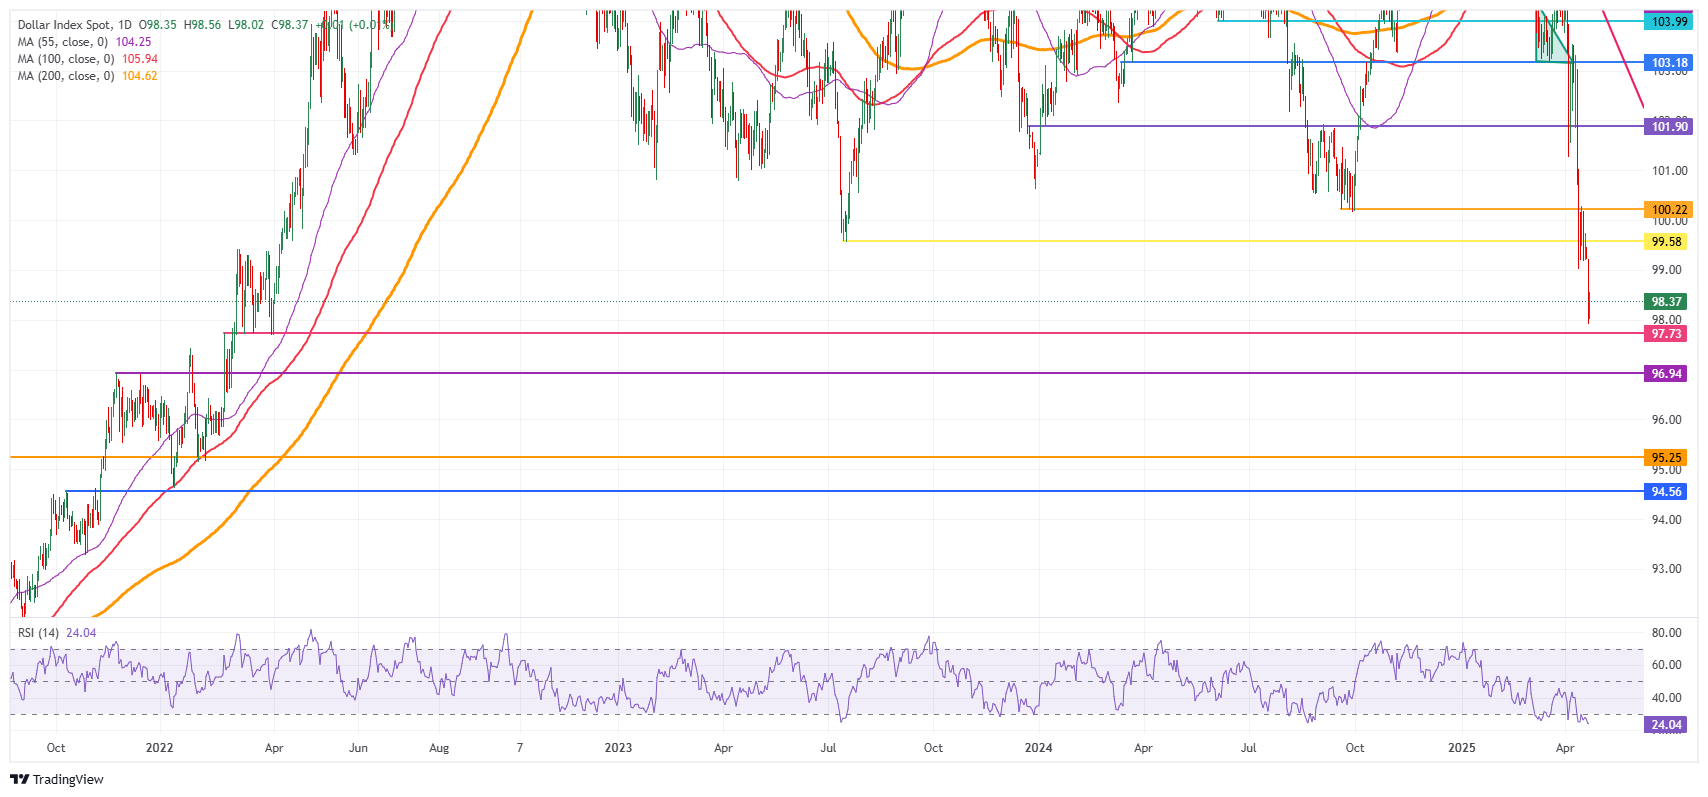
US Dollar Index: Daily Chart
US Dollar FAQs
The US Dollar (USD) is the official currency of the United States of America, and the ‘de facto’ currency of a significant number of other countries where it is found in circulation alongside local notes. It is the most heavily traded currency in the world, accounting for over 88% of all global foreign exchange turnover, or an average of $6.6 trillion in transactions per day, according to data from 2022. Following the second world war, the USD took over from the British Pound as the world’s reserve currency. For most of its history, the US Dollar was backed by Gold, until the Bretton Woods Agreement in 1971 when the Gold Standard went away.
The most important single factor impacting on the value of the US Dollar is monetary policy, which is shaped by the Federal Reserve (Fed). The Fed has two mandates: to achieve price stability (control inflation) and foster full employment. Its primary tool to achieve these two goals is by adjusting interest rates. When prices are rising too quickly and inflation is above the Fed’s 2% target, the Fed will raise rates, which helps the USD value. When inflation falls below 2% or the Unemployment Rate is too high, the Fed may lower interest rates, which weighs on the Greenback.
In extreme situations, the Federal Reserve can also print more Dollars and enact quantitative easing (QE). QE is the process by which the Fed substantially increases the flow of credit in a stuck financial system. It is a non-standard policy measure used when credit has dried up because banks will not lend to each other (out of the fear of counterparty default). It is a last resort when simply lowering interest rates is unlikely to achieve the necessary result. It was the Fed’s weapon of choice to combat the credit crunch that occurred during the Great Financial Crisis in 2008. It involves the Fed printing more Dollars and using them to buy US government bonds predominantly from financial institutions. QE usually leads to a weaker US Dollar.
Quantitative tightening (QT) is the reverse process whereby the Federal Reserve stops buying bonds from financial institutions and does not reinvest the principal from the bonds it holds maturing in new purchases. It is usually positive for the US Dollar.
Recommended Articles


