


US Dollar flirts with fresh September high ahead of FOMC Minutes
- The US Dollar trades in the green against nearly every G10 currency on Wednesday.
- Chinese markets are selling off again for the second day in a row on weak Golden Week numbers.
- The US Dollar Index trades above 102.50 and looks to be on its way to 103.00.
The US Dollar (USD) is tying up with gains again with markets still having concerns over China. Recent Chinese data released on domestic activity during the Golden Week revealed that there has been less spending as anticipated. This keeps concerns on China’s economic activity – both domestic and international – high on the bulletin board.
The economic calendar is again a very light one for this Wednesday. Besides a few light data points such as the Wholesale Inventories for August, the main event will be the release of the Federal Open Market Committee (FOMC) Minutes, curtailing the latest Federal Reserve rate decision in September. Markets will get to see the reasoning behind the 50 basis points rate cut and what it means for the November rate decision.
Daily digest market movers: China being dead weight this week
- Concerns on China are still keeping markets in a choke hold. Chinese equities are still selling off with the Hang Seng Index down near 1.5% at the closing bell. The Shanghai Composite fell over 7%.
- At 11:00 GMT, the Mortgage Bankers Association will release the weekly Mortgage Applications Index. Previous week showed a contraction by 1.3%. No forecast available.
- At 14:00 GMT, August Wholesale Inventories are due. Expectations are for a steady 0.2% growth as seen in July.
- Two Fed speakers on the docket this Wednesday:
- Around 16:30 GMT Federal Reserve Vice Chair Phillip Jefferson (a neutral FOMC member according to FXStreet’s Fed Tracker) delivers a speech at an event organized by the Charlotte Economics Club in Charlotte, North Carolina.
- At 22:00 GMT, Federal Reserve Bank of San Francisco President Mary Daly (also neutral according to the Fed Tracker) participates in a moderated conversation and a Q&A session at Boise State University.
- The US Treasury is heading to markets to auction a 10-year Note at 17:00 GMT.
- European equities are looking for direction, and are trying to push back against the negative drag from the Chinese sell-off, which has been restricted to just Chinese indices this Wednesday. US stock futures are down, less than a quarter of a percentage.
- The CME Fedwatch Tool shows an 88.6% chance of a 25 basis point (bps) interest rate cut at the next Fed meeting on November 7, while 11.4% is pricing in no rate cut. Chances for a 50 bps rate cut have been fully priced out now.
- The US 10-year benchmark rate trades at 4.02%, the highest level since mid-August.
US Dollar Index Technical Analysis: USD, the comeback kid
The US Dollar Index (DXY) is setting the record straight, back at the high of September and looks set to head higher. With a very chunky area of several pivotal levels just above 103.00, the question is how far this rally can go. Taking into account the Relative Strength Index (RSI), a test at 103.18 looks possible, but 104.00 looks to be out of the question.
The psychological 103.00 is the first level to tackle on the upside. Further up, the chart identifies 103.18 as the very final resistance level for this week. Once above there, a very choppy area emerges, with the 100-day Simple Moving Average (SMA) at 103.30, the 200-day SMA at 103.76, and the pivotal 103.99-104.00 levels in play.
On the downside, the 55-day SMA at 101.96 is the first line of defence, backed by the 102.00 round level and the pivotal 101.90 as support to catch any bearish pressure and trigger a bounce. If that level does not work out, 100.62 also acts as support. Further down, a test of the year-to-date low of 100.16 should take place before more downside. Finally, and that means giving up the big 100.00 level, the July 14, 2023, low at 99.58 comes into play.
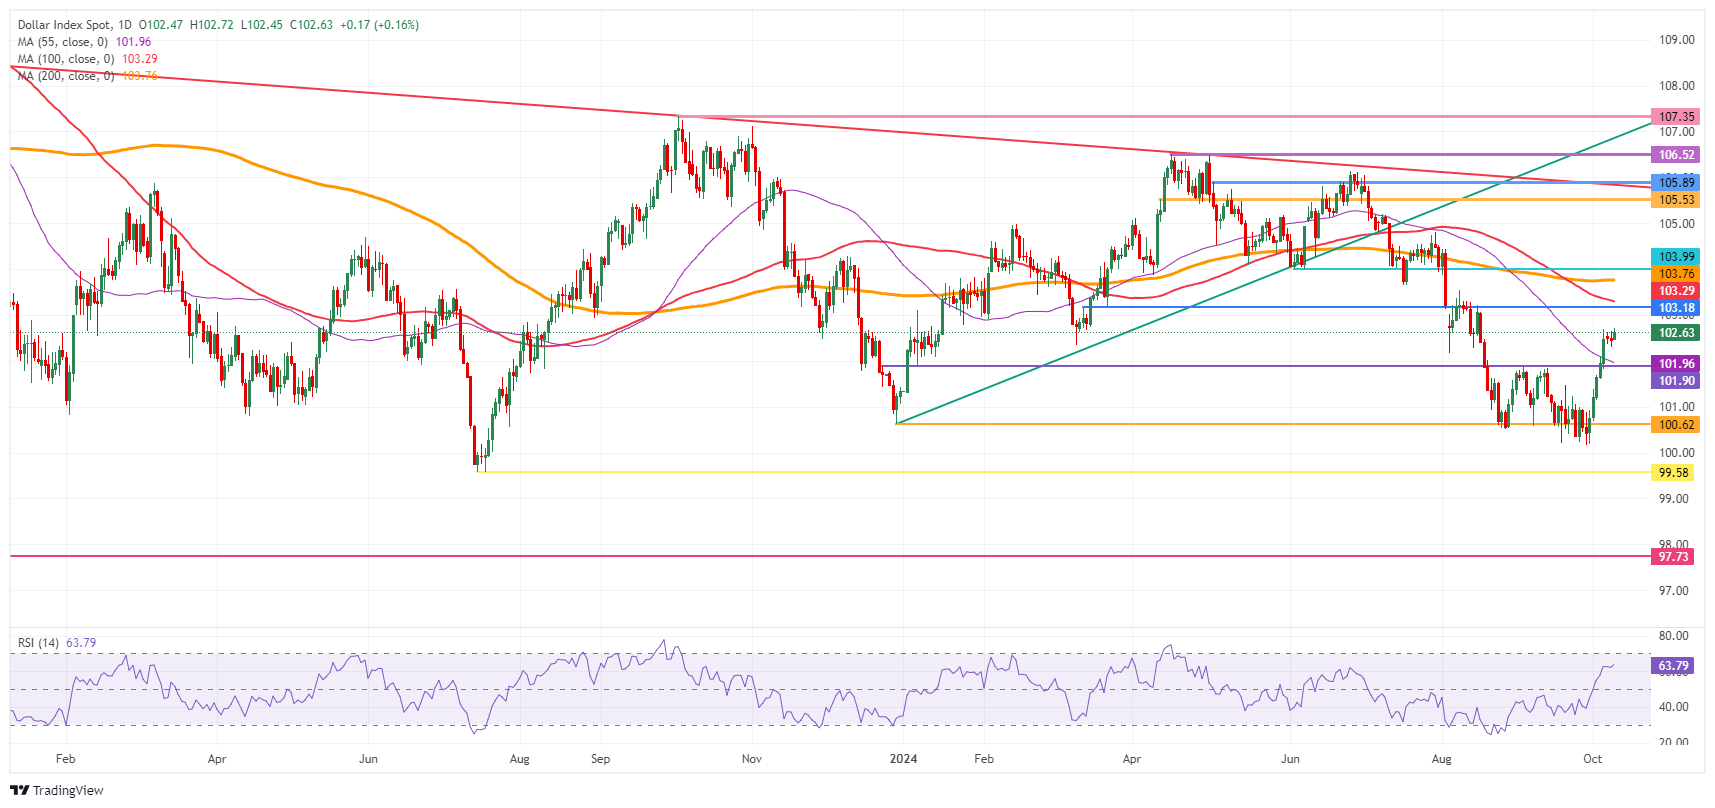
US Dollar Index: Daily Chart
US Dollar FAQs
The US Dollar (USD) is the official currency of the United States of America, and the ‘de facto’ currency of a significant number of other countries where it is found in circulation alongside local notes. It is the most heavily traded currency in the world, accounting for over 88% of all global foreign exchange turnover, or an average of $6.6 trillion in transactions per day, according to data from 2022. Following the second world war, the USD took over from the British Pound as the world’s reserve currency. For most of its history, the US Dollar was backed by Gold, until the Bretton Woods Agreement in 1971 when the Gold Standard went away.
The most important single factor impacting on the value of the US Dollar is monetary policy, which is shaped by the Federal Reserve (Fed). The Fed has two mandates: to achieve price stability (control inflation) and foster full employment. Its primary tool to achieve these two goals is by adjusting interest rates. When prices are rising too quickly and inflation is above the Fed’s 2% target, the Fed will raise rates, which helps the USD value. When inflation falls below 2% or the Unemployment Rate is too high, the Fed may lower interest rates, which weighs on the Greenback.
In extreme situations, the Federal Reserve can also print more Dollars and enact quantitative easing (QE). QE is the process by which the Fed substantially increases the flow of credit in a stuck financial system. It is a non-standard policy measure used when credit has dried up because banks will not lend to each other (out of the fear of counterparty default). It is a last resort when simply lowering interest rates is unlikely to achieve the necessary result. It was the Fed’s weapon of choice to combat the credit crunch that occurred during the Great Financial Crisis in 2008. It involves the Fed printing more Dollars and using them to buy US government bonds predominantly from financial institutions. QE usually leads to a weaker US Dollar.
Quantitative tightening (QT) is the reverse process whereby the Federal Reserve stops buying bonds from financial institutions and does not reinvest the principal from the bonds it holds maturing in new purchases. It is usually positive for the US Dollar.
Recommended Articles


