

US Dollar takes a breather in its rally ahead of NFP
- The US Dollar is set to close off this week in the green.
- Tensions in the Middle East together with pared bets of big Fed rate cuts are fueling safe-haven inflows to the Greenback.
- The US Dollar Index broke the September high at 101.90 but the jobs report data will decide the next move.
The US Dollar (USD) consolidates on Friday after trading firmly stronger this week, with all eyes on the US Employment Report and specifically on the Nonfarm Payrolls (NFP) numbers. The data will be pivotal as strong figures could move the DXY further away from the tight range it has been moving so far this month. Meanwhile, if numbers turn out weaker than expected, the Greenback could fall back into the range .
The economic calendar is housing only one main element: the aforementioned US Jobs Report. As always, the Nonfarm Payrolls print will take the most attention. However, elements such as the Average Hourly Wages and the Unemployment Rate could be the second-tier data that in the end will drive the US Dollar higher or lower after the initial volatile reaction.
Daily digest market movers: All eyes on data and Israel
- Expect some volatile moves in the Greenback if Israel strikes Iranian Oil fields. At the time of writing, discussions between Israel and the Biden administration for a green light on the attacks are still ongoing.
- At 12:30 GMT, the US Jobs Report for September is due:
- Nonfarm Payrolls are expected to fall to 140,000, coming from 142,000 in August.
- Monthly Average Hourly Earnings should ease further, to 0.3% from 0.4%.
- The Unemployment rate is expected to remain unchanged at 4.2%.
- At 13:00 GMT, Federal Reserve Bank of New York President John Williams delivers opening remarks at the event "The Future of New York City: Focus on Jobs" organized by the New York Fed.
- Equities are rebounding a touch across the board with Japan having closed off this Friday in the green. European equities post small gains, while US futures are flat.
- The CME Fedwatch Tool shows a 69.3% chance of a 25 basis-point rate cut at the next Fed meeting on November 7, while 30.7% is pricing in another 50-basis-point rate cut.
- The US 10-year benchmark rate trades at 3.85%, a 30-day high.
Economic Indicator
Nonfarm Payrolls
The Nonfarm Payrolls release presents the number of new jobs created in the US during the previous month in all non-agricultural businesses; it is released by the US Bureau of Labor Statistics (BLS). The monthly changes in payrolls can be extremely volatile. The number is also subject to strong reviews, which can also trigger volatility in the Forex board. Generally speaking, a high reading is seen as bullish for the US Dollar (USD), while a low reading is seen as bearish, although previous months' reviews and the Unemployment Rate are as relevant as the headline figure. The market's reaction, therefore, depends on how the market assesses all the data contained in the BLS report as a whole.
Read more.Next release: Fri Oct 04, 2024 12:30
Frequency: Monthly
Consensus: 140K
Previous: 142K
Source: US Bureau of Labor Statistics
America’s monthly jobs report is considered the most important economic indicator for forex traders. Released on the first Friday following the reported month, the change in the number of positions is closely correlated with the overall performance of the economy and is monitored by policymakers. Full employment is one of the Federal Reserve’s mandates and it considers developments in the labor market when setting its policies, thus impacting currencies. Despite several leading indicators shaping estimates, Nonfarm Payrolls tend to surprise markets and trigger substantial volatility. Actual figures beating the consensus tend to be USD bullish.
US Dollar Index Technical Analysis: Hitting Resistance
The US Dollar Index (DXY) has made a stellar recovery this week with the cherry on the cake Thursday, when it was able to break out of September’s range. The 55-day Simple Moving Average (SMA) at 102.05 has refused to let the DXY trade higher and shows its strength as a resistance level. Expect the US Jobs Report to be the catalyst that snaps that level for more upside or sees the DXY fall back into range.
The 55-day Simple Moving Average (SMA) at 102.05 has already acted as resistance and is the first level that needs to be broken for more upside. A leg higher, the chart identifies 103.18 as the very final level for this week. Once above there, a very choppy area emerges with the 100-day SMA at 103.36, the 200-day SMA at 103.75 and the pivotal 103.99-104.00 levels in play.
On the downside, 100.62 is flipping back from resistance into support in case the DXY closes above it this week. The fresh low of 2024 is at 100.16, so a test of this level should take place before more downside. Further down, and that means giving up the big 100.00 level, the July 14, 2023, low at 99.58 comes into play.
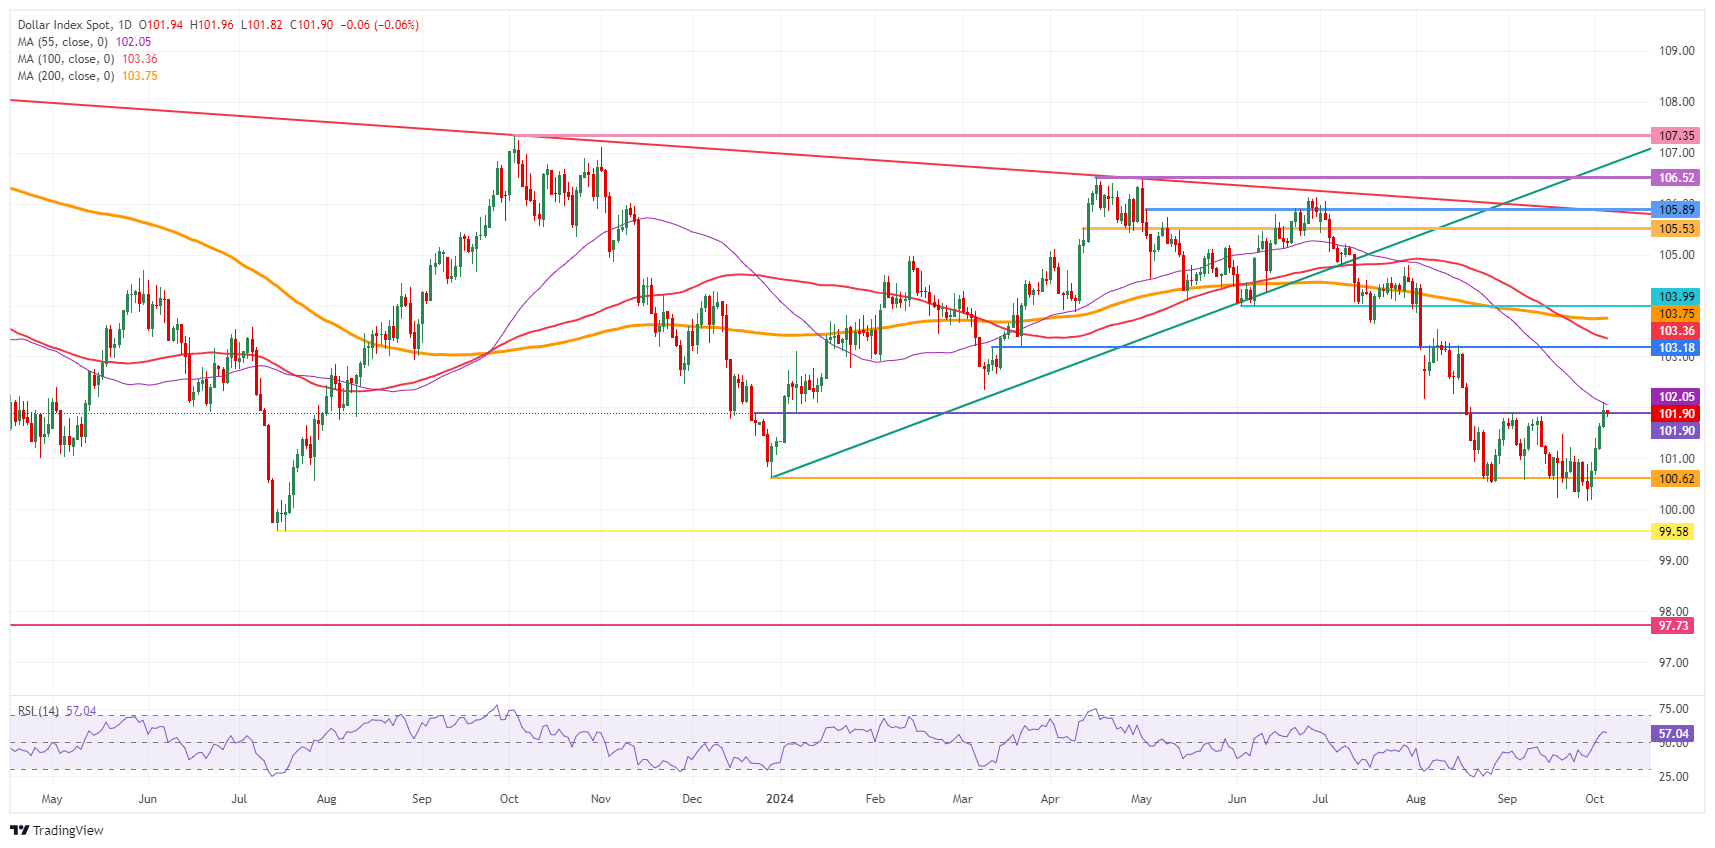
US Dollar Index: Daily Chart
US Dollar FAQs
The US Dollar (USD) is the official currency of the United States of America, and the ‘de facto’ currency of a significant number of other countries where it is found in circulation alongside local notes. It is the most heavily traded currency in the world, accounting for over 88% of all global foreign exchange turnover, or an average of $6.6 trillion in transactions per day, according to data from 2022. Following the second world war, the USD took over from the British Pound as the world’s reserve currency. For most of its history, the US Dollar was backed by Gold, until the Bretton Woods Agreement in 1971 when the Gold Standard went away.
The most important single factor impacting on the value of the US Dollar is monetary policy, which is shaped by the Federal Reserve (Fed). The Fed has two mandates: to achieve price stability (control inflation) and foster full employment. Its primary tool to achieve these two goals is by adjusting interest rates. When prices are rising too quickly and inflation is above the Fed’s 2% target, the Fed will raise rates, which helps the USD value. When inflation falls below 2% or the Unemployment Rate is too high, the Fed may lower interest rates, which weighs on the Greenback.
In extreme situations, the Federal Reserve can also print more Dollars and enact quantitative easing (QE). QE is the process by which the Fed substantially increases the flow of credit in a stuck financial system. It is a non-standard policy measure used when credit has dried up because banks will not lend to each other (out of the fear of counterparty default). It is a last resort when simply lowering interest rates is unlikely to achieve the necessary result. It was the Fed’s weapon of choice to combat the credit crunch that occurred during the Great Financial Crisis in 2008. It involves the Fed printing more Dollars and using them to buy US government bonds predominantly from financial institutions. QE usually leads to a weaker US Dollar.
Quantitative tightening (QT) is the reverse process whereby the Federal Reserve stops buying bonds from financial institutions and does not reinvest the principal from the bonds it holds maturing in new purchases. It is usually positive for the US Dollar.
US Dollar PRICE This week
The table below shows the percentage change of US Dollar (USD) against listed major currencies this week. US Dollar was the strongest against the Japanese Yen.
| USD | EUR | GBP | JPY | CAD | AUD | NZD | CHF | |
|---|---|---|---|---|---|---|---|---|
| USD | 1.24% | 1.60% | 2.96% | 0.31% | 0.89% | 2.16% | 1.21% | |
| EUR | -1.24% | 0.36% | 1.71% | -0.88% | -0.28% | 0.95% | 0.05% | |
| GBP | -1.60% | -0.36% | 1.49% | -1.24% | -0.64% | 0.58% | -0.31% | |
| JPY | -2.96% | -1.71% | -1.49% | -2.51% | -2.05% | -0.74% | -1.65% | |
| CAD | -0.31% | 0.88% | 1.24% | 2.51% | 0.62% | 1.85% | 0.94% | |
| AUD | -0.89% | 0.28% | 0.64% | 2.05% | -0.62% | 1.23% | 0.32% | |
| NZD | -2.16% | -0.95% | -0.58% | 0.74% | -1.85% | -1.23% | -0.91% | |
| CHF | -1.21% | -0.05% | 0.31% | 1.65% | -0.94% | -0.32% | 0.91% |
The heat map shows percentage changes of major currencies against each other. The base currency is picked from the left column, while the quote currency is picked from the top row. For example, if you pick the US Dollar from the left column and move along the horizontal line to the Japanese Yen, the percentage change displayed in the box will represent USD (base)/JPY (quote).
Recommended Articles


