


Dow Jones Industrial Average soars on rate cut hopes, sets new all-time high
- Dow Jones climbed 450 points to set a fresh all-time peak above 40,200.00.
- Markets are broadly shrugging off an acceleration of US PPI wholesale inflation.
- US consumer sentiment surveys worsened, but 5-year inflation expectations eased.
The Dow Jones Industrial Average (DJIA) soared over 450 points on Friday as markets pile back into renewed hopes for rate cuts from the Federal Reserve (Fed) in September even as US Producer Price Index (PPI) wholesale inflation accelerated faster than expected in June. Markets have entirely buried the needle on rate cut forecasts, pricing in three rate cuts in 2024 and a 95% chance of a rate trim on September 18.
June’s US core PPI wholesale inflation accelerated to 3.0% YoY, entirely eclipsing the forecast 2.5%, and the previous period’s print also saw an upside revision to 2.6% from the initial 2.3%. Despite the sharp uptick in producer-level inflation, markets are instead refocusing on a decline in Consumer Price Inflation (CPI) inflation earlier in the week in order to lean firmly into rate cut hopes.
According to the CME’s FedWatch tool, rate market bets of at least a quarter-point rate trim at the Federal Open Market Committee’s (FOMC) September 18 rate call. Rate traders are also now pricing in at least three rate cuts in total for 2024, a step above the Fed’s own projected one or two rate cuts by December.
Elsewhere in US data on Friday, the University of Michigan’s Consumer Sentiment Index survey stumbled to a seven-month low of 66.0 from the previous 68.2, undercutting the forecast uptick to 68.5 as US consumers turn increasingly discouraged about the economic outlook. UoM 5-year Consumer Inflation Expectations eased slightly in July, ticking down to 2.9% from the previous 3.0%, but markets are putting significant effort into ignoring how much higher long-run consumer inflation expectations are compared to the Fed’s target annual inflation rate of 2.0%.
Dow Jones news
Dow Jones soared on Friday, rising a scorching 450 points and is set to chalk in one of the index’s best three-day performances for the year. All but four of the Dow Jones’ constituent securities are in the green on Friday, with losses led by JPMorgan Chase & Co. (JPM), which declined -0.94% to $205.50 per share. Despite posting better-than-expected second-quarter earnings, the stock is still sliding after trading into all-time highs ahead of Q2 earnings. JPM notched in QoQ profits of 18.1 billion, bringing EPS to $6.12, handily beating the forecast estimates of $5.88.
On the high side, Intel Corp. (INTC) rose nearly 5%, climbing over $35.00 per share as the AI market rush continues. Intel Chief Technology Officer Greg Lavender noted recently that he anticipates Intel to reach $1 billion in annual subscription revenue from AI-related cloud computing subscriptions by fiscal year end of 2027. While the growth projection in AI services revenue is nothing short of stellar, and is helping to bolster Intel stock even higher, the figure is still dwarfed by Intel’s main semiconductor business, which routinely pulls in revenue in excess of $50 billion annually.
Dow Jones technical outlook
Dow Jones tapped into a fresh all-time high of 40,260.24 on Friday, climbing over 400 points as broader markets surge higher. DJIA climbed over a full percent through the last session of the trading week, and the Dow Jones is now up over 6% from the last notable swing low into the 38,000.00 handle in late May.
The Dow Jones index, posting fresh record peak bids, is now up 6.82% in 2024, and has climbed an impressive 24.59% from the index’s swing low into 32,300.00 in late 2023. Daily candles are trading well above the 200-day Exponential Moving Average (EMA) at 37,733.00, and bidders will be looking to put distance between bids and the nearest technical floor priced in at the 50-day EMA near 39,095.00.
Dow Jones five minute chart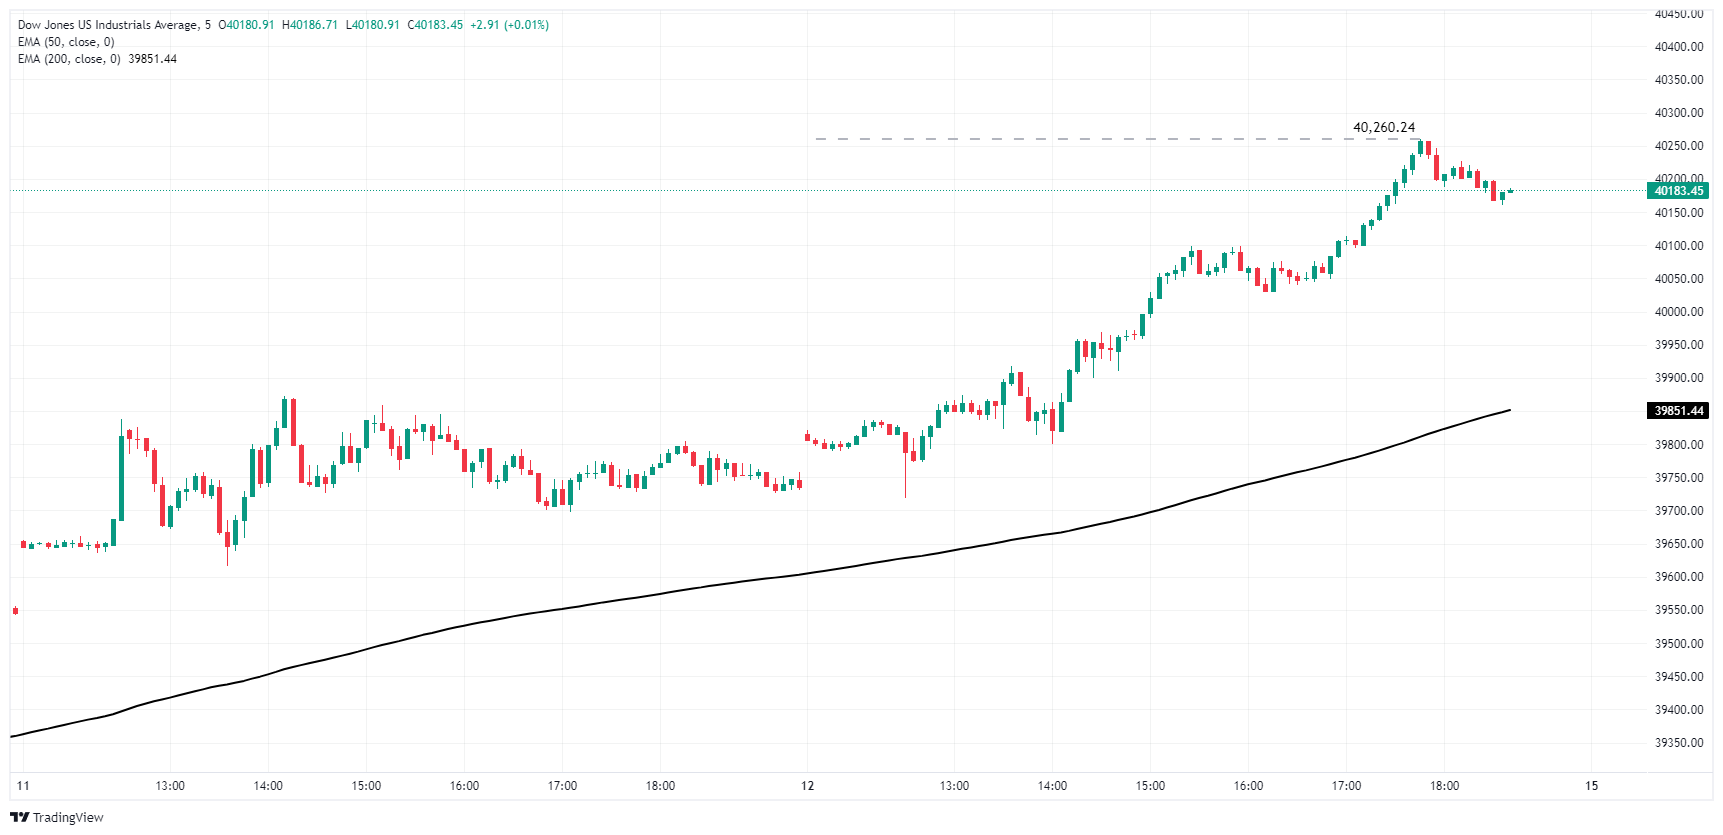
Dow Jones daily chart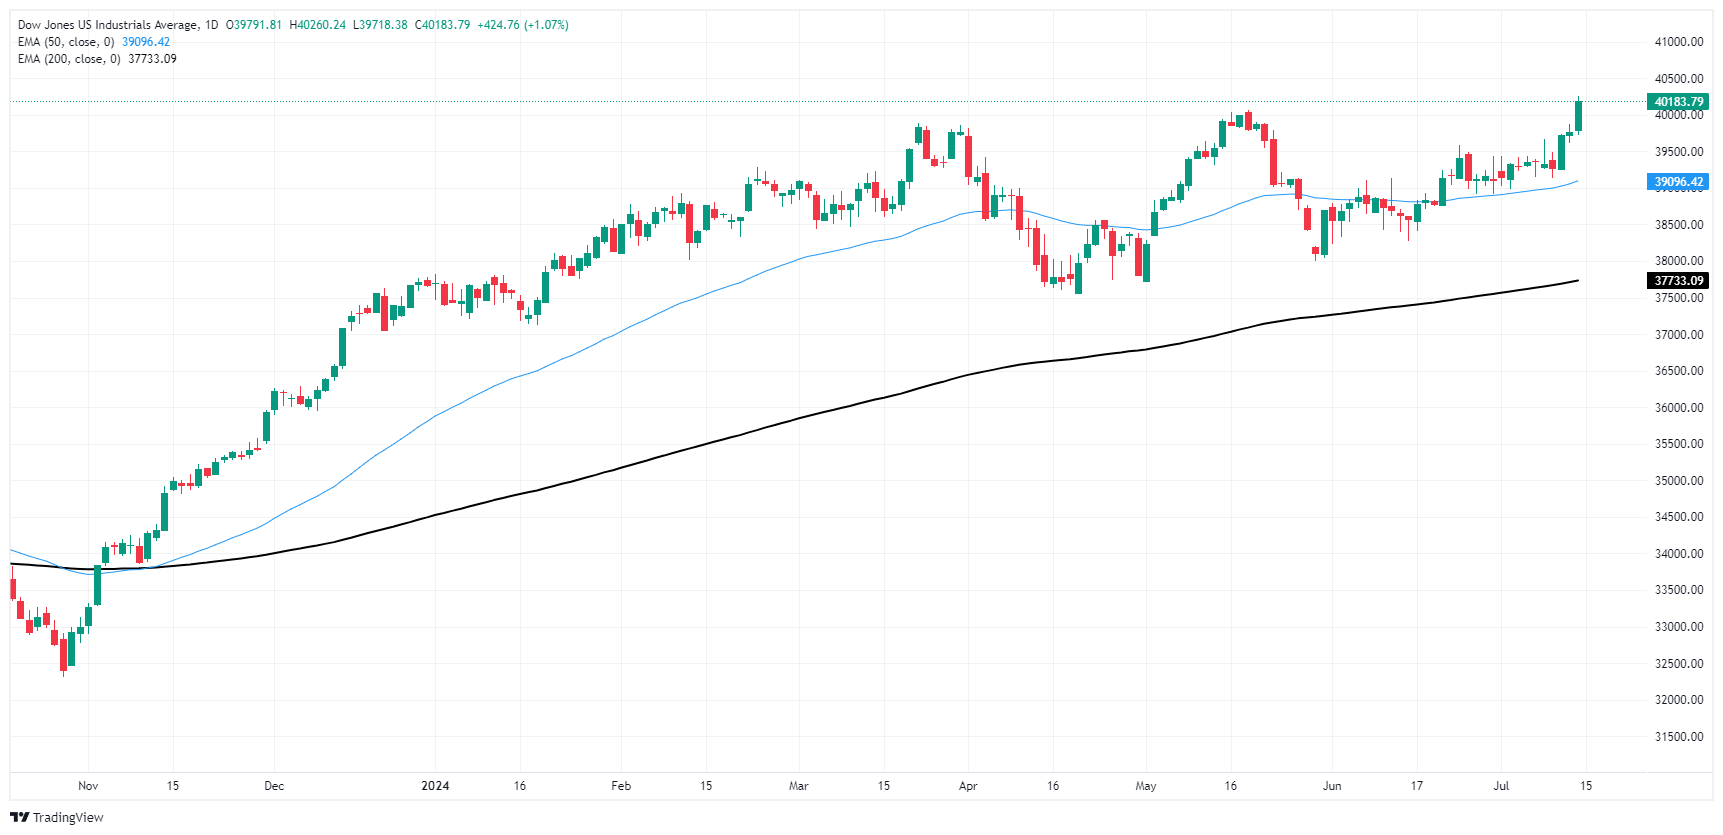
Dow Jones FAQs
The Dow Jones Industrial Average, one of the oldest stock market indices in the world, is compiled of the 30 most traded stocks in the US. The index is price-weighted rather than weighted by capitalization. It is calculated by summing the prices of the constituent stocks and dividing them by a factor, currently 0.152. The index was founded by Charles Dow, who also founded the Wall Street Journal. In later years it has been criticized for not being broadly representative enough because it only tracks 30 conglomerates, unlike broader indices such as the S&P 500.
Many different factors drive the Dow Jones Industrial Average (DJIA). The aggregate performance of the component companies revealed in quarterly company earnings reports is the main one. US and global macroeconomic data also contributes as it impacts on investor sentiment. The level of interest rates, set by the Federal Reserve (Fed), also influences the DJIA as it affects the cost of credit, on which many corporations are heavily reliant. Therefore, inflation can be a major driver as well as other metrics which impact the Fed decisions.
Dow Theory is a method for identifying the primary trend of the stock market developed by Charles Dow. A key step is to compare the direction of the Dow Jones Industrial Average (DJIA) and the Dow Jones Transportation Average (DJTA) and only follow trends where both are moving in the same direction. Volume is a confirmatory criteria. The theory uses elements of peak and trough analysis. Dow’s theory posits three trend phases: accumulation, when smart money starts buying or selling; public participation, when the wider public joins in; and distribution, when the smart money exits.
There are a number of ways to trade the DJIA. One is to use ETFs which allow investors to trade the DJIA as a single security, rather than having to buy shares in all 30 constituent companies. A leading example is the SPDR Dow Jones Industrial Average ETF (DIA). DJIA futures contracts enable traders to speculate on the future value of the index and Options provide the right, but not the obligation, to buy or sell the index at a predetermined price in the future. Mutual funds enable investors to buy a share of a diversified portfolio of DJIA stocks thus providing exposure to the overall index.
Recommended Articles


