


US Dollar Index Price Forecast: Remains sticky to 20-day EMA
- The USD Index is slightly lower to near 100.90 amid risk-on market sentiment.
- Iran receives a 10-day cessation of strikes proposal from mediators.
- Investors await the flash US S&P Global PMI data for July.
The US Dollar (USD) trades marginally lower against its major currency peers in Tuesday’s European session, as the appeal of safe-haven assets has diminished due to hopes of a ceasefire between the United States (US) and Iran.
At press time, the US Dollar Index (DXY), which gauges the Greenback’s value against six major currencies, trades 0.1% lower to near 100.90. S&P500 futures are up 0.45% to near 7,477, reflecting risk-on market sentiment.
US Dollar Price Today
The table below shows the percentage change of US Dollar (USD) against listed major currencies today. US Dollar was the weakest against the Australian Dollar.
| USD | EUR | GBP | JPY | CAD | AUD | NZD | CHF | |
|---|---|---|---|---|---|---|---|---|
| USD | -0.08% | -0.02% | 0.11% | -0.03% | -0.34% | -0.33% | 0.02% | |
| EUR | 0.08% | 0.06% | 0.19% | 0.05% | -0.23% | -0.25% | 0.10% | |
| GBP | 0.02% | -0.06% | 0.13% | -0.00% | -0.30% | -0.31% | 0.04% | |
| JPY | -0.11% | -0.19% | -0.13% | -0.14% | -0.43% | -0.47% | -0.09% | |
| CAD | 0.03% | -0.05% | 0.00% | 0.14% | -0.30% | -0.31% | 0.04% | |
| AUD | 0.34% | 0.23% | 0.30% | 0.43% | 0.30% | -0.02% | 0.34% | |
| NZD | 0.33% | 0.25% | 0.31% | 0.47% | 0.31% | 0.02% | 0.36% | |
| CHF | -0.02% | -0.10% | -0.04% | 0.09% | -0.04% | -0.34% | -0.36% |
The heat map shows percentage changes of major currencies against each other. The base currency is picked from the left column, while the quote currency is picked from the top row. For example, if you pick the US Dollar from the left column and move along the horizontal line to the Japanese Yen, the percentage change displayed in the box will represent USD (base)/JPY (quote).
The US-Iran ceasefire hopes emerged after Tehran confirmed receiving a 10-day cessation of strikes proposal from mediators to find ways to revive the interim deal with the United States (US). This also led to a steep correction in oil prices.
On the domestic front, investors await the preliminary US S&P Global Purchasing Managers’ Index (PMI) data for July, which will be released on Friday. The Manufacturing PMI is expected to arrive at 54.5, higher than 53.9 in June, while the Services PMI is seen lower at 51.0 from the previous reading of 51.2.
USD Index technical analysis
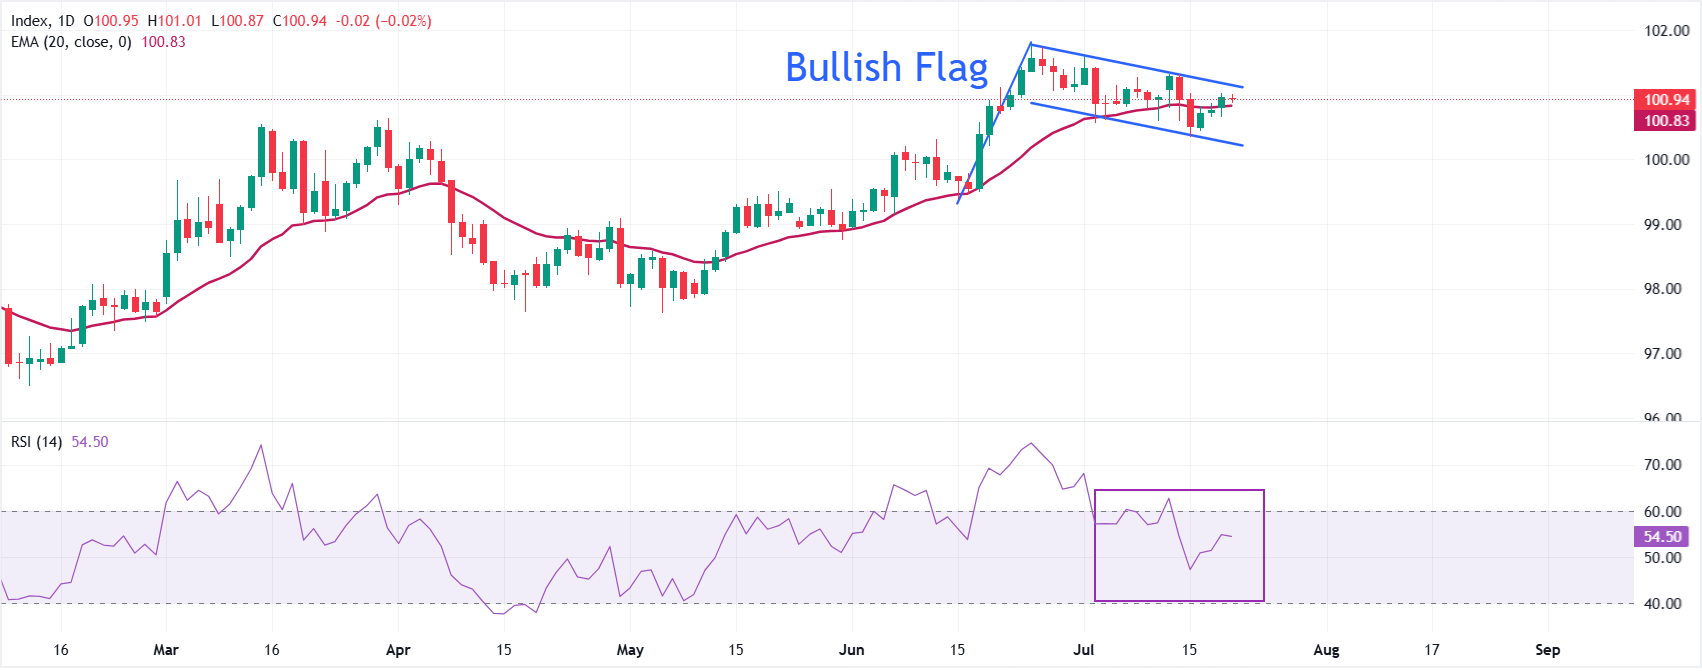
The Dollar Index Spot trades lower at around 100.90 at press time, but is broadly sideways while remaining sticky to the 20-day exponential moving average (EMA), which is at 100.83. The formation of a Bullish Flag pattern suggests that the overall trend is still bullish, given that its breakout after a consolidation results in the continuation of the upside trend.
The Relative Strength Index (14) near 54.50 suggests balanced momentum, reinforcing a neutral near-term bias as the index consolidates within the recent range.
On the topside, immediate resistance is located at the channel’s upper band near 101.13, and only a sustained break above this level would allow it to revisit the yearly high at 101.80. On the downside, initial demand is seen at the 20-day EMA at 100.83, with the channel floor at 100.23 forming a secondary support zone; a clear move below this latter level would signal a deeper corrective phase within the broader uptrend.
(The technical analysis of this story was written with the help of an AI tool. Know more.)
Economic Indicator
S&P Global Manufacturing PMI
The S&P Global Manufacturing Purchasing Managers Index (PMI), released on a monthly basis, is a leading indicator gauging business activity in the US manufacturing sector. The data is derived from surveys of senior executives at private-sector companies from the manufacturing sector. Survey responses reflect the change, if any, in the current month compared to the previous month and can anticipate changing trends in official data series such as Gross Domestic Product (GDP), industrial production, employment and inflation. A reading above 50 indicates that the manufacturing economy is generally expanding, a bullish sign for the US Dollar (USD). Meanwhile, a reading below 50 signals that activity in the manufacturing sector is generally declining, which is seen as bearish for USD.
Read more.Next release: Fri Jul 24, 2026 13:45 (Prel)
Frequency: Monthly
Consensus: 54.5
Previous: 53.9
Source: S&P Global
Recommended Articles


