

Ethereum Whales Accumulate Over $4.1B In ETH In Two Weeks – Details

Source Newsbtc

Ethereum is showing renewed strength after a sharp but short-lived pullback. Following its recent high of $3,860, ETH dipped to the $3,500 zone — a key level that quickly attracted buying interest. Now, price action is pointing upward again, with Ethereum pushing to reclaim the $3,700 range, signaling bullish momentum may be back in control.

Despite the recent volatility, on-chain data support the case for continued upside. According to Santiment, whales have been aggressively accumulating ETH throughout the pullback. This surge in accumulation suggests that institutional players are positioning themselves ahead of the next leg of the rally, anticipating strength in the coming months. These strategic inflows have historically preceded sustained upward trends.

The resilience around the $3,500 level, combined with the swift recovery attempt, underscores Ethereum’s strong bullish structure. With a favorable macro environment, regulatory clarity, and mounting institutional interest, Ethereum appears poised for continued expansion as the second half of the year unfolds. All eyes are now on whether this bounce holds and leads to a renewed breakout above resistance.

Whales Add Ethereum as US Legal Clarity Boosts Bullish Outlook

Ethereum’s bullish momentum is being reinforced by aggressive accumulation from major investors. According to analyst Ali Martinez, whales have purchased more than 1.13 million ETH—worth approximately $4.18 billion—over the past two weeks. This surge in buying activity marks one of the most significant accumulation phases in recent months and signals rising confidence among institutional players.
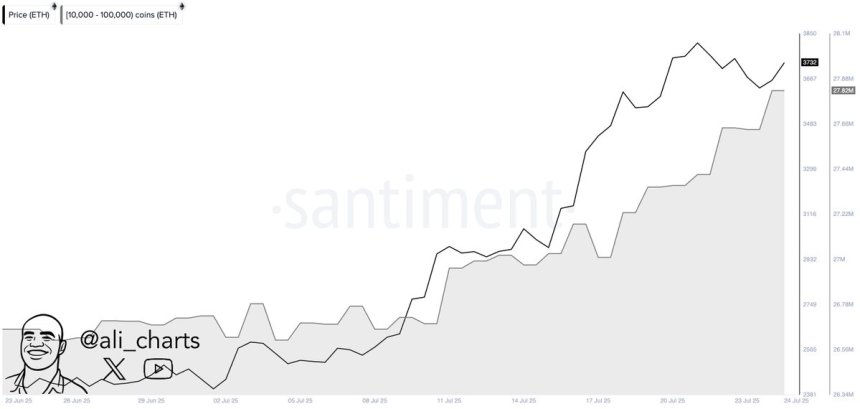
Ethereum whale accumulation | Source: Ali Martinez on X

The accumulation comes at a critical time for Ethereum, which has been consolidating near the $3,700 level after a brief pullback from its $3,860 high. This whale activity not only adds fuel to the ongoing price recovery but also strengthens Ethereum’s bullish structure heading into the second half of the year.

Beyond market behavior, macro and regulatory shifts are also favoring Ethereum and the broader altcoin market. The recent passage of the GENIUS Act and Clarity Act by the US Congress marks a pivotal moment for crypto legislation. These new laws offer long-sought legal clarity for decentralized finance (DeFi) platforms and digital assets, encouraging US-based innovation and capital flows into the space.

This evolving regulatory framework removes one of the biggest barriers for institutional adoption of Ethereum and DeFi. With clearer rules and a growing appetite for ETH among whales, the stage is set for a potentially explosive rally if current momentum holds.

ETH Holds Strong After Pullback

Ethereum (ETH) is showing renewed strength after a brief correction from its local top at $3,860. As seen in the 4-hour chart, ETH dipped to $3,500 but quickly bounced, reclaiming the $3,700 zone and closing in on key resistance at $3,776 and $3,860. This rebound indicates strong buyer interest and resilience in the uptrend.
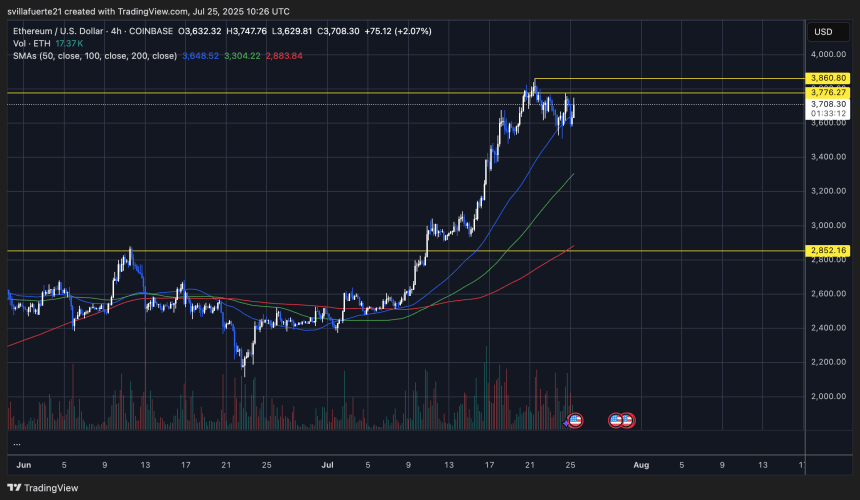
ETH consolidates below key levels | Source: ETHUSDT chart on TradingView

The price is now trading above all major moving averages (50, 100, and 200), which are stacked bullishly. The 50-SMA at $3,648 has provided dynamic support in recent sessions, while the 100-SMA and 200-SMA at $3,304 and $2,883, respectively, remain far below current price action—underscoring the strength of this upward move.

Volume is picking up slightly as ETH consolidates in a tight range near resistance. A breakout above $3,860 would likely open the door to a move toward new local highs, while failure to breach this level may result in another test of the $3,648 support area.

Featured image from Dall-E, chart from TradingView

Disclaimer: For information purposes only. Past performance is not indicative of future results.
placeholder
US August CPI lands tonight: after a 5.4% PPI shock, will the Fed hike on September 16?US August PPI came in at 5.4% year-on-year, above the 5.3% consensus, with core PPI at 4.6%. Traders have pushed the odds of a 25bp Fed hike on September 15-16 to around 70%. Tonight's CPI is the last major inflation print before the decision — here is the full calendar, the consensus numbers, and what a hot versus cool reading would mean for the dollar, yields, gold and stocks.
Author  Irene Q.
Sep 11, Fri
US August PPI came in at 5.4% year-on-year, above the 5.3% consensus, with core PPI at 4.6%. Traders have pushed the odds of a 25bp Fed hike on September 15-16 to around 70%. Tonight's CPI is the last major inflation print before the decision — here is the full calendar, the consensus numbers, and what a hot versus cool reading would mean for the dollar, yields, gold and stocks.
placeholder
Brent tests $108 as a key export pipeline stays shut — can the rally clear $110?Brent crude rose 2.55% to $106.97 and WTI 2.32% to $102.30 as a major regional export pipeline remained offline with no restart timeline. Front-month backwardation has widened to $5.53 from $3.84 a week ago, European gas is at its highest since December 2022, and one analyst sees $119.48 if talks stall.
Author  Irene Q.
Sep 14, Mon
Brent crude rose 2.55% to $106.97 and WTI 2.32% to $102.30 as a major regional export pipeline remained offline with no restart timeline. Front-month backwardation has widened to $5.53 from $3.84 a week ago, European gas is at its highest since December 2022, and one analyst sees $119.48 if talks stall.
placeholder
Fed hike odds near 90% into Wednesday's decision — how to trade the dollar, gold and the S&P 500A 0.3% monthly core CPI print has lifted the market-implied probability of a 25bp Fed hike on 16 September to roughly 86.5% ~ 90%, which would be the first increase since July 2023. Here is the decision timeline, the pricing versus the forecasts, both scenarios, and the key levels for the dollar, gold and the S&P 500.
Author  Suzie
Sep 14, Mon
A 0.3% monthly core CPI print has lifted the market-implied probability of a 25bp Fed hike on 16 September to roughly 86.5% ~ 90%, which would be the first increase since July 2023. Here is the decision timeline, the pricing versus the forecasts, both scenarios, and the key levels for the dollar, gold and the S&P 500.
placeholder
Gold falls below $4,300 as higher US yields bolster Fed rate hike betsGold price (XAU/USD) tumbles to near $4,295 during the early Asian session on Tuesday. The precious metal faces some selling pressure as rising bond yields and surging energy prices strengthen expectations that the US Federal Reserve (Fed) will raise interest rates this week. 
Author  FXStreet
Yesterday 01: 23
Gold price (XAU/USD) tumbles to near $4,295 during the early Asian session on Tuesday. The precious metal faces some selling pressure as rising bond yields and surging energy prices strengthen expectations that the US Federal Reserve (Fed) will raise interest rates this week. 
placeholder
【Daily Brief】10-year Treasury yield briefly tops 5%, S&P 500 slips to 7,602 and the dollar firms at 99.3 as the Fed's decision eve beginsThe 10-year Treasury yield touched 5.014% on Monday — its first print above 5% since October 2023 — while the S&P 500 closed 0.48% lower at 7,619.98 and the dollar index firmed to 99.3. Here is the full market wrap ahead of Wednesday's FOMC decision, the dot plot and the August retail sales report, plus today's CLARITY Act Senate vote.
Author  Irene Q.
17 hours ago
The 10-year Treasury yield touched 5.014% on Monday — its first print above 5% since October 2023 — while the S&P 500 closed 0.48% lower at 7,619.98 and the dollar index firmed to 99.3. Here is the full market wrap ahead of Wednesday's FOMC decision, the dot plot and the August retail sales report, plus today's CLARITY Act Senate vote.
goTop
quote