


SPX6900 Price Forecast: Bullish continuation eyes new all-time high
- SPX6900 extends the Sunday recovery gains after an 18% rally last week.
- With renewed interest, Whales' sell-off cools, starting a new buying spree.
- The derivatives data indicate a spike in Open Interest, signaling increased inflow and rising bullish anticipation.
SPX6900 (SPX) meme coin edges higher by almost 2% at press time on Monday, following a 4.71% brilliant recovery the previous day. The renewed confidence of whales in the meme coin is suspected to have catalyzed the recovery, resulting in increased optimism in SPX derivatives.
Whale activity fuels SPX6900 recovery
Santiment’s SPX Supply Distribution tracks the sum of SPX6900 tokens held across all addresses based on a specific balance interval. A rise in the sum of tokens held by groups with high supply intervals indicates a surge in whale holdings, and vice versa.
The total of SPX held by investors with 100 million to 1 billion tokens stabilized above 147.57 million tokens after a drop from 151.55 million last week. This signals a cooling-off period in the sell-off phase of such whales, suppressing the selling pressure.
Meanwhile, investors with 10 million to 100 million tokens expand their holdings to 253.9 million SPX, up from 244.74 million SPX on Thursday. The relatively smaller investors, with 1 million to 10 million tokens, have reached a total of 309.11 million SPX, up from 292.04 million in the previous week.
 [08-1750048199323.16.16, 16 Jun, 2025].png)
SPX6900 supply distribution. Source: Santiment
Thus, the declining selling pressure from larger whales, while the buying force of relatively smaller whales increases, indicates a potential surge in SPX6900 meme coin.
Optimism sparks in SPX6900 derivatives
Coinglass data projects the SPX Open Interest (OI) rising by over 7% to reach $144.54 million, suggesting increased interest from traders driving the inflows. With the increased capital in SPX derivatives, a potential renewed interest in buying could catalyze the next price surge in SPX6900 meme coin.
On the other hand, the short-term recovery has wiped out $265K worth of bearish positions in SPX6900 derivatives. In comparison to $76K of long liquidations, the bears take a bigger hit, indicating increased dominance.
The long/short ratio helps compare the open bullish and bearish positions. A ratio over 1 indicates a greater number of longs, while a ratio below 1 translates to more short positions.
The data shows the SPX long/short ratio over the last 24 hours at 1.0182, indicating a marginal growth in long positions outpacing the bearish-aligned traders.
Finally, the OI-weighted funding rate deals with the fees paid to keep swap and spot prices aligned. In case of bullish activity, bulls must pay the positive funding rate to bears, and vice versa.
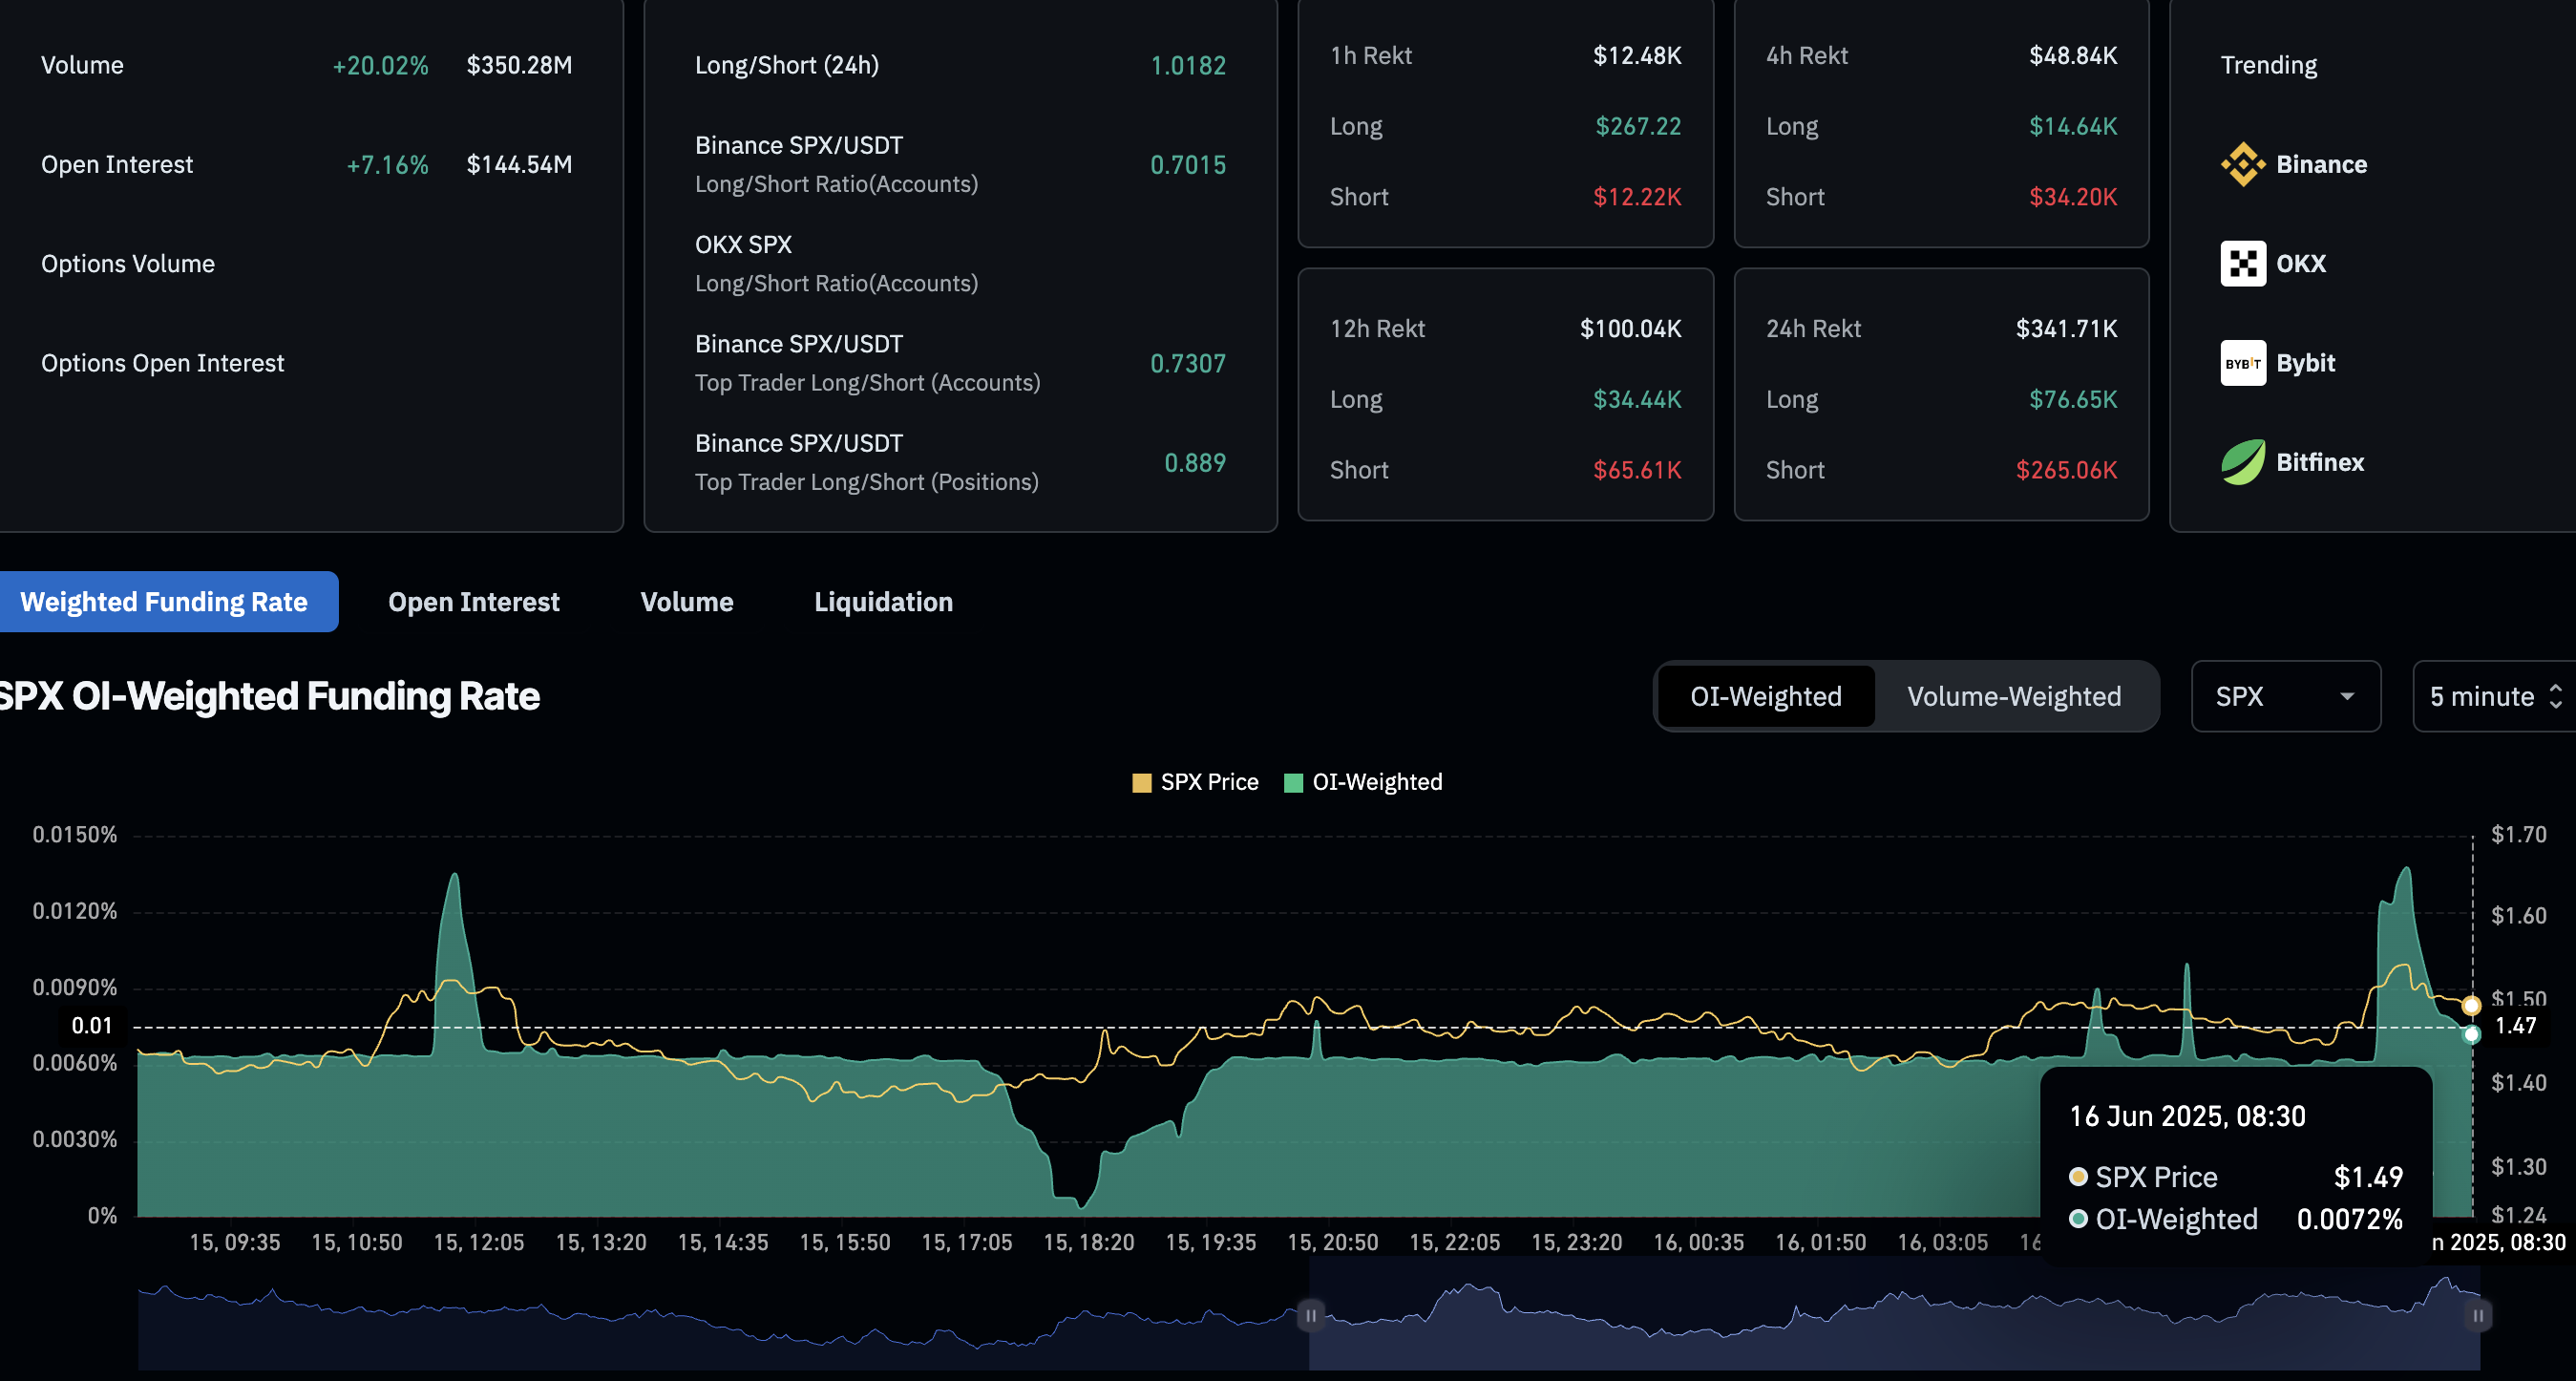
SPX6900 derivatives. Source: Coinglass.
At the time of writing, the OI-weighted funding rate stands at 0.0072%, indicating dominant bullish activity but a minor decline from the 0.0138% peak reached earlier in the day.
SPX Price Forecast: Continuation rally eyes new record high
The SPX6900 meme coin experienced a bearish reversal from $1.74 last week, resulting in weekly returns of just under 20%. Despite the shortcomings, SPX crossed its technical target of $1.55, becoming one of the high-performance meme coins to watch in this market cycle.
SPX bounced off the $1.28 support highlighted by the 78.6% Fibonacci level last week, retraced between January’s highest daily close at $1.55 and March’s lowest close at $0.29. Sustaining the bullish momentum, the meme coin challenges the $1.55 resistance with the recent reversal.
A clean push in daily closing above the all-time high closing price at $1.61 could extend the recovery to the 1.272 Fibonacci level at $1.89.
The Relative Strength Index (RSI) at 67 hovers slightly below the overbought boundary line, indicating underlying bullish resilience. However, the Moving Average Convergence/Divergence (MACD) indicator closes towards its signal line for a bearish crossover, signaling a potential correction. Thus, the momentum indicators provide mixed signals.
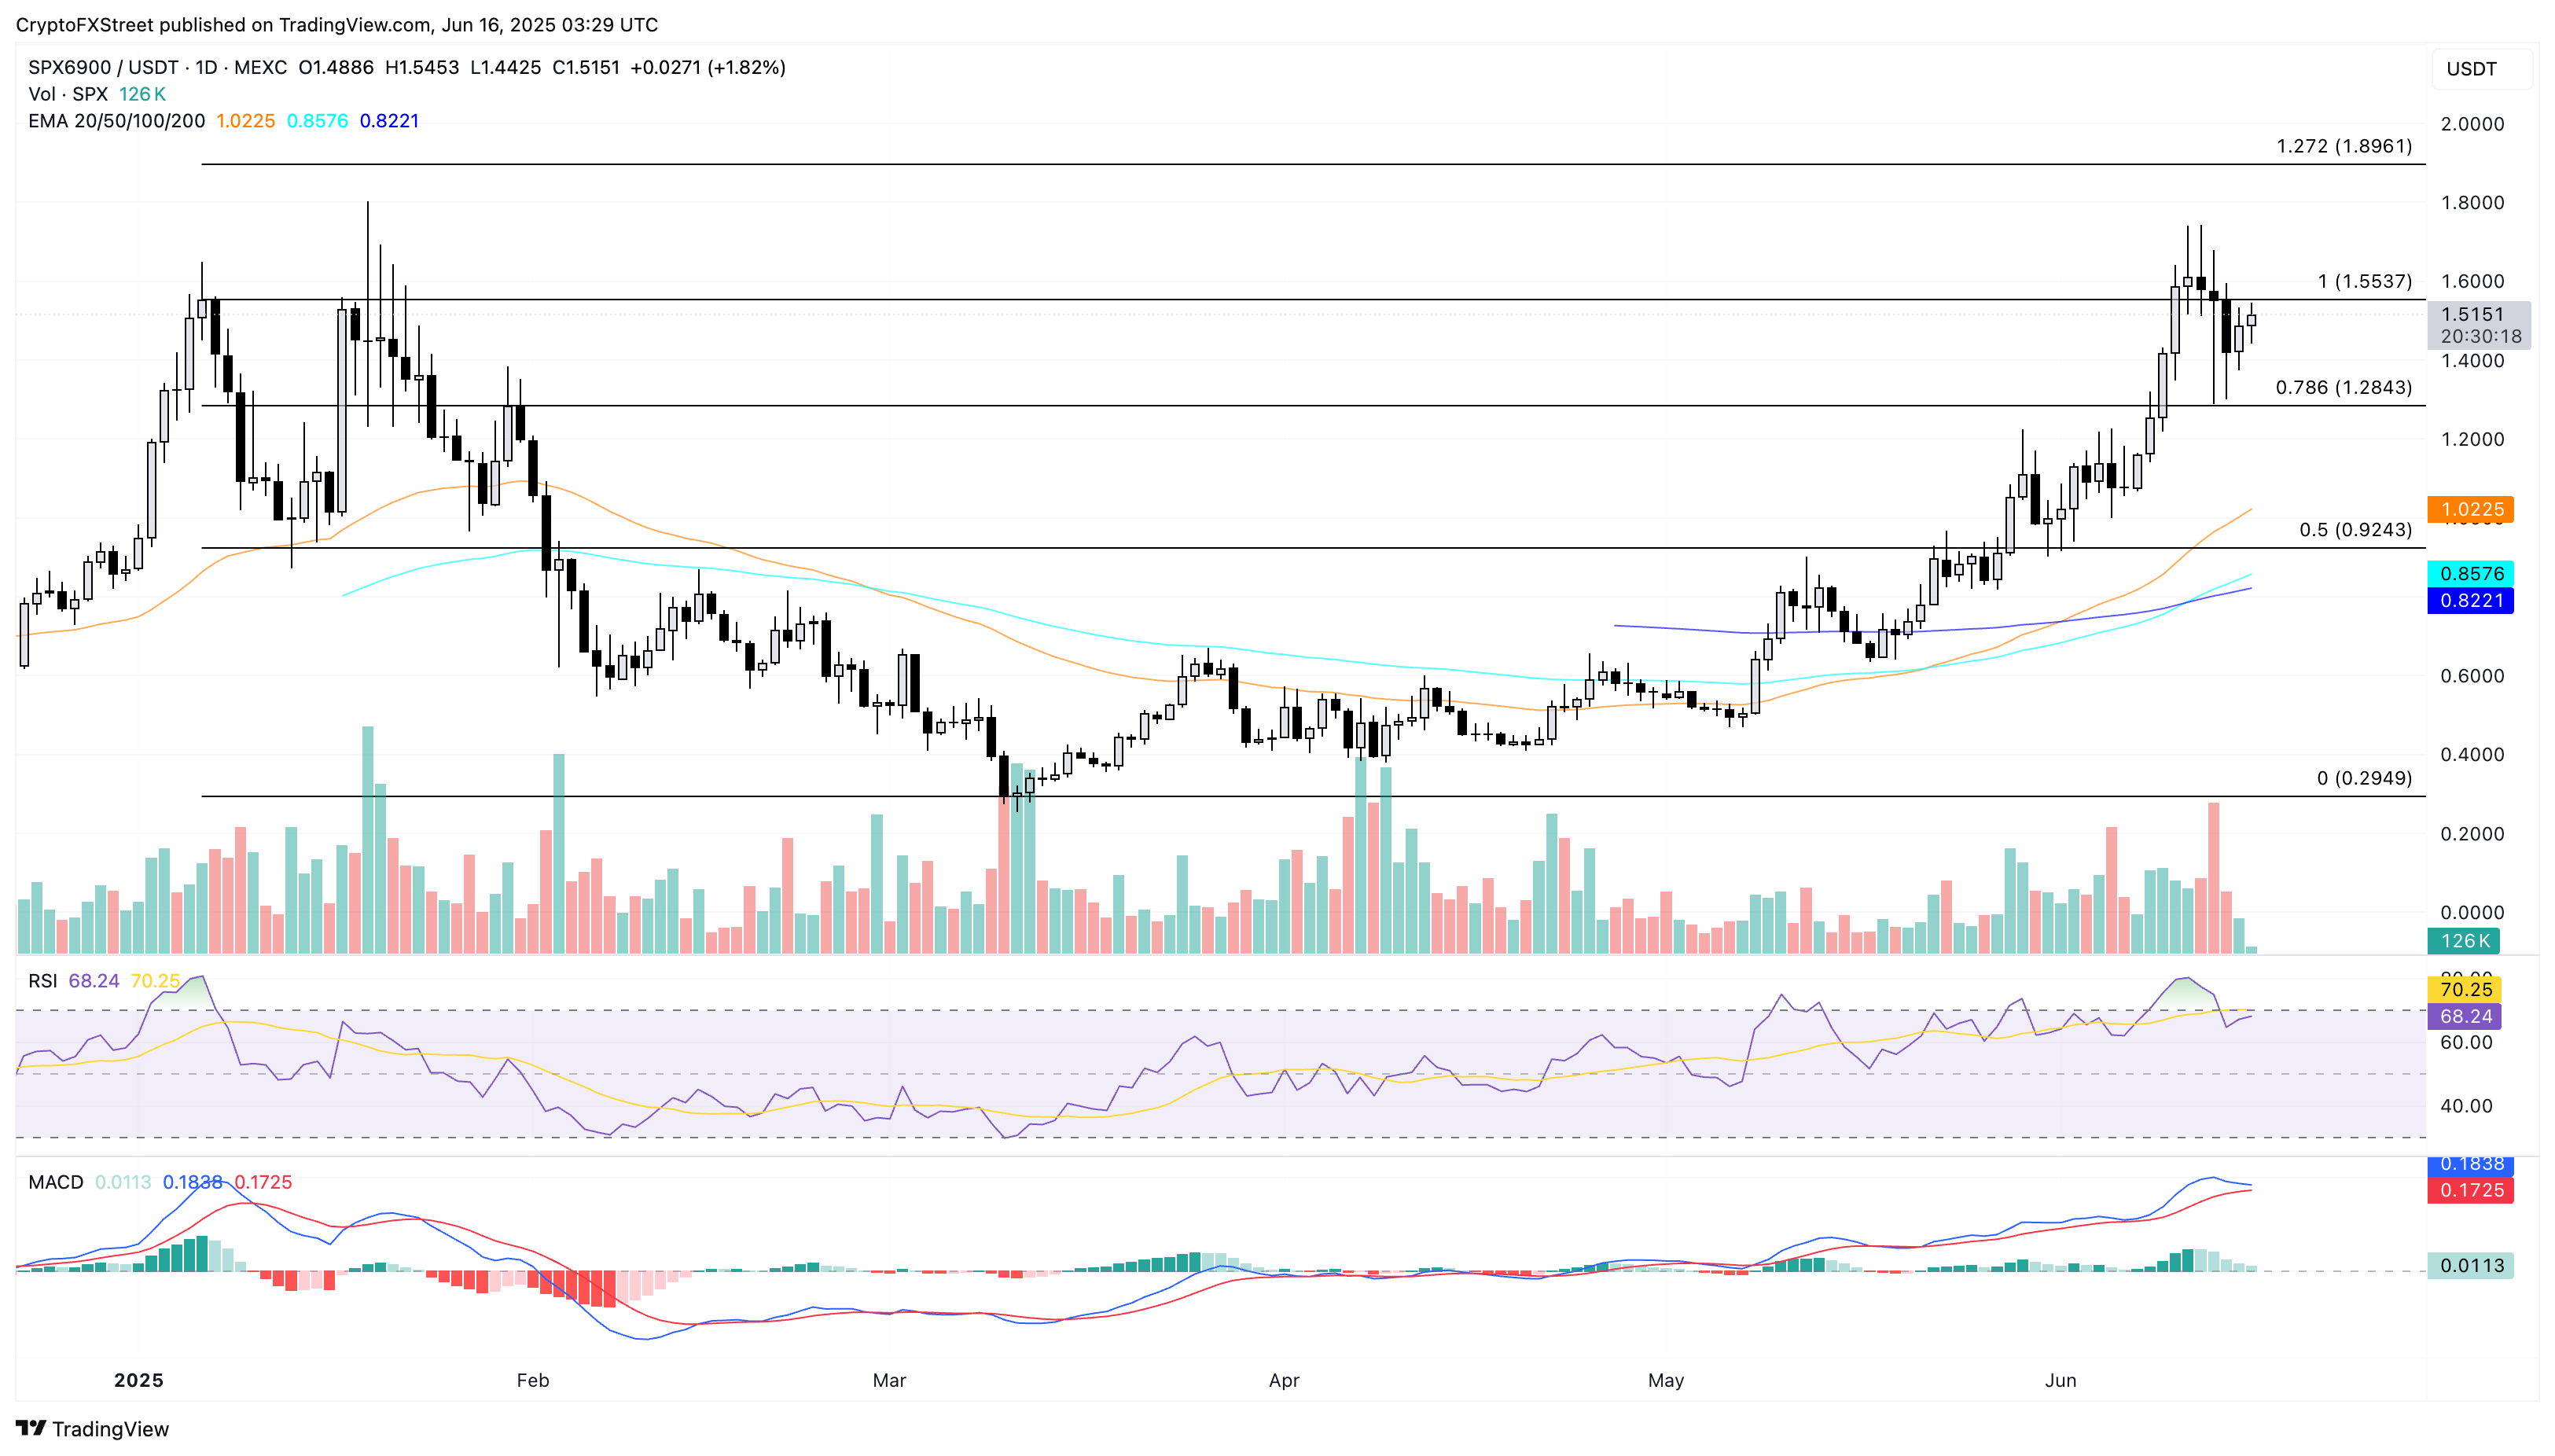
SPX/USDT daily price chart.
If SPX meme coin fails to overcome the $1.55 resistance or close above $1.61, a potential reversal could retest the $1.28 support floor. Sellers on the lookout could find a closing below $1.28 testing the 50-day Exponential Moving Average at $1.02 as an opportunity.
Recommended Articles


