

Bitcoin Price Breakout Confirmed — Eyes on Next Key Level

Source Newsbtc

Bitcoin price is rising again above the $95,000 zone. BTC is gaining pace and might aim for a move above the $97,500 resistance zone.

  • Bitcoin remained supported above the $94,500 zone.
  • The price is trading above $95,000 and the 100 hourly Simple moving average.
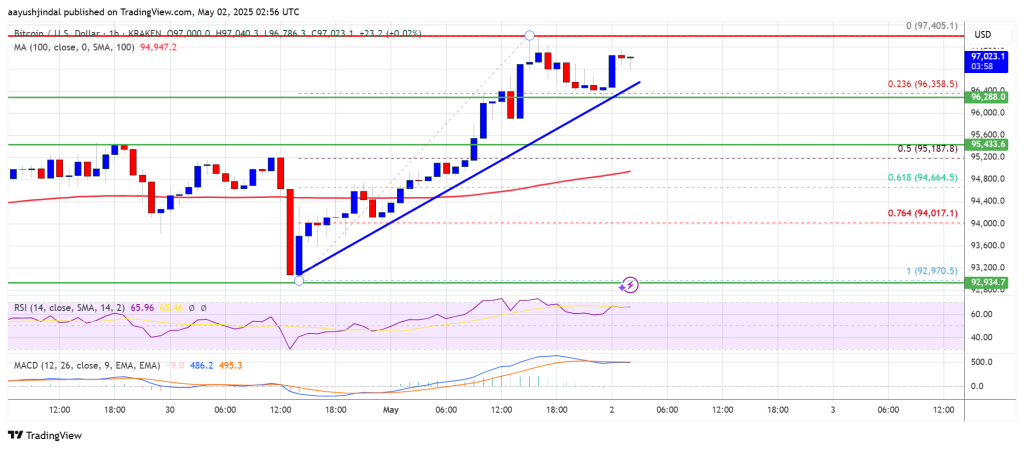
  • There is a connecting bullish trend line forming with support at $96,350 on the hourly chart of the BTC/USD pair (data feed from Kraken).
  • The pair could start another increase if it clears the $97,500 zone.

Bitcoin Price Regains Momentum

Bitcoin price formed a base above the $93,500 level. BTC started a fresh increase and was able to clear the $95,500 resistance zone to set the pace for a larger increase.

The bulls even pushed the price above the $96,500 resistance. A high was formed at $97,405 and the price is now consolidating gains. There was a minor decline below the $97,000 level and the price tested the 23.6% Fib retracement level of the upward move from the $92,970 swing low to the $97,405 high.

Bitcoin price is now trading above $95,000 and the 100 hourly Simple moving average. There is also a connecting bullish trend line forming with support at $96,350 on the hourly chart of the BTC/USD pair.
Bitcoin Price

On the upside, immediate resistance is near the $97,200 level. The first key resistance is near the $97,400 level. The next key resistance could be $97,500. A close above the $97,500 resistance might send the price further higher. In the stated case, the price could rise and test the $98,800 resistance level. Any more gains might send the price toward the $100,000 level.

Another Decline In BTC?

If Bitcoin fails to rise above the $97,500 resistance zone, it could start another downside correction. Immediate support on the downside is near the $96,500 level and the trend line. The first major support is near the $96,000 level.

The next support is now near the $95,200 zone and the 50% Fib retracement level of the upward move from the $92,970 swing low to the $97,405 high. Any more losses might send the price toward the $94,500 support in the near term. The main support sits at $94,200.

Technical indicators:

Hourly MACD – The MACD is now gaining pace in the bullish zone.

Hourly RSI (Relative Strength Index) – The RSI for BTC/USD is now above the 50 level.

Major Support Levels – $96,500, followed by $95,500.

Major Resistance Levels – $97,500 and $98,000.

Disclaimer: For information purposes only. Past performance is not indicative of future results.
placeholder
Markets in 2026: Will gold, Bitcoin, and the U.S. dollar make history again? — These are how leading institutions thinkAfter a turbulent 2025, what lies ahead for commodities, forex, and cryptocurrency markets in 2026?
Author  Insights
Dec 25, 2025
After a turbulent 2025, what lies ahead for commodities, forex, and cryptocurrency markets in 2026?
placeholder
ECB Policy Outlook for 2026: What It Could Mean for the Euro’s Next MoveWith the ECB likely holding rates steady at 2.15% and the Fed potentially extending cuts into 2026, EUR/USD may test 1.20 if Eurozone growth proves resilient, but weaker growth and an ECB pivot could pull the pair back toward 1.13 and potentially 1.10.
Author  Mitrade
Dec 26, 2025
With the ECB likely holding rates steady at 2.15% and the Fed potentially extending cuts into 2026, EUR/USD may test 1.20 if Eurozone growth proves resilient, but weaker growth and an ECB pivot could pull the pair back toward 1.13 and potentially 1.10.
placeholder
Finding The Best Japan Stocks to Buy? These are Top Japanese Companies to Watch Discover the best Japanese stocks to buy, including AI semiconductor leaders, Buffett-backed trading houses, and undervalued Japan stocks benefiting from corporate reforms and yen trends.
Author  Mitrade
May 29, Fri
Discover the best Japanese stocks to buy, including AI semiconductor leaders, Buffett-backed trading houses, and undervalued Japan stocks benefiting from corporate reforms and yen trends.
placeholder
Gold Price Forecast: Oil Price Breaking $100 Fuels Inflation Concerns, Will Gold Prices Fall Further?As of the Asian session on July 24, gold prices ( XAUUSD) fell continuously during intraday trading, briefly approaching the $4,000 mark. Looking at the chart, gold prices rebounded this
Author  TradingKey
Jul 24, Fri
As of the Asian session on July 24, gold prices ( XAUUSD) fell continuously during intraday trading, briefly approaching the $4,000 mark. Looking at the chart, gold prices rebounded this
placeholder
Gold declines despite easing concerns over inflation, interest rate hikesGold price (XAU/USD) loses ground after registering gains in the previous day, trading around $4,050 per troy ounce during the Asian hours on Tuesday.
Author  FXStreet
11 hours ago
Gold price (XAU/USD) loses ground after registering gains in the previous day, trading around $4,050 per troy ounce during the Asian hours on Tuesday.
goTop
quote