


Bitcoin Short-Term Holders Back In Green As Price Breaks $94,000
On-chain data shows the Bitcoin price has reclaimed the cost basis of the short-term holders, a level that has historically been psychologically important.
Bitcoin Is Now Back Above The Short-Term Holder Realized Price
In a new post on X, the on-chain analytics firm Glassnode has discussed the Realized Price of the Bitcoin short-term holders. The “Realized Price” here refers to an indicator that keeps track of the cost basis or acquisition level of the average investor in the BTC sector.
When the spot price of the cryptocurrency is trading above this metric, it means the holders as a whole are sitting on a net unrealized profit. On the other hand, it being under the indicator suggests the dominance of loss in the market.
In the context of the current topic, the Realized Price of only a specific part of the sector is of interest: the short-term holders (STHs). The STHs are made up of the BTC investors who purchased their coins within the past 155 days.
This cohort represents one of the two broad divisions of the userbase done on the basis of holding time, with the other group being known as the long-term holders (LTHs).
Statistically, the longer an investor holds onto their coins, the less likely they are to sell them at any point. As such, the LTHs include the resolute hands, while the STHs include the weak ones.
Now, here is a chart that shows how the Realized Price of the Bitcoin STHs has changed during the last few months:
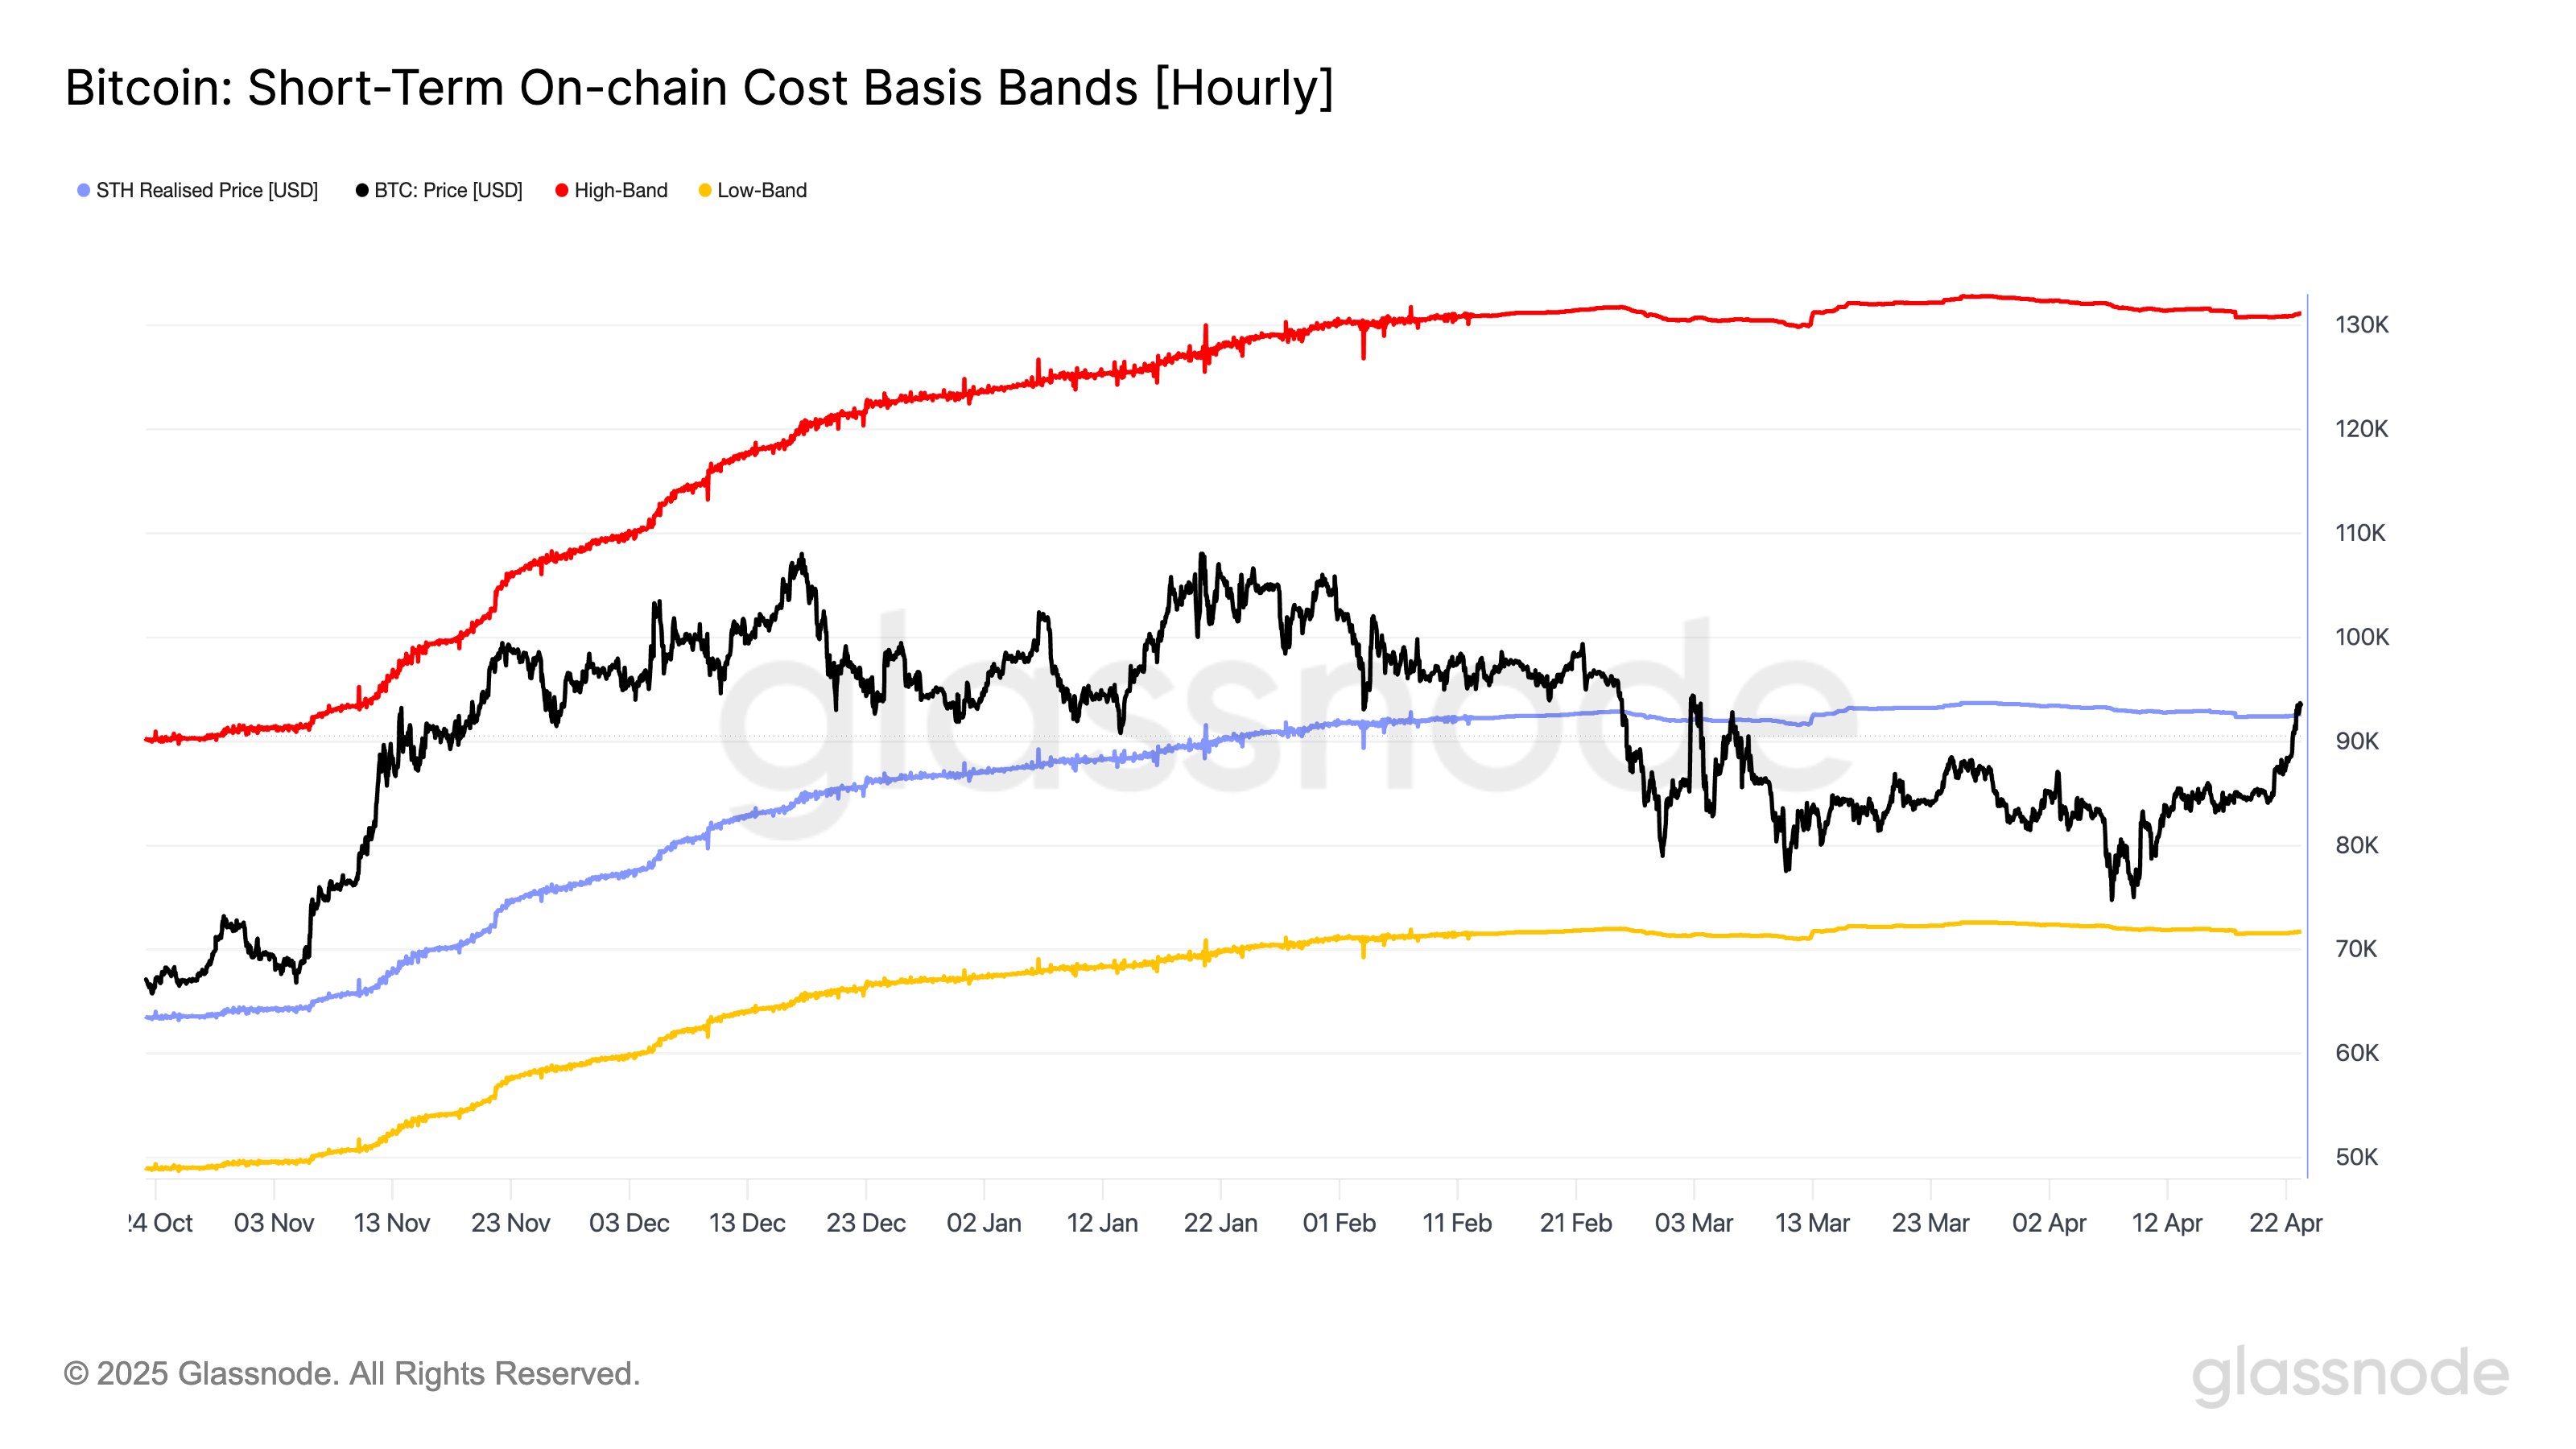
As displayed in the above graph, the Bitcoin spot price fell below the STH Realized Price earlier in the year, suggesting these investors dipped into a state of net loss.
As mentioned earlier, the STHs include the fickle hands of the market. These investors often panic whenever retests related to their cost basis occur, so the cryptocurrency can feel some kind of reaction when it touches the STH Realized Price.
When this retest occurs from below (that is, when the STHs were in the red prior to the retest), the cohort might react by selling, if the sentiment among them is bearish. This panic exiting at the break-even can provide resistance to the asset. From the chart, it’s visible that Bitcoin witnessed this effect back in early March.
After staying under the line for a couple of months, though, it appears the asset has finally managed to break above the resistance with the latest price rally. If the asset now goes on to see a sustained move in this profit region, it could be a signal that confidence is back among the STHs.
Historically, these holders being bullish has meant that their cost basis has turned into a notable support level for the cryptocurrency.
BTC Price
Following a surge of almost 6% in the last 24 hours, Bitcoin has returned to the $93,600 mark.
Recommended Articles


