

Meme Coins Price Prediction: DOGE, SHIB and PEPE struggle to stabilize as sellers keep control

- Silver Price Forecast: Trump Signals Rapid Progress in US-Iran Negotiations, Bulls Target $90
- Forex Today: Yet to be confirmed US-Iran MOU caps US Dollar's upside
- Gold declines below $4,500 as Iran tensions stoke inflation fears and bolster Fed hike bets
- Fed’s Powell says credibility lost if President can fire officials
- $1.5 Billion in Crypto Assets Liquidated, Bitcoin Falls Below $66,000 Mark. What Is the Reason?
- Bitcoin Suffers Year’s Strongest Waterfall-Style Decline. Will It Next Drop to the $60,000 Mark?

Dogecoin is holding just above $0.1300 after seven straight daily declines, with momentum starting to tilt bearish.
Shiba Inu is clinging to the 50-day EMA at $0.00000834, but fading buying pressure leaves the uptrend attempt vulnerable.
Pepe remains above $0.00000500, yet a MACD sell signal keeps the focus on a potential slide toward the 50-day EMA.
Meme coins remain under heavy selling pressure
Meme tokens — including Dogecoin (DOGE), Shiba Inu (SHIB) and Pepe (PEPE) — are still stuck in a tough stretch of selling, logging roughly seven consecutive down days after the January 4 spike. With buying interest cooling and no obvious near-term catalyst across the broader crypto market, the group risks a shift in momentum that could leave prices exposed to another leg lower.
Dogecoin stabilizes near $0.1332, but momentum weakens
Dogecoin was trading around $0.1350 at press time on Tuesday after seven straight sessions of declines and a break below the 50-day Exponential Moving Average (EMA) at $0.1427. Price is now hovering close to the November 21 low at $0.1332 — a level that acted as resistance in mid-December and has since flipped into support.
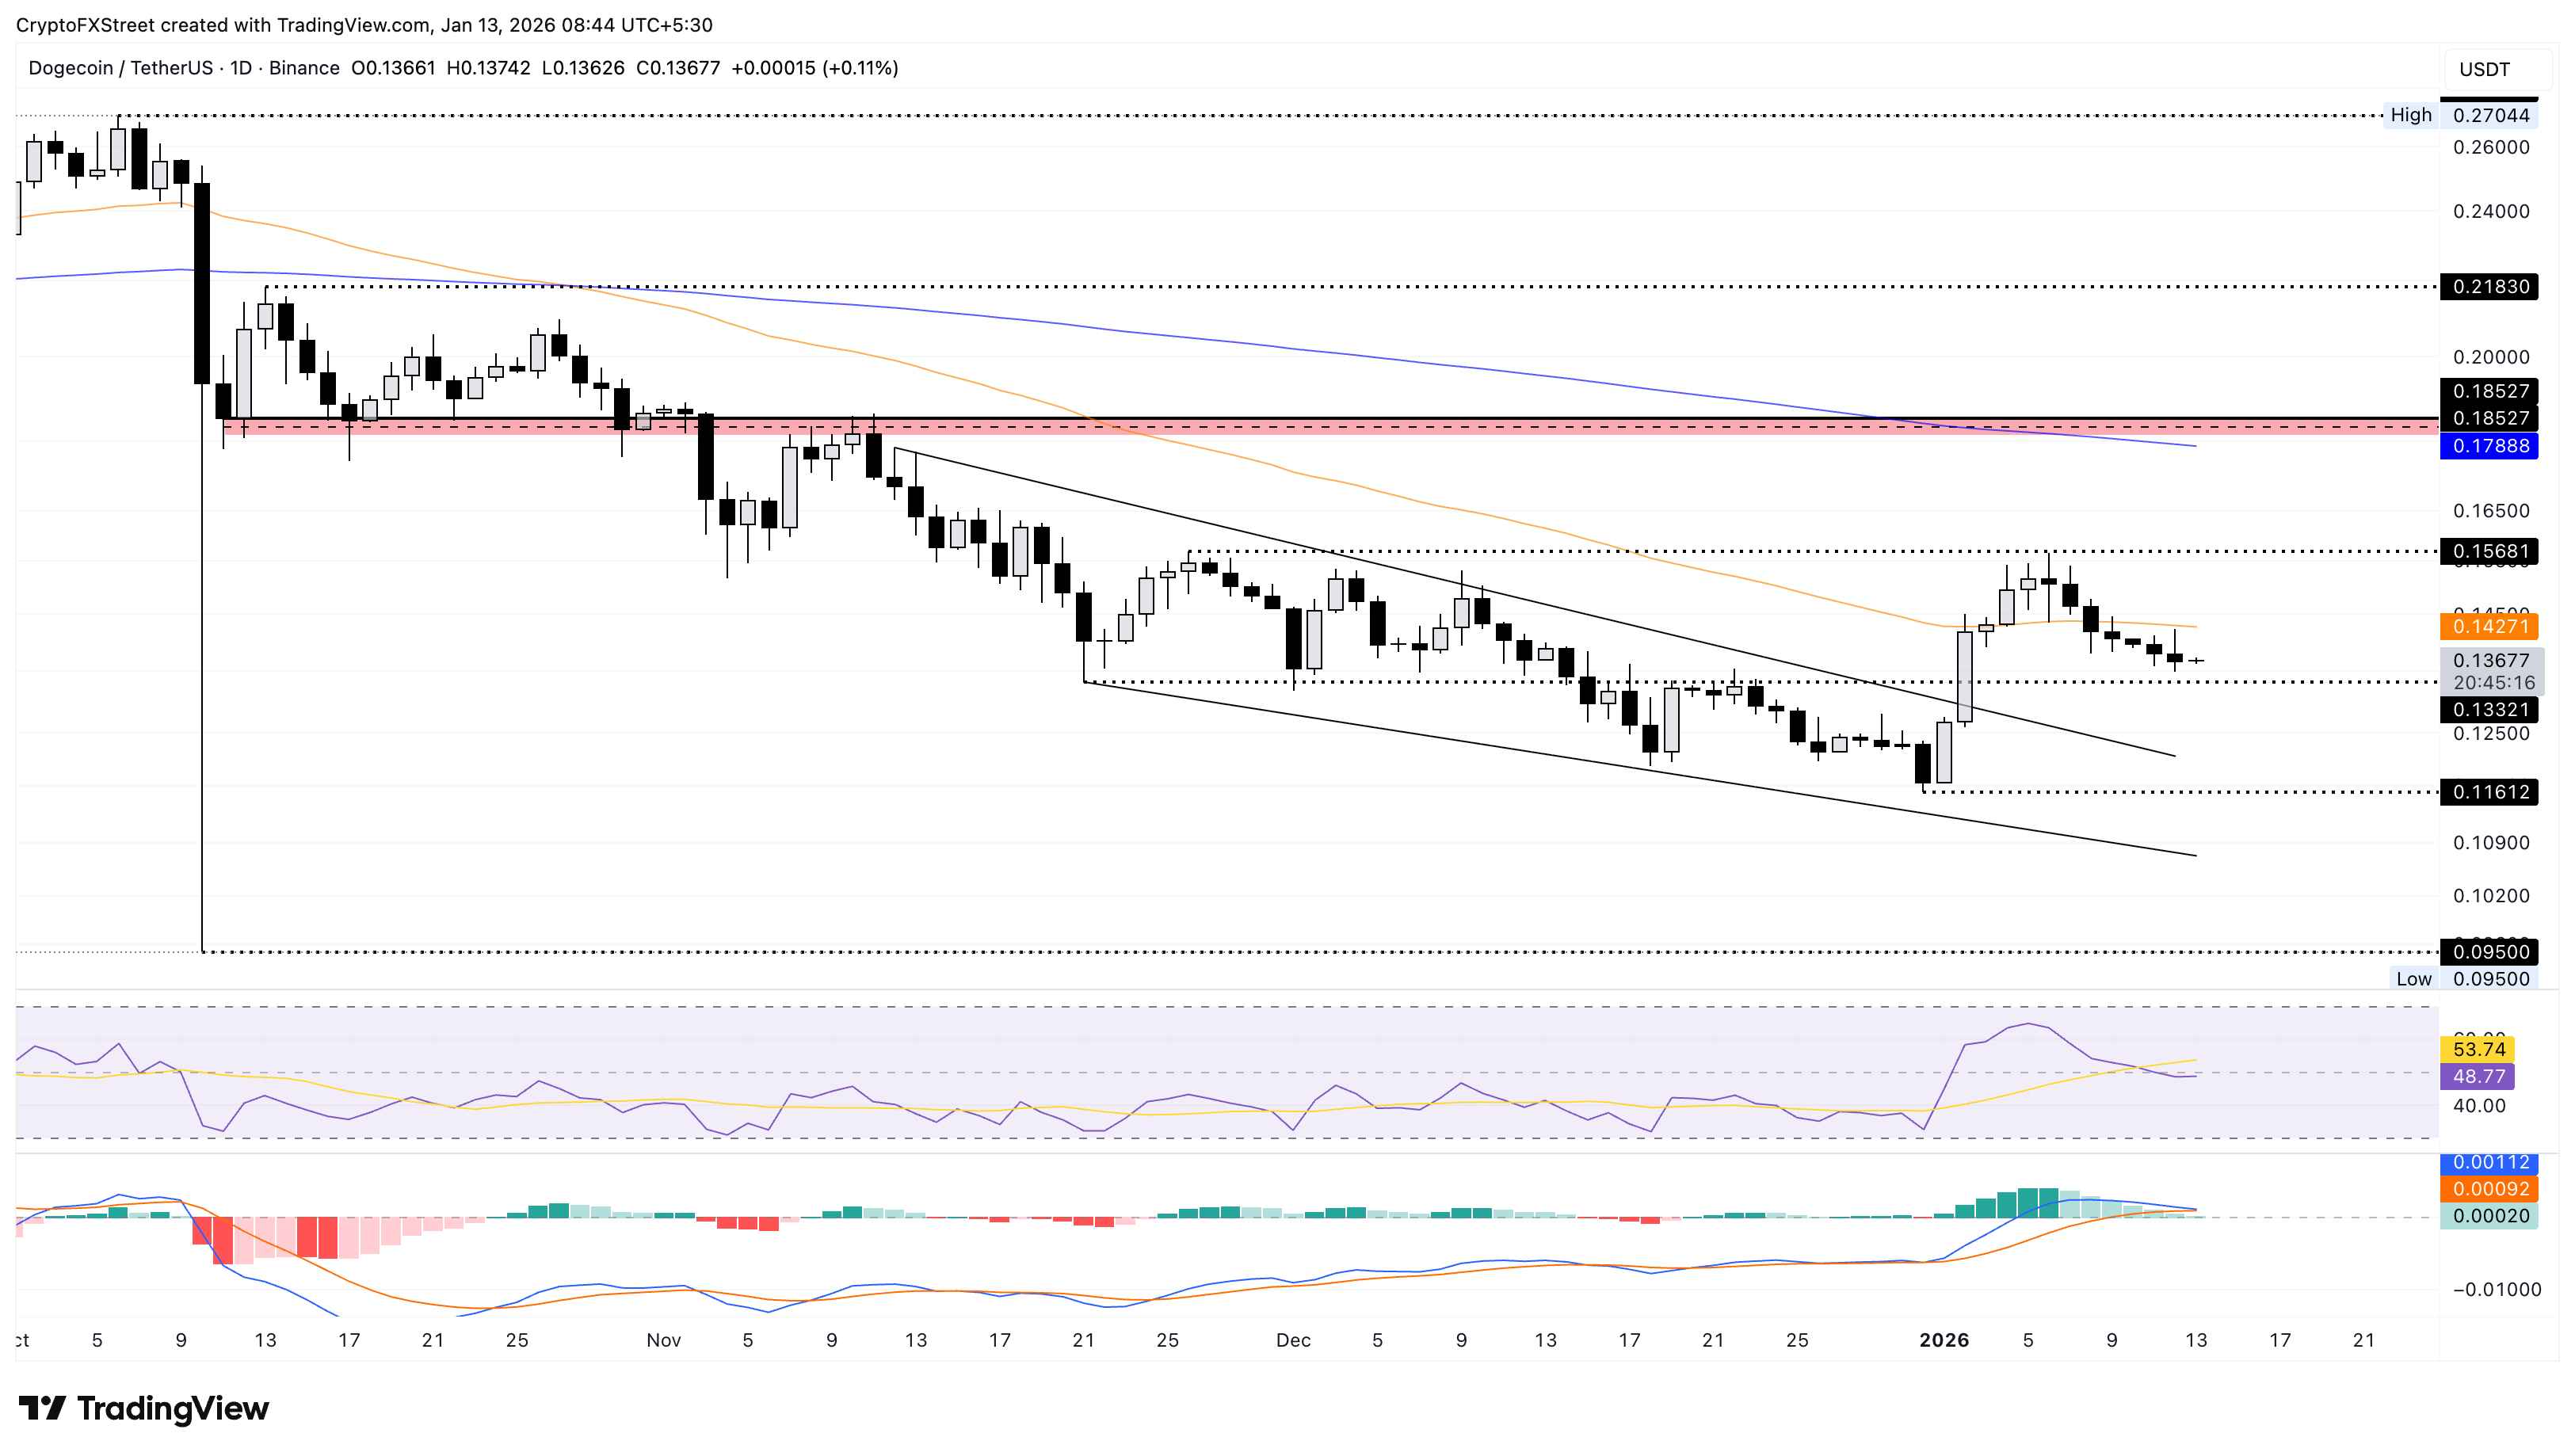
If DOGE can defend $0.1332, a rebound could bring the 50-day EMA at $0.1427 back into view, followed by the November 26 high at $0.1568, which capped gains on January 6.
Momentum indicators, however, point to a sharp loss of buying strength. The daily Relative Strength Index (RSI) has slipped to 48, moving below the midpoint and hinting that sellers are gaining the upper hand. Meanwhile, the Moving Average Convergence Divergence (MACD) is turning back toward its signal line, raising the risk of a bearish crossover that would reinforce downside momentum.
A daily move below $0.1332 would shift attention to the December 31 low at $0.1161 as the next support.
Shiba Inu holds the 50-day EMA as buyers turn cautious
Shiba Inu is hovering just above the 50-day EMA at $0.00000834, showing signs of stabilization after a seven-day slide. At the time of writing on Tuesday, SHIB was attempting a modest recovery after nearly revisiting the breakout zone from a falling channel pattern.
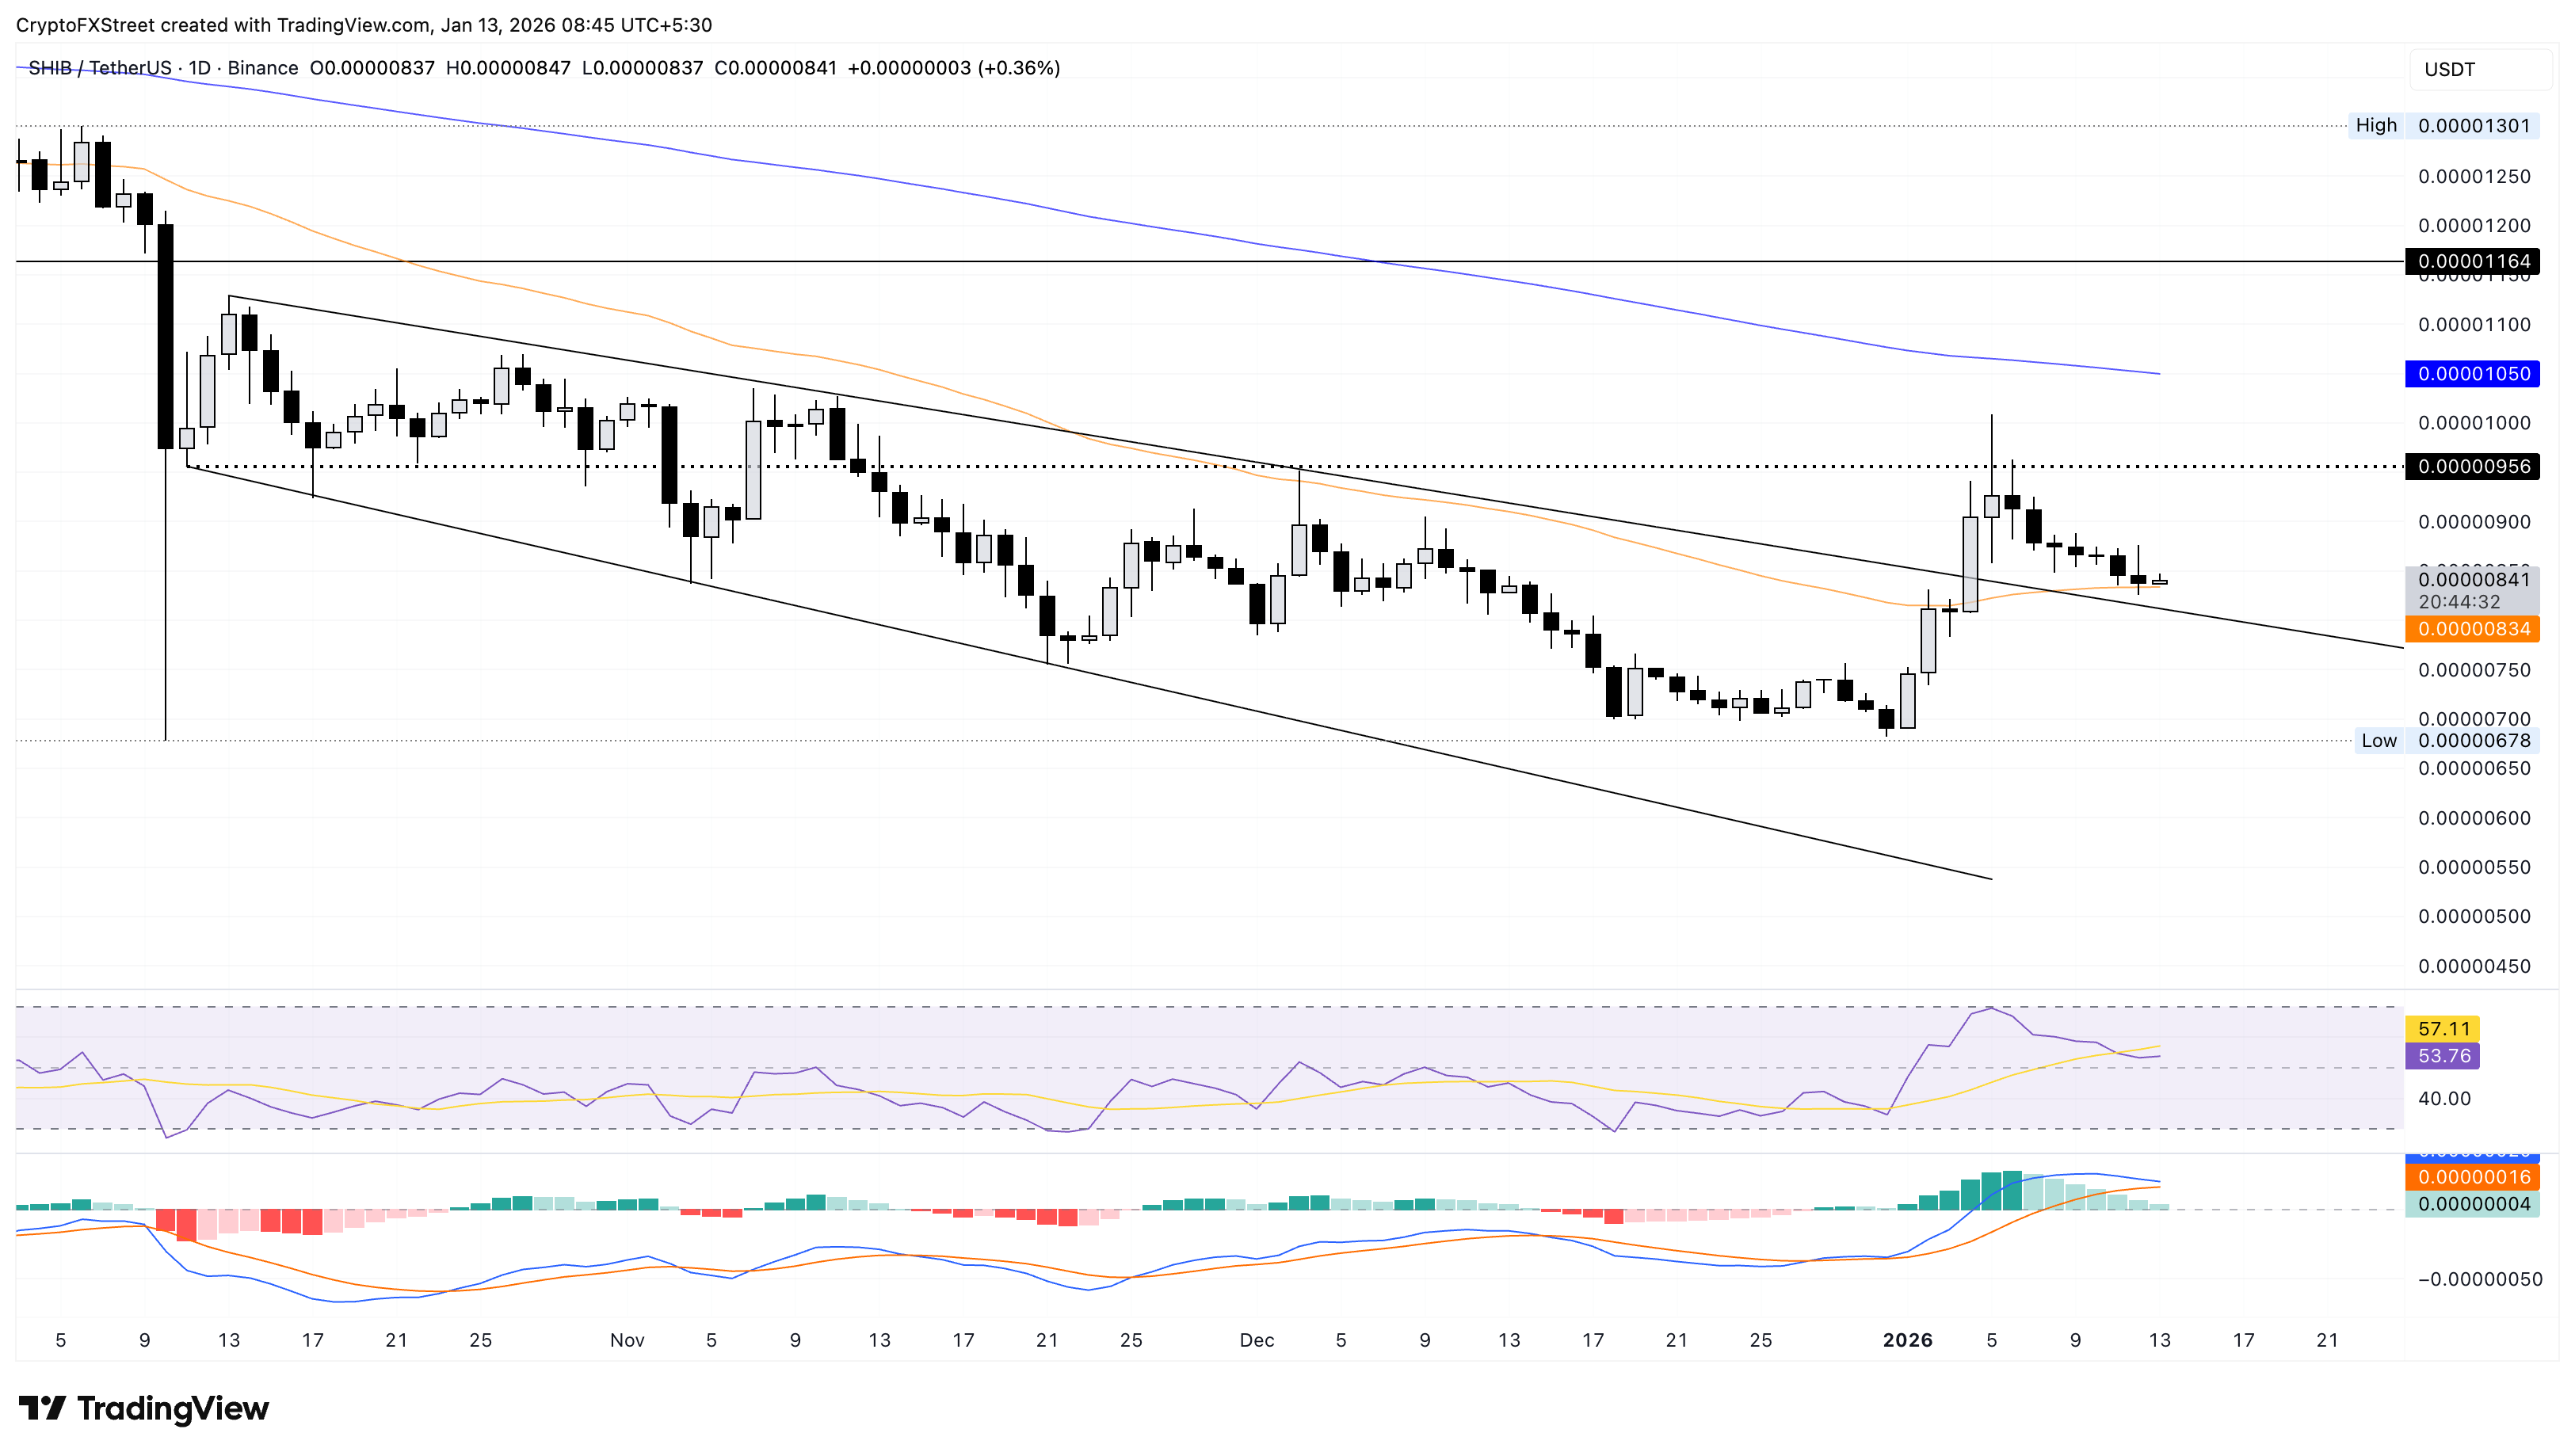
If the 50-day EMA continues to hold, SHIB could attempt a move toward the October 11 low at $0.0000956.
Still, the momentum backdrop is starting to look less supportive. SHIB’s RSI is at 53 on the daily chart and drifting down toward the midpoint from overbought territory, a signal that buying pressure is easing. The MACD is also declining and risks slipping below the signal line — a move that would generate a sell indication.
If SHIB fails to hold above the 50-day EMA at $0.00000834, the next downside level to watch would be the October 10 low at $0.00000678.
Pepe keeps $0.00000500 in play, but MACD sell signal pressures price
Pepe was trading above the $0.00000500 psychological level at press time on Tuesday after giving back the gains from January 3 and 4 during the seven-day downtrend. The MACD has crossed below its signal line, flashing a sell signal and pointing to renewed bearish momentum.
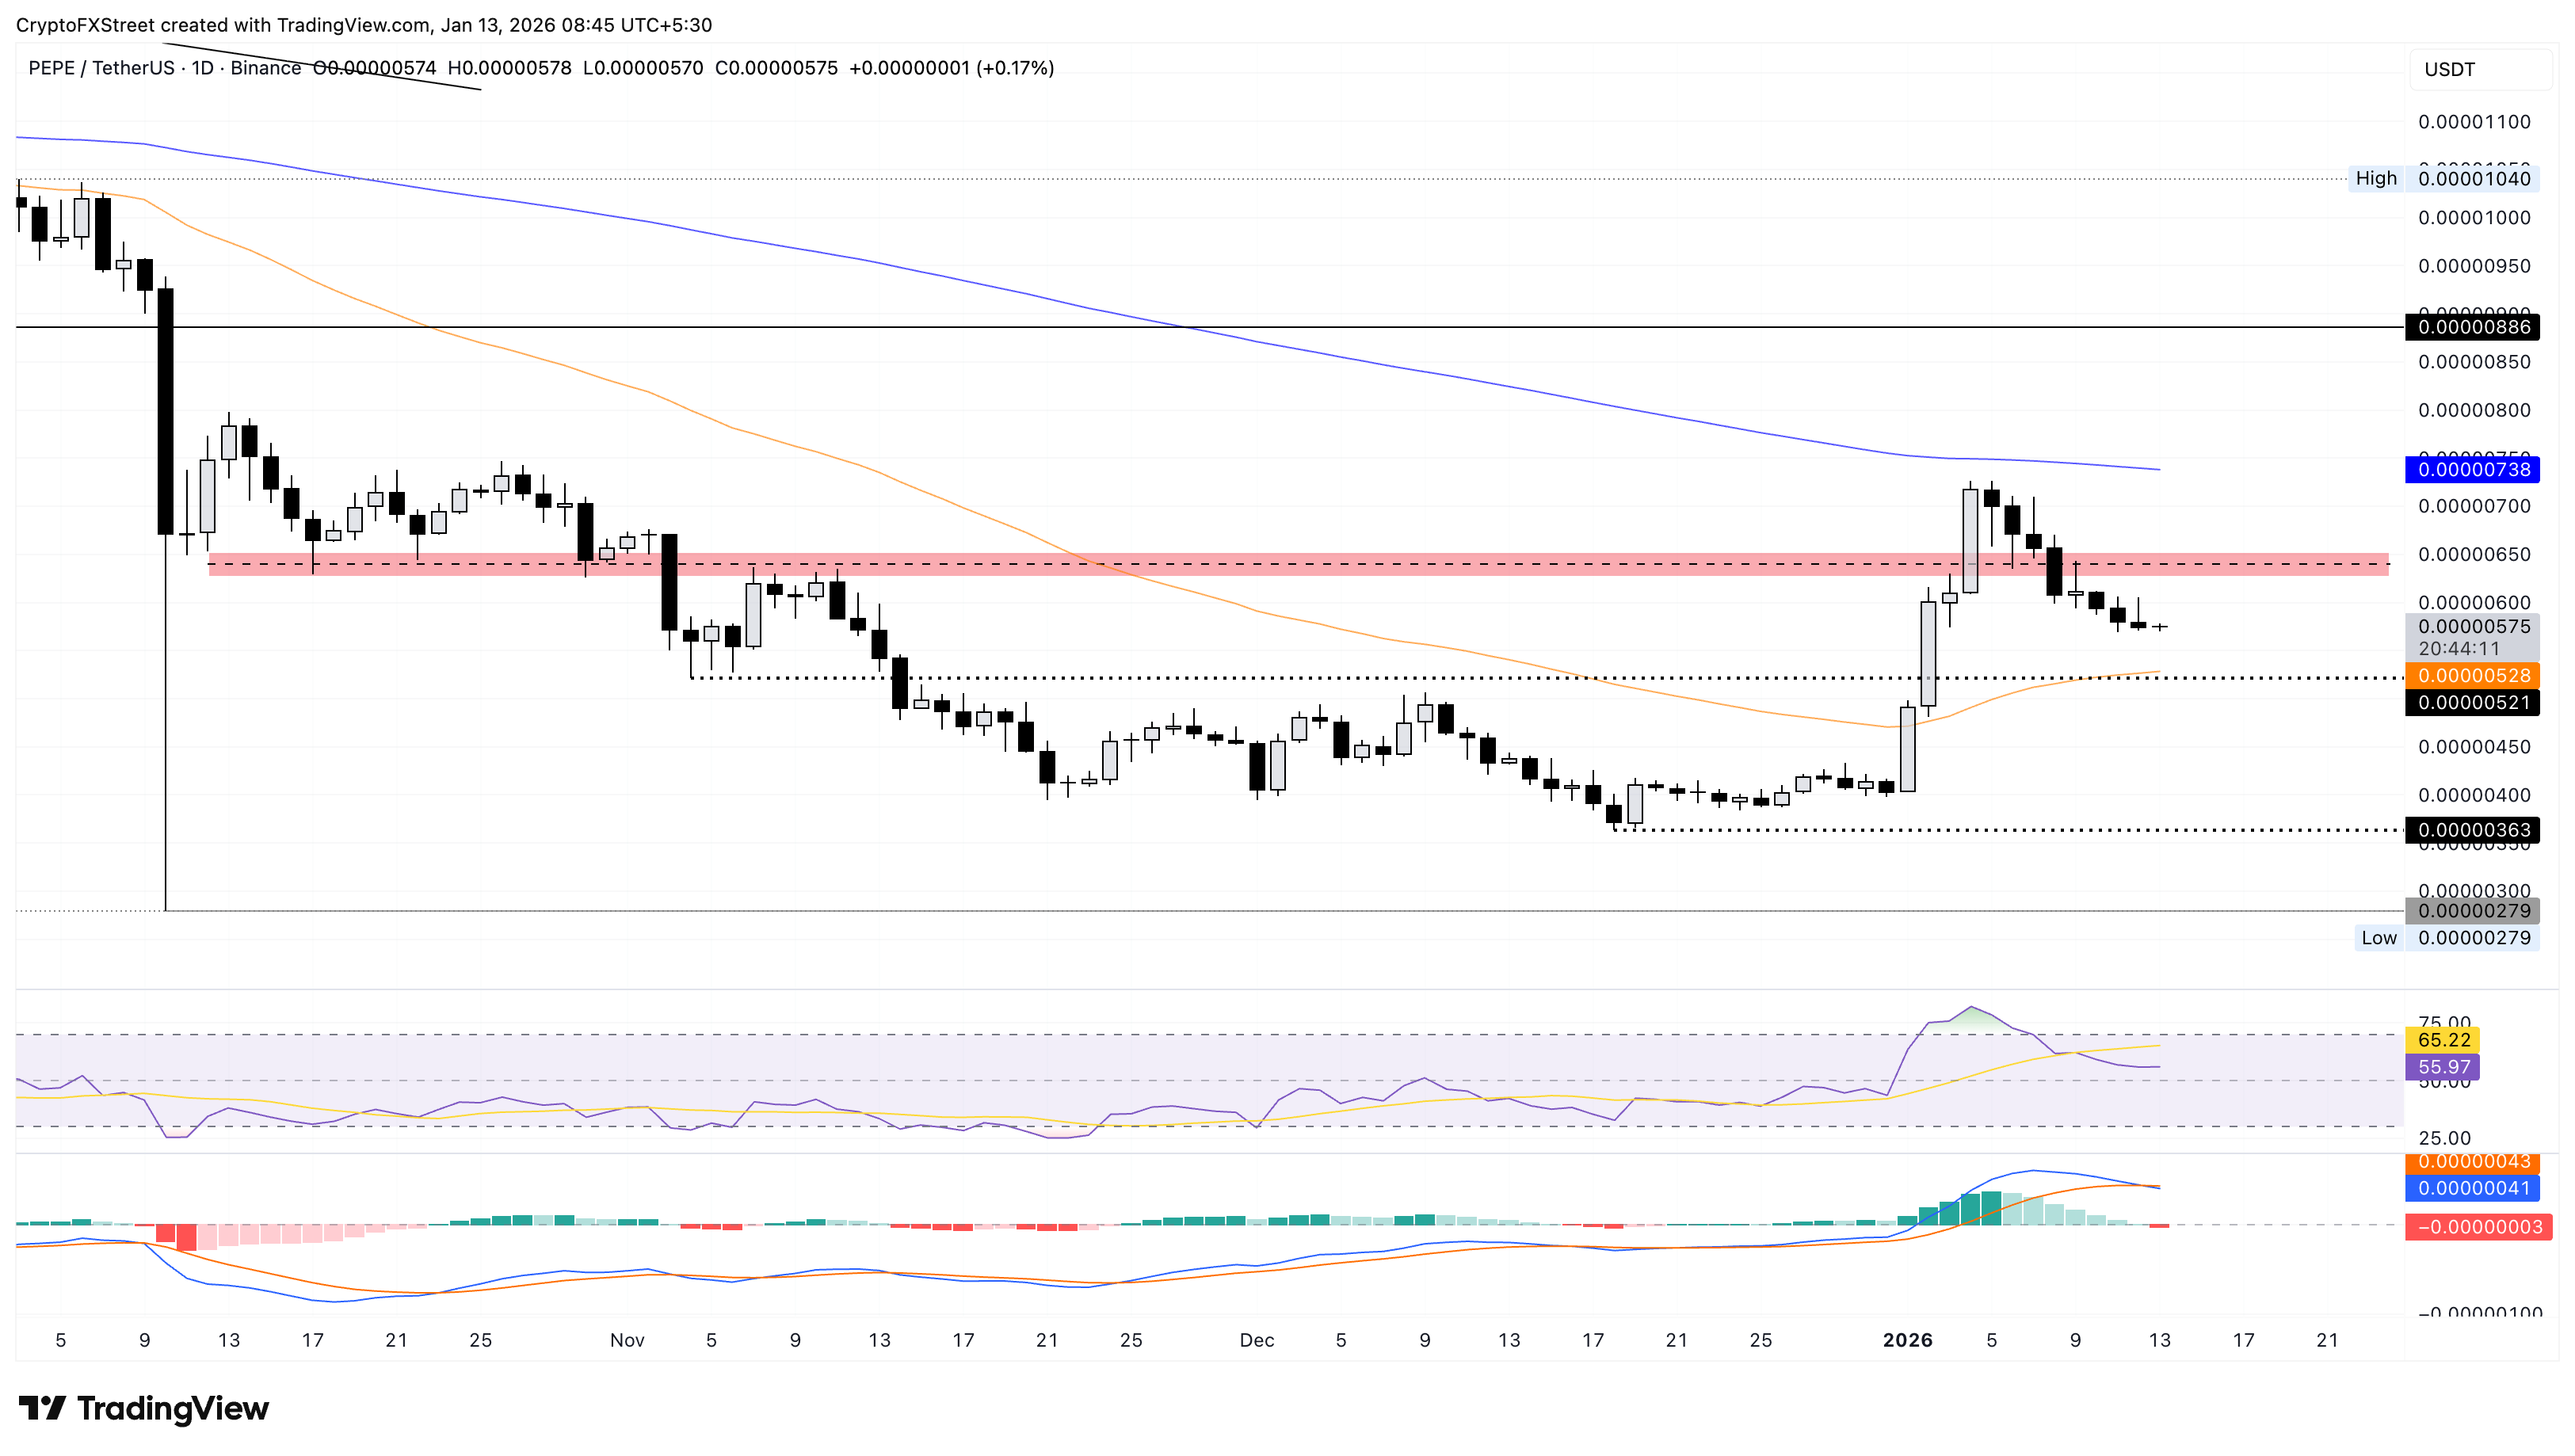
The RSI is at 55, but it has dropped sharply from overbought readings, suggesting bullish pressure is fading rather than strengthening.
With momentum softening, PEPE’s next support focus sits at the 50-day EMA at $0.00000528.
On the upside, a broader rebound in DOGE and SHIB could help PEPE attempt a recovery, with resistance seen at the $0.00000650 supply zone, followed by the 200-day EMA at $0.00000738.
Read more
The above content was completed with the assistance of AI and has been reviewed by an editor.


