

Gold-Silver Ratio Explained: How to Trade Gold and Silver Profitably
Gold and silver have moved in tandem for centuries, but their relationship holds a secret most traders miss. The gold-silver ratio (also known as the mint ratio) quietly reveals when one metal is “cheap” compared to the other. In wild markets, this simple number spotlight hidden opportunities that professional gold and silver investors exploit.
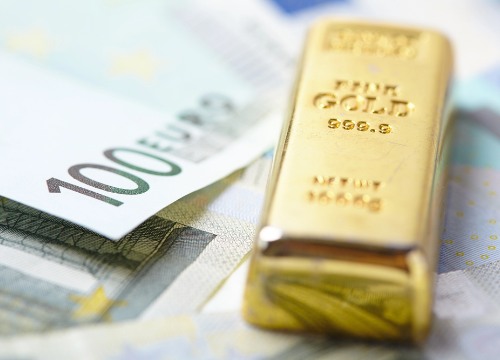
For you trading spot CFDs, it’s a way to play precious metals smarter, without guessing absolute direction. No storage, just leverage and 24/5 access on ASIC brokers. But turning the ratio into wins takes more than watching a line on a chart; it demands understanding extremes and patience.
Let’s uncover why this ancient indicator still beats modern hype.
Key takeaways
The gold-silver ratio (GSR) signals when one metal is cheap compared to the other
Extremes above 85 or below 65 often precede mean-reversion opportunities
Ratio trading is market-neutral as you profit from the relationship correcting, not the absolute direction
What the gold-silver ratio really tells you
The GSR is the investors’ most ancient relative value indicator. Traders use the ratio to answer one important question: “How many ounces of silver does it take to buy one ounce of gold?”
You calculate it in real-time by dividing the current price of gold by the current price of silver. Let’s say gold is $4,425 and silver $75, the ratio is 59. Over decades, it has averaged 60–80, but it swings wildly based on what’s happening in the world.
As you can see in the chart below, the gold-silver ratio surged above 100 several times (2020 COVID peak and 2025), signalling silver undervaluation. It then reverted toward the historical 60–80 average as silver recovered and gold cooled with brief spikes above 85 in 2021–2023 and 2024.

Gold-Silver ratio across seasons (Source: goldprice)
So, why does this ratio matter to you? Gold and silver don’t move exactly the same way. Gold is the classic safe-haven as people rush to it during crises, inflation scares, or stock crashes. Silver is different. About half of its demand comes from industries like solar panels, electronics, and electric vehicles. When factories slow, silver lags, but surges as economies boom.
That mismatch creates extremes (or opportunity if you like), which investors exploit to gain an edge when trading the two precious metals. A high ratio (>80–90) means silver looks cheap compared to gold, often during fear or weak industrial demand. A low ratio (<60) means gold looks cheap, usually in optimistic, growth-driven markets.
As a trader, track XAU/USD vs XAG/USD on TradingView (free ratio indicator). Gold silver ratio when to buy? Metric spikes often align with RBA dovish signals; weaker AUD boosts gold more than silver.
Volatile market? Find your edge. Trade gold and silver CFDs at Mitrade.
Turn Volatility into Opportunity with commodity CFDs at Mitrade. 0 commission, low spreads. Enjoy limit and stop loss for every trade!
Get Started
Gold-silver ratio through market cycles
If gold silver ratio history repeats itself (which it does in trading), then the metric is one of the most reliable tools investors can use to determine the relative valuation of the two precious metals and allocate/hedge their portfolios efficiently. A quick reminder of how this ratio has behaved in the past:
Ancient civilizations like Rome fixed it around 12:1. In the U.S., the bimetallic standard held it near 15–16 until the late 1800s, when silver discoveries crashed it lower.
The 20th century saw wild swings:
1930s Great Depression: Peaked near 100 as deflation drove gold demand while silver stagnated.
1960s–1970s: Fell below 20 during silver’s industrial boom and Hunt brothers’ squeeze.
1991 Gulf War: Spiked to about 100 amid safe-haven buying for gold.
Modern extremes include:
2008 Financial Crisis: Climbed above 80 as gold outperformed amid economic fear.
2020 COVID Peak: Hit a record of above 110 (highest ever) when lockdowns crushed silver’s industrial demand (50% of use) while gold soared as the ultimate refuge.
2025 Mid-Year: Surpassed 100 again amid manufacturing slowdowns and tariff fears weakening silver, before reverting as recovery kicked in.
As you can see above, the relative value of gold and silver behaves uniquely (based on the economic cycles), providing investors with a powerful tool to apply in allocating holdings between the two precious metals.
The trade idea here is to switch between the two holdings when the ratio moves to either of the extremes, profiting even when the actual price of gold or silver rises or declines. Remember that it’s a relative-value play — less about guessing if precious metals go up or down, more about which one will outperform. Sound’s strange? Let us break it down:
Consider this scenario: You possess 1 ounce of gold, and the gold-silver ratio skyrockets to 100. This means your 1-ounce-gold can be exchanged for 100 ounces of silver. If the ratio goes to 50, you sell your 100 ounces of silver for 2 ounces of gold. Seen where value comes from?
The same relationship benefits investors looking to hedge positions by taking a long position in one metal and a short position in the other based on the extremes and expectations.
The step-by-step gold-silver trading strategy
The gold-silver ratio (GSR) strategy is all about spotting when one metal is “cheap” compared to the other and betting on the relationship to normalize. Here’s how to turn it into a clear, actionable system:
Step 1: Monitor the ratio
Open the weekly charts on TradingView or your preferred trading software, which filter out short-term noise and give you a better outlook of structural market imbalances. Add the gold-silver ratio indicator and track its movement against the long-term average (60-80). You can set alerts to get notified when it reaches extremes.
Step 2: Identify extremes – patience is your edge
Don’t trade when the ratio is in the middle; that’s noise. Define simple thresholds based on history. Example rule: Consider a trade only when the GSR on the weekly chart closes above 85 or below 65. These levels have reliably signaled mean-reversion opportunities in recent years.
Step 3: Confirm with price action and momentum
An extreme ratio alone isn’t enough. A high or low ratio can always get higher or lower, so don’t jump in the moment your level is hit. Wait for evidence that the trend is exhausted and reversing.
Apply a 14-period Relative Strength Index (RSI) to your GSR chart to look for divergence. If the GSR claims a new high (e.g., 90) but the RSI makes a lower high, it’s a bearish divergence—a warning that the uptrend is losing momentum. This is a prime confirmation for a “Sell Ratio” trade.
Check the example in the chart below. In early-mid 2025, the ratio pushes to a major peak around 100, but RSI only reaches about 69 after previously peaking near 76—classic bearish divergence. This warns of an uptrend losing momentum, increasing the probability of silver outperforming. The subsequent decline in the ratio validated the signal, favoring short-gold / long-silver positioning.

Analyze the underlying metals because the ratio often turns when one metal starts to outperform the other. For a potential “Sell Ratio” setup (high GSR), watch for silver to stop making lower lows while gold struggles. A key confirmation is silver breaking above a short-term downtrend line on its own price chart. For a potential “Buy Ratio” setup (low GSR), look for gold to show relative strength, such as holding a key support level while silver begins to weaken.
Step 4: Enter the trade
You are not trading gold or silver, but the relationship between them. This creates a hedge against a general market crash or rally. You have two options in this case:
Scenario A. When the GSR is high (>85), implement a sell ratio trade—go short on gold and long on silver.
Scenario B. When the GSR is low (e.g., 60), execute a buy ratio trade—go long on gold and short on silver.
Step 5: Position sizing and hedging
Size the two legs of your trade so that a general move in the precious metals sector doesn’t cause a large loss. How? Use a dollar-neutral hedge.
A simple method is to balance exposure by value. For instance, if gold is AUD 4,200/oz and silver AUD 48/oz (ratio approx. 87.5), sell 1 oz gold (AUD 4,200 exposure) and buy approx. 87.5 oz silver (same AUD value). A uniform move in metals cancels out; you only win on the relationship shift. Use CFD lots on brokers like Mitrade for easy pairing.
Step 6: Define exit rules
Set the take profit by basing your target on a return to a more normal ratio. For example, if you enter at 90, exit near (75-80). This captures a meaningful mean reversion move without being greedy.
Define your maximum acceptable loss to protect you if the ratio continues to a new extreme. You can decide to stop out and close the entire paired trade when the ratio moves against you by 10 points (e.g., from 90 to 100). For a “Sell Ratio,” the weak leg is your long silver position. Place a traditional stop-loss on your silver CFD, say 5% below entry. If hit, close both legs.
Risks and common mistakes to avoid
Even the best gold-silver ratio strategy carries risks for traders since nothing is foolproof. Correlations can break suddenly: silver might lag longer than expected during prolonged industrial slumps, or gold could weaken unexpectedly on risk-on sentiment. Not to mention volatility spikes, which may cause your entry/exit prices to slip in volatile markets, eating profits fast.
Apart from risks, you should avoid these common mistakes:
Refusing to exit a losing trade, hoping that the ratio will reverse because it’s an extreme, can cause big losses.
Over-leveraging (pushing ASIC’s 20:1 cap) amplifies wipeouts on wrong calls.
Chasing extremes without confirmation or skipping dollar-neutral sizing leaves you exposed to directional moves.
Trading advice: Risk only 1–2% per trade to survive drawdowns. Use hard stops and journal everything (entry reason, outcome, lessons, etc) to stay objective. Patience wins here, so wait for confluence, not every wiggle (usual trading rules apply here too)
Your gold-silver ratio edge in 2026
If you haven't considered the gold-silver ratio yet, you are missing out important cues that can help gain an edge in gold and silver trading. This ratio remains popular among successful professional investors today as it was during ancient times.
As a trader in 2026, the real win comes from reacting smartly, not trying to predict everything. If the ratio starts breaking down (silver gaining strength while gold slows), lean into mean-reversion trades (long silver, short gold to ride silver’s catch-up).
If it keeps climbing or hits new highs, stick with gold’s dominance – uncertainty is still ruling. Please don’t treat the ratio as a magic signal; use it as your framework to stay aligned with whatever regime the market is in.
Keep it simple: monitor on trading charts, confirm with price action, size trades conservatively on your ASIC broker like Mitrade, and let the relationship do the work. It’s a practical edge that fits our volatile world and your portfolio.
 Risk-Free Demo Account
 Trade gold and silver at Mitrade. 0 commission, low spreads. Enjoy limit and stop loss for every trade!
* The content presented above, whether from a third party or not, is considered as general advice only. This article should not be construed as containing investment advice, investment recommendations, an offer of or solicitation for any transactions in financial instruments.


