


Ethereum Fails To Break $2,100 Resistance – Growing Downside Risk?
Ethereum has lost its grip on the key $2,000 level, reigniting fears of a deeper correction as selling pressure returns to the market. Since March 19, ETH has managed to hold above $1,930, but recent weakness has pushed the price dangerously close to breaking below the $1,900 mark. The drop has added fuel to bearish speculation, with traders and analysts now questioning whether a larger pullback is underway.
The inability to hold above psychological support levels has weighed heavily on sentiment, especially as broader market volatility continues to grow. Top analyst Carl Runefelt shared his outlook on Ethereum’s current structure, noting that the asset has repeatedly failed to overcome resistance at $2,100 — a level that now acts as a firm ceiling for bullish momentum. According to Runefelt, this repeated rejection suggests Ethereum could be in serious trouble if buyers don’t step in soon.
With momentum fading and no clear catalyst in sight, Ethereum risks slipping further if $1,900 fails to hold. Traders are watching closely for signs of a reversal, but for now, the path of least resistance appears to be downward. ETH must regain lost levels quickly to avoid confirming a broader bearish trend.
Bulls Face Key Test As Resistance Weighs on Price Action
Ethereum is under pressure as the broader crypto market faces one of its most crucial tests in months. With macroeconomic uncertainty mounting and fears of a potential recession in the United States, risk assets across the board are struggling to gain traction — and Ethereum is no exception. The current market environment remains hostile, with inflation concerns, unstable monetary policy, and global trade tensions shaking investor confidence.
ETH’s price action has been particularly underwhelming. Despite widespread expectations that Ethereum would lead a strong rally in early 2025, the asset has failed to meet bullish projections. Instead of gaining ground, ETH has stalled and is now struggling to hold support levels amid growing selling pressure.
Runefelt’s bearish outlook suggests that Ethereum has repeatedly failed to break through the $2,100 resistance level. According to Runefelt, this resistance zone is critical — and Ethereum’s inability to overcome it could be a sign of deeper weakness ahead. He warns that if Bitcoin experiences a breakdown, Ethereum could follow and potentially retest the wick near $1,750, which marked a local low during a previous correction.
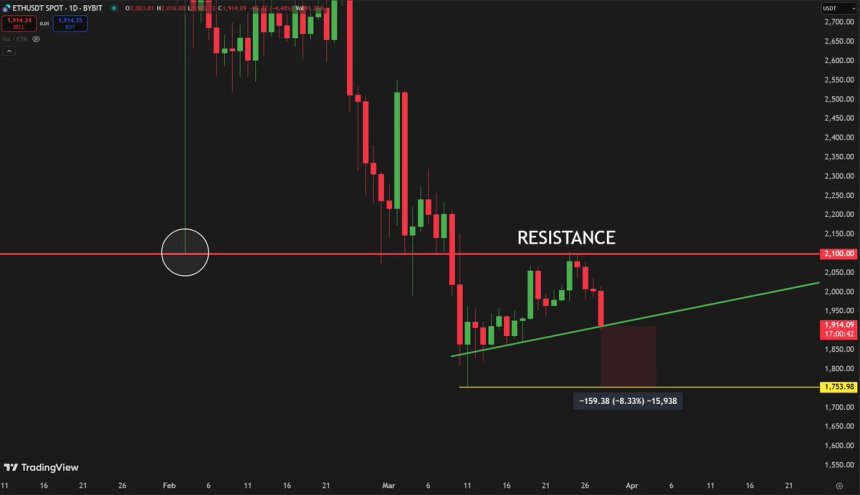
With momentum fading and no clear bullish catalyst in sight, Ethereum’s price structure remains fragile. Unless bulls reclaim key levels soon, ETH could face a deeper retrace, especially if broader market sentiment continues to deteriorate.
Traders are closely watching Bitcoin and macroeconomic developments for cues, knowing that a decisive move in either direction could shape Ethereum’s next major trend. For now, the pressure is on — and Ethereum’s resilience is about to be tested.
ETH Bulls Struggle to Hold Key Support
Ethereum (ETH) is currently trading at $1,910 after failing to hold above the critical $2,000 level, a psychological and technical barrier that has now flipped into resistance. The breakdown has weakened short-term momentum and left bulls in a defensive position as selling pressure continues to mount.
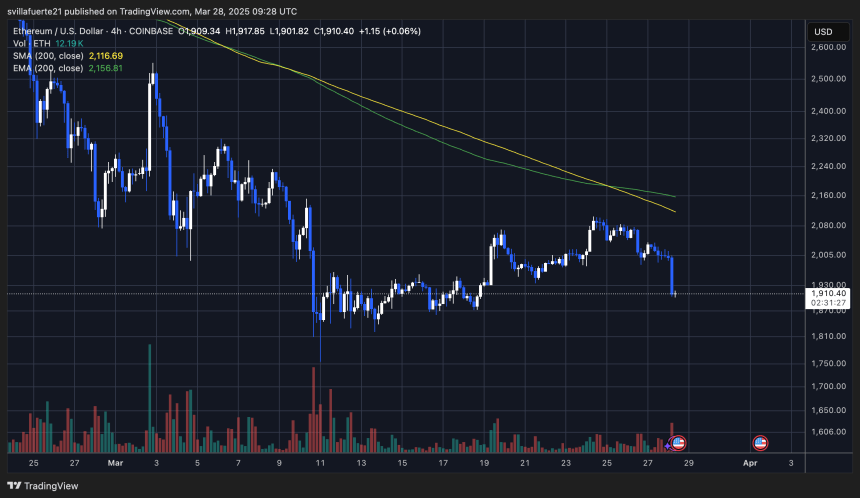
At this stage, the $1,880 level has emerged as a key support zone that bulls must defend to avoid a deeper correction. Holding this level could allow for a consolidation phase and give Ethereum a chance to stabilize before attempting another push higher. However, if ETH loses $1,880, it could spark a wave of aggressive selling, triggering a continuation of the current downtrend and potentially pushing the price toward the $1,750 range.
To regain control of the trend, bulls must reclaim the $2,000 mark as soon as possible. A decisive move back above this level would signal renewed strength and could open the door for a rebound toward higher resistance zones. Until then, Ethereum remains in a fragile position, with the risk of further downside growing as macroeconomic pressure and technical weakness continue to weigh on price action.
Featured image from Dall-E, chart from TradingView
Recommended Articles


