


Bitcoin Price Breaking Out Of This Pattern — Can BTC Reclaim $90,000?
The Bitcoin price has shown good signs of recovery over the past few days, briefly returning above the $85,000 level to kickstart the weekend. While BTC’s price has often floundered towards the end of the week in 2025, the premier cryptocurrency would be hoping to have a different journey over the next few days.
Is $90,000 The Next Stop For Bitcoin Price?
Fortunately, the future seems bright for the world’s largest cryptocurrency after crypto analyst Ali Martinez took to the X platform to share an exciting bullish prognosis for the Bitcoin price. According to the trader, the price of BTC could be on its way to the psychological $90,000 level.
The rationale behind this positive prediction is the appearance of an ascending triangle pattern on the 1-hour timeframe of the Bitcoin chart. The ascending triangle is a pattern in technical price analysis featuring an inverse right-angled triangle with a horizontal upper boundary (connecting a series of lower highs) and a diagonal rising lower trendline (connecting the swing lows).
An ascending triangle formation is usually considered a bullish chart pattern, indicating the continuation of the original upward trend. However, an ascending triangle formation can also serve as a trend reversal pattern and a bearish signal — when the asset’s price breaks down the lower trendline and in the opposite direction of the initial uptrend.
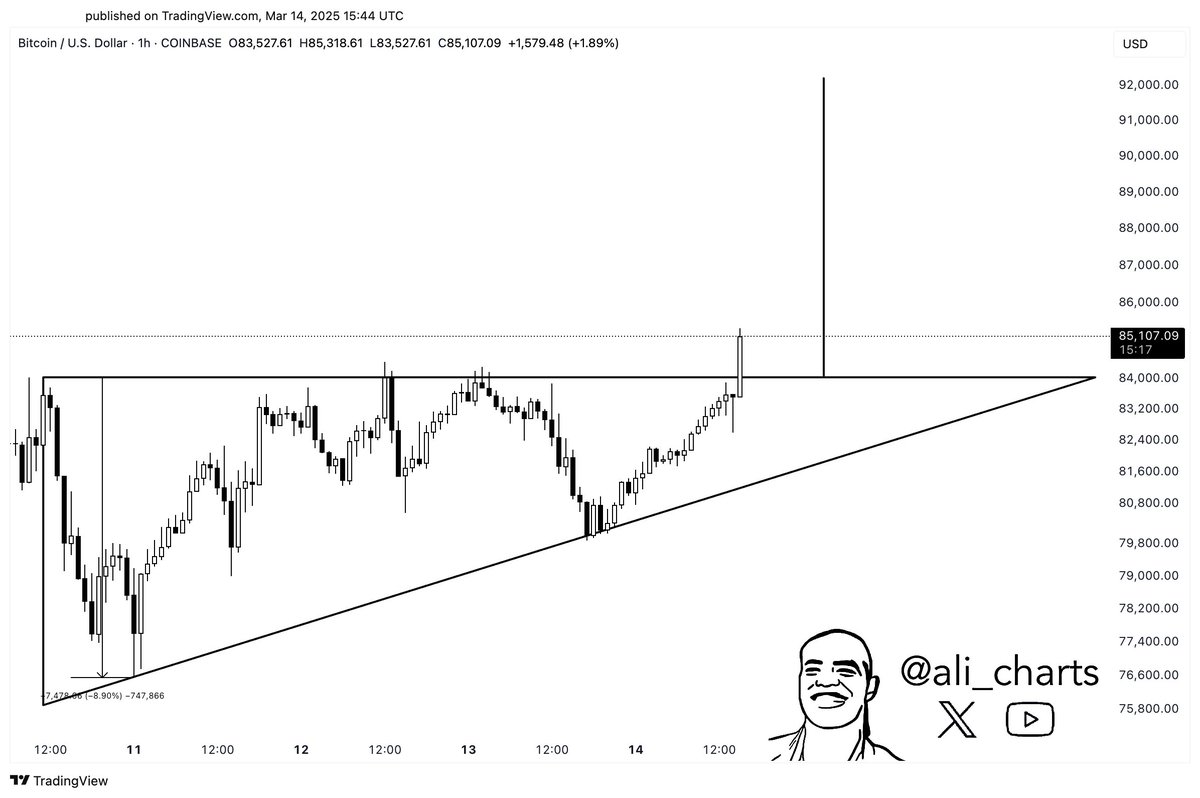
As observed in the highlighted chart, the Bitcoin price seems to be breaking out of the triangle pattern through the horizontal upper trendline around $84,000.
In his post, Martinez noted that a convincing and sustained close above this level the premier cryptocurrency could make a play for the psychological $90,000 level. The price target for an ascending triangle pattern is determined by adding the vertical distance between the horizontal and rising trendlines to the breakout point.
A Bitcoin price leap to $90,000 would represent an almost 7% move from the current price point. As of this writing, the flagship cryptocurrency is valued at around $84,400, reflecting an almost 5% price surge in the past 24 hours.
Can Rising Whale Activity Push BTC Price Up?
If the Bitcoin price is going to reclaim the $90,000 level, it’s going to need all the buying pressure it can get from investors. Interestingly, the largest class of BTC investors (whales) seem to already be in the party, continuously loading their bags over the past few days.
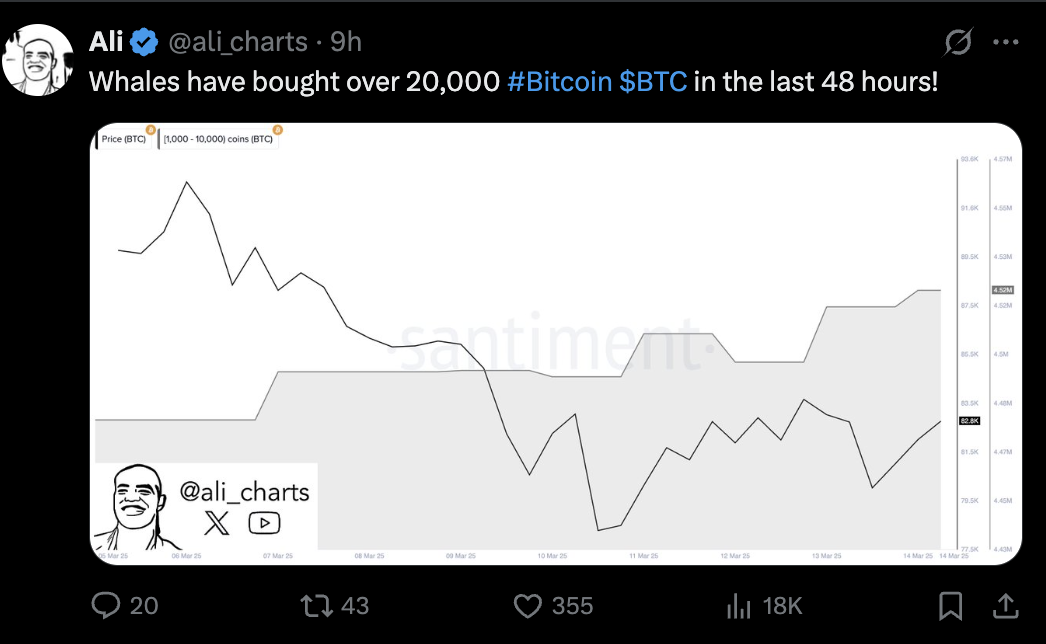
In a separate post on X, Martinez disclosed that whales that own between 1,000 and 10,000 coins have added to their holdings in recent days. Data from Santiment shows this class of whales has acquired 20,000 BTC in the last 24 hours.
This high buying activity from Bitcoin whales could offer BTC’s price the necessary bullish impetus to move to $90,000.
Recommended Articles


