

XRP Price To $110? Bollinger Bands Creator Reveals Why It Will Become A Market Leader

Source Newsbtc

The XRP price could be staging a parabolic rally to new all-time highs of $110. While an analyst shares a technical analysis to back this ambitious target, Bollinger Bands creator John Bollinger declares XRP to be a market leader in the crypto space. 

Analyst Predicts New XRP Price Target To $110

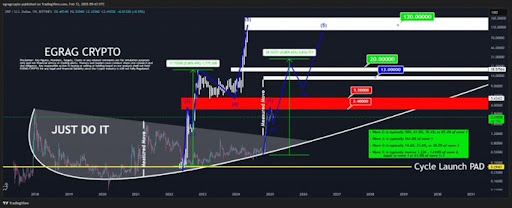
In a rather lengthy X (formerly Twitter) post, market expert Egrag Crypto went deep into his analysis for the XRP price, basing his predictions on its Elliott Wave structure. The crypto analyst confidently forecasted that XRP was heading towards a new $110 ATH. This bullish target would represent a whopping 3,974% increase from its current market value.

Firstly, Egrag Crypto outlines XRP’s five-wave structure, underscoring that each wave could push the cryptocurrency to a new target. The analyst reveals that XRP is currently in Wave 2 of its Elliott Wave structure and is closely approaching Wave 3, which is expected to trigger the most explosive increase.

In Wave 1, XRP saw an impressive 733% increase to new highs. However, in its current Wave 2, Egrag Crypto highlights that its 2017 fractal appears more profound. With the formation of a Double Bottom pattern, the analyst has predicted a potential price breakdown for the cryptocurrency. 
XRP

Egrag Crypto further forecasts that Wave 3 will trigger a reversal and cause the price to skyrocket by 1,185%. This massive price increase would effectively place the XRP price at a potential target between $22 and $24. For a more conservative target, the analyst estimates a surge of around $22 to $24. 

For Wave 4, Egrag Crypto predicts another major retracement similar to Wave 2. However, this time, the analyst believes XRP could decline by either 14.6%, 23.6%, or 38.2% from Wave 3’s price high. This correction would mark a 65% drop from Wave 3’s peak, bringing the cryptocurrency’s price down to $8. He also highlights a worse-case bearish scenario where XRP crashes as low as $3.4. 

Notably, Egrag Crypto shares three potential bullish targets for Wave 5, the final part of the Elliott Wave Structure. He forecasts that the altcoin could surge between $32 to $48, $60 to $70, or $95 to $110. The analyst has based his optimistic forecast on past cycle trends, where 2017 saw a major price rally for XRP. 

Bollinger Bands Creator Says The Asset To Become Leader

In other news, Bollinger, the creator of the renowned Bollinger Band technical analysis tool, has highlighted XRP in his latest post, questioning whether it could take a leading role in the crypto market. The technical analyst asserts that Ripple has held up better than other primary crypto vehicles.

Considering its legal battles with the US SEC and present regulatory challenges, Ripple continues to remain resilient, aiming to gain clarity during the final stages of the five-year-long lawsuit. Meanwhile, the XRP price, which is currently trading at $2.4, has experienced a recent uptick, increasing by almost 4% in the last day, according to CoinMarketCap.

XRP
Disclaimer: For information purposes only. Past performance is not indicative of future results.
placeholder
WTI (USOIL) Is down 2.03% on Sep 25: Here Is WhyWTI (USOIL) is down 2.03% at Sep 24 22:20(UTC+0), now at $92.517, with a 7-day down of 3.63%.What is driving WTI (USOIL)’s stock price down today?The drop in WTI crude oil prices was primarily driven by
Author  TradingKey
Yesterday 04: 57
WTI (USOIL) is down 2.03% at Sep 24 22:20(UTC+0), now at $92.517, with a 7-day down of 3.63%.What is driving WTI (USOIL)’s stock price down today?The drop in WTI crude oil prices was primarily driven by
placeholder
Silver Price Forecast: XAG/USD remains steady near $64.00 as oil prices easeSilver price (XAG/USD) inches higher after two days of losses, trading around $63.90 per troy ounce during Asian hours on Friday. Non-yielding Silver is finding underlying support as inflation concerns ease following a pullback in crude oil prices.
Author  FXStreet
Yesterday 03: 30
Silver price (XAG/USD) inches higher after two days of losses, trading around $63.90 per troy ounce during Asian hours on Friday. Non-yielding Silver is finding underlying support as inflation concerns ease following a pullback in crude oil prices.
placeholder
Gold Price Forecast: Gold Drops Below $4,300, Will It Continue to Fall? As of the European session on September 24, gold prices (XAUUSD) extended their correction, dipping below $4,300 intraday to hit a low of $4,262.45. After previously rebounding close to $
Author  TradingKey
Sep 24, Thu
As of the European session on September 24, gold prices (XAUUSD) extended their correction, dipping below $4,300 intraday to hit a low of $4,262.45. After previously rebounding close to $
placeholder
Yen touches 158.37 as Tokyo reopens, then slips back — ¥15.4 trillion of intervention and the 200-day line stand between here and 160USD/JPY reached 158.37 overnight, its highest since early September, then eased to 157.88 as Japanese markets reopened after a three-day holiday. The Ministry of Finance has spent ¥15.4 trillion defending the yen since late July and the BOJ ran a rate check on September 18. The 200-day average sits at 158.43.
Author  Irene Q.
Sep 24, Thu
USD/JPY reached 158.37 overnight, its highest since early September, then eased to 157.88 as Japanese markets reopened after a three-day holiday. The Ministry of Finance has spent ¥15.4 trillion defending the yen since late July and the BOJ ran a rate check on September 18. The 200-day average sits at 158.43.
placeholder
US input costs rose at the fastest pace in four years — the September flash PMI beat is an inflation story, not a growth storyUS September flash PMIs came in far above expectations, with the composite at 58.4, a five-year high. But the detail that moved markets was input cost inflation at its fastest since October 2022, driven by fuel, transport and supply shortages. Brent is back above $100 and the 10-year Treasury yield has hit its highest since 2007.
Author  Suzie
Sep 24, Thu
US September flash PMIs came in far above expectations, with the composite at 58.4, a five-year high. But the detail that moved markets was input cost inflation at its fastest since October 2022, driven by fuel, transport and supply shortages. Brent is back above $100 and the 10-year Treasury yield has hit its highest since 2007.
goTop
quote