

Ethereum Drop Coming? ETH Risks Fall To $2,180 If This Support Fails – Analyst

Source Newsbtc

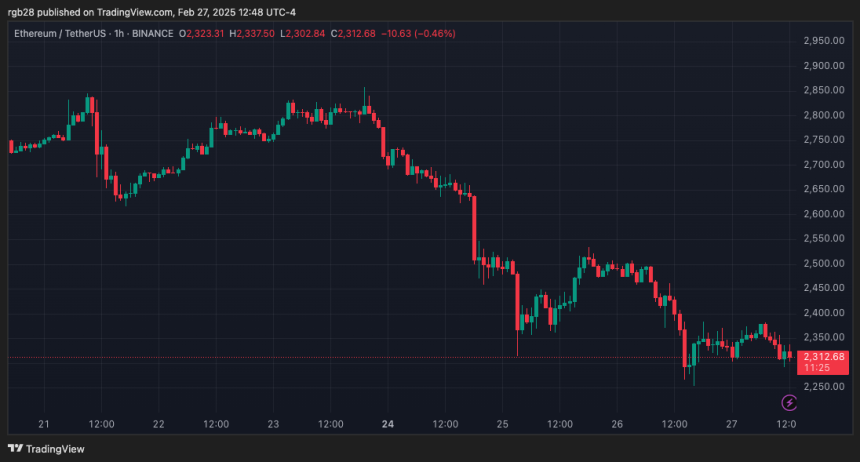
Amid the market retrace, Ethereum (ETH) has lost its key $2,600 support zone and fallen below the next crucial level. As the second-largest cryptocurrency by market capitalization attempts to hold its current range, some analysts predict a 6% drop could be coming.

Ethereum Risks Fall To $2,180

Following the $1.5 billion hack of crypto exchange Bybit, the crypto industry experienced a market correction that sent most cryptocurrencies below their key support levels. Bitcoin’s price fell below the $90,000 mark for the first time since November.

Meanwhile, Solana, one of the leading Altcoins of the cycle, dropped 30% in five days, hitting a five-month low. Nonetheless, Ethereum’s price held relatively well compared to most cryptocurrencies despite accounting for $1.2 billion of the assets stolen in the hack.

The “King of Altcoins” initially dropped 10%, staying around its pre-Bybit hack levels over the weekend, but failed to sustain the $2,600 support after the market crash resumed on Monday.

Crypto analyst Ali Martinez had previously warned that this level was key for cryptocurrency’s bullish trend continuation, and failing to hold this support zone would send the price to the $2,4000 mark.

After the drop, the analyst stated that the $2,425 level was Ethereum’s next most critical support zone, as 10.33 million wallets accumulated 63.43 million ETH. However, the cryptocurrency failed to hold this level on Wednesday, dropping to $2,300 in the past 24 hours.

Martinez warned that Ethereum needs to hold the $2,345 support level now, where 2 million investors bought 58.88 million ETH. If it falls below this level, the millions of investors will be in the red numbers.

Analyst Carl Runefelt also cautioned about ETH’s current levels, suggesting that Ethereum risked dropping another 6%. The analyst advised investors to monitor the bearish flag forming in Ethereum’s hourly chart for the past day, as it could send ETH’s price near the $2,000 support line.

If the cryptocurrency fails to hold the $2,320-$2,330 level, Ethereum’s price targets a breakdown to $2,180.

Ethereum

Short-Term Rally Or Sideways Move Coming?

Crypto analyst Ted Pillows highlighted ETH’s bullish divergence in the 3-hour chart, suggesting that “a short-term rally towards $2,600-$2,700 looks possible.” However, he noted that the potential rebound could be a “dead at bounce.”

Meanwhile, Altcoin Sherpa indicated that the cryptocurrency could move sideways for the next few months, pointing to ETH’s performance after losing the $2,900 support in August 2024.

Ethereum moved within the $2,100-$2,800 price range from August to November 2024, with the second-largest crypto’s current price action starting to resemble last summer’s performance.

Another market watcher also suggested that the King of Altcoins needs an extended re-accumulation period to attempt to reclaim the higher levels, as seen during the FTX collapse, 2023’s capitulation, and Summer 2024’s capitulation. Based on this, ETH could move within its current range for the next two to three months.

Lastly, analyst Titan of Crypto pointed out a Wyckoff Check accumulation pattern in ETH’s weekly chart. He stated that Ethereum appears to retest its key level after a breakout to confirm the trend continuation. Per the post, if the $2,140 level holds, there’s a “potential spring and rally continuation.”

As of this writing, Ethereum trades at $2,324, a 15% drop in the weekly timeframe.
ethereum, eth, ethusdt
Disclaimer: For information purposes only. Past performance is not indicative of future results.
placeholder
US August CPI lands tonight: after a 5.4% PPI shock, will the Fed hike on September 16?US August PPI came in at 5.4% year-on-year, above the 5.3% consensus, with core PPI at 4.6%. Traders have pushed the odds of a 25bp Fed hike on September 15-16 to around 70%. Tonight's CPI is the last major inflation print before the decision — here is the full calendar, the consensus numbers, and what a hot versus cool reading would mean for the dollar, yields, gold and stocks.
Author  Irene Q.
Sep 11, Fri
US August PPI came in at 5.4% year-on-year, above the 5.3% consensus, with core PPI at 4.6%. Traders have pushed the odds of a 25bp Fed hike on September 15-16 to around 70%. Tonight's CPI is the last major inflation print before the decision — here is the full calendar, the consensus numbers, and what a hot versus cool reading would mean for the dollar, yields, gold and stocks.
placeholder
Brent tests $108 as a key export pipeline stays shut — can the rally clear $110?Brent crude rose 2.55% to $106.97 and WTI 2.32% to $102.30 as a major regional export pipeline remained offline with no restart timeline. Front-month backwardation has widened to $5.53 from $3.84 a week ago, European gas is at its highest since December 2022, and one analyst sees $119.48 if talks stall.
Author  Irene Q.
Sep 14, Mon
Brent crude rose 2.55% to $106.97 and WTI 2.32% to $102.30 as a major regional export pipeline remained offline with no restart timeline. Front-month backwardation has widened to $5.53 from $3.84 a week ago, European gas is at its highest since December 2022, and one analyst sees $119.48 if talks stall.
placeholder
Fed hike odds near 90% into Wednesday's decision — how to trade the dollar, gold and the S&P 500A 0.3% monthly core CPI print has lifted the market-implied probability of a 25bp Fed hike on 16 September to roughly 86.5% ~ 90%, which would be the first increase since July 2023. Here is the decision timeline, the pricing versus the forecasts, both scenarios, and the key levels for the dollar, gold and the S&P 500.
Author  Suzie
Sep 14, Mon
A 0.3% monthly core CPI print has lifted the market-implied probability of a 25bp Fed hike on 16 September to roughly 86.5% ~ 90%, which would be the first increase since July 2023. Here is the decision timeline, the pricing versus the forecasts, both scenarios, and the key levels for the dollar, gold and the S&P 500.
placeholder
Gold falls below $4,300 as higher US yields bolster Fed rate hike betsGold price (XAU/USD) tumbles to near $4,295 during the early Asian session on Tuesday. The precious metal faces some selling pressure as rising bond yields and surging energy prices strengthen expectations that the US Federal Reserve (Fed) will raise interest rates this week. 
Author  FXStreet
Yesterday 01: 23
Gold price (XAU/USD) tumbles to near $4,295 during the early Asian session on Tuesday. The precious metal faces some selling pressure as rising bond yields and surging energy prices strengthen expectations that the US Federal Reserve (Fed) will raise interest rates this week. 
placeholder
【Daily Brief】10-year Treasury yield briefly tops 5%, S&P 500 slips to 7,602 and the dollar firms at 99.3 as the Fed's decision eve beginsThe 10-year Treasury yield touched 5.014% on Monday — its first print above 5% since October 2023 — while the S&P 500 closed 0.48% lower at 7,619.98 and the dollar index firmed to 99.3. Here is the full market wrap ahead of Wednesday's FOMC decision, the dot plot and the August retail sales report, plus today's CLARITY Act Senate vote.
Author  Irene Q.
18 hours ago
The 10-year Treasury yield touched 5.014% on Monday — its first print above 5% since October 2023 — while the S&P 500 closed 0.48% lower at 7,619.98 and the dollar index firmed to 99.3. Here is the full market wrap ahead of Wednesday's FOMC decision, the dot plot and the August retail sales report, plus today's CLARITY Act Senate vote.
goTop
quote