

Bitcoin (BTC) Faces Key Support as Price Drops 11% in One Week
Bitcoin (BTC) has faced significant downward pressure over the past week, with its price falling below $90,000 for the first time since November 2024. It is down 11% in the last seven days and is currently trading near a critical resistance level of $85,985.
Technical indicators are showing predominantly bearish signals. The red cloud is positioned above the current price action and widening slightly, indicating increasing bearish momentum. Despite this short-term weakness, some analysts point to potential signs of recovery as short-term EMA lines begin to trend upward.
Bitcoin Ichimoku Cloud Shows a Bearish Setup
The Ichimoku Cloud for Bitcoin shows a predominantly bearish sentiment. The red cloud (Kumo) is positioned above the current price action, signaling a resistance zone that BTC would need to break through to reverse the trend. The cloud is also widening slightly, indicating increasing bearish momentum.
The Leading Span A (green line) is below the Leading Span B (red line), further confirming the bearish outlook. Additionally, the price is trading below both the blue Tenkan-sen (conversion line) and the red Kijun-sen (baseline), suggesting that the short-term trend is still under downward pressure.
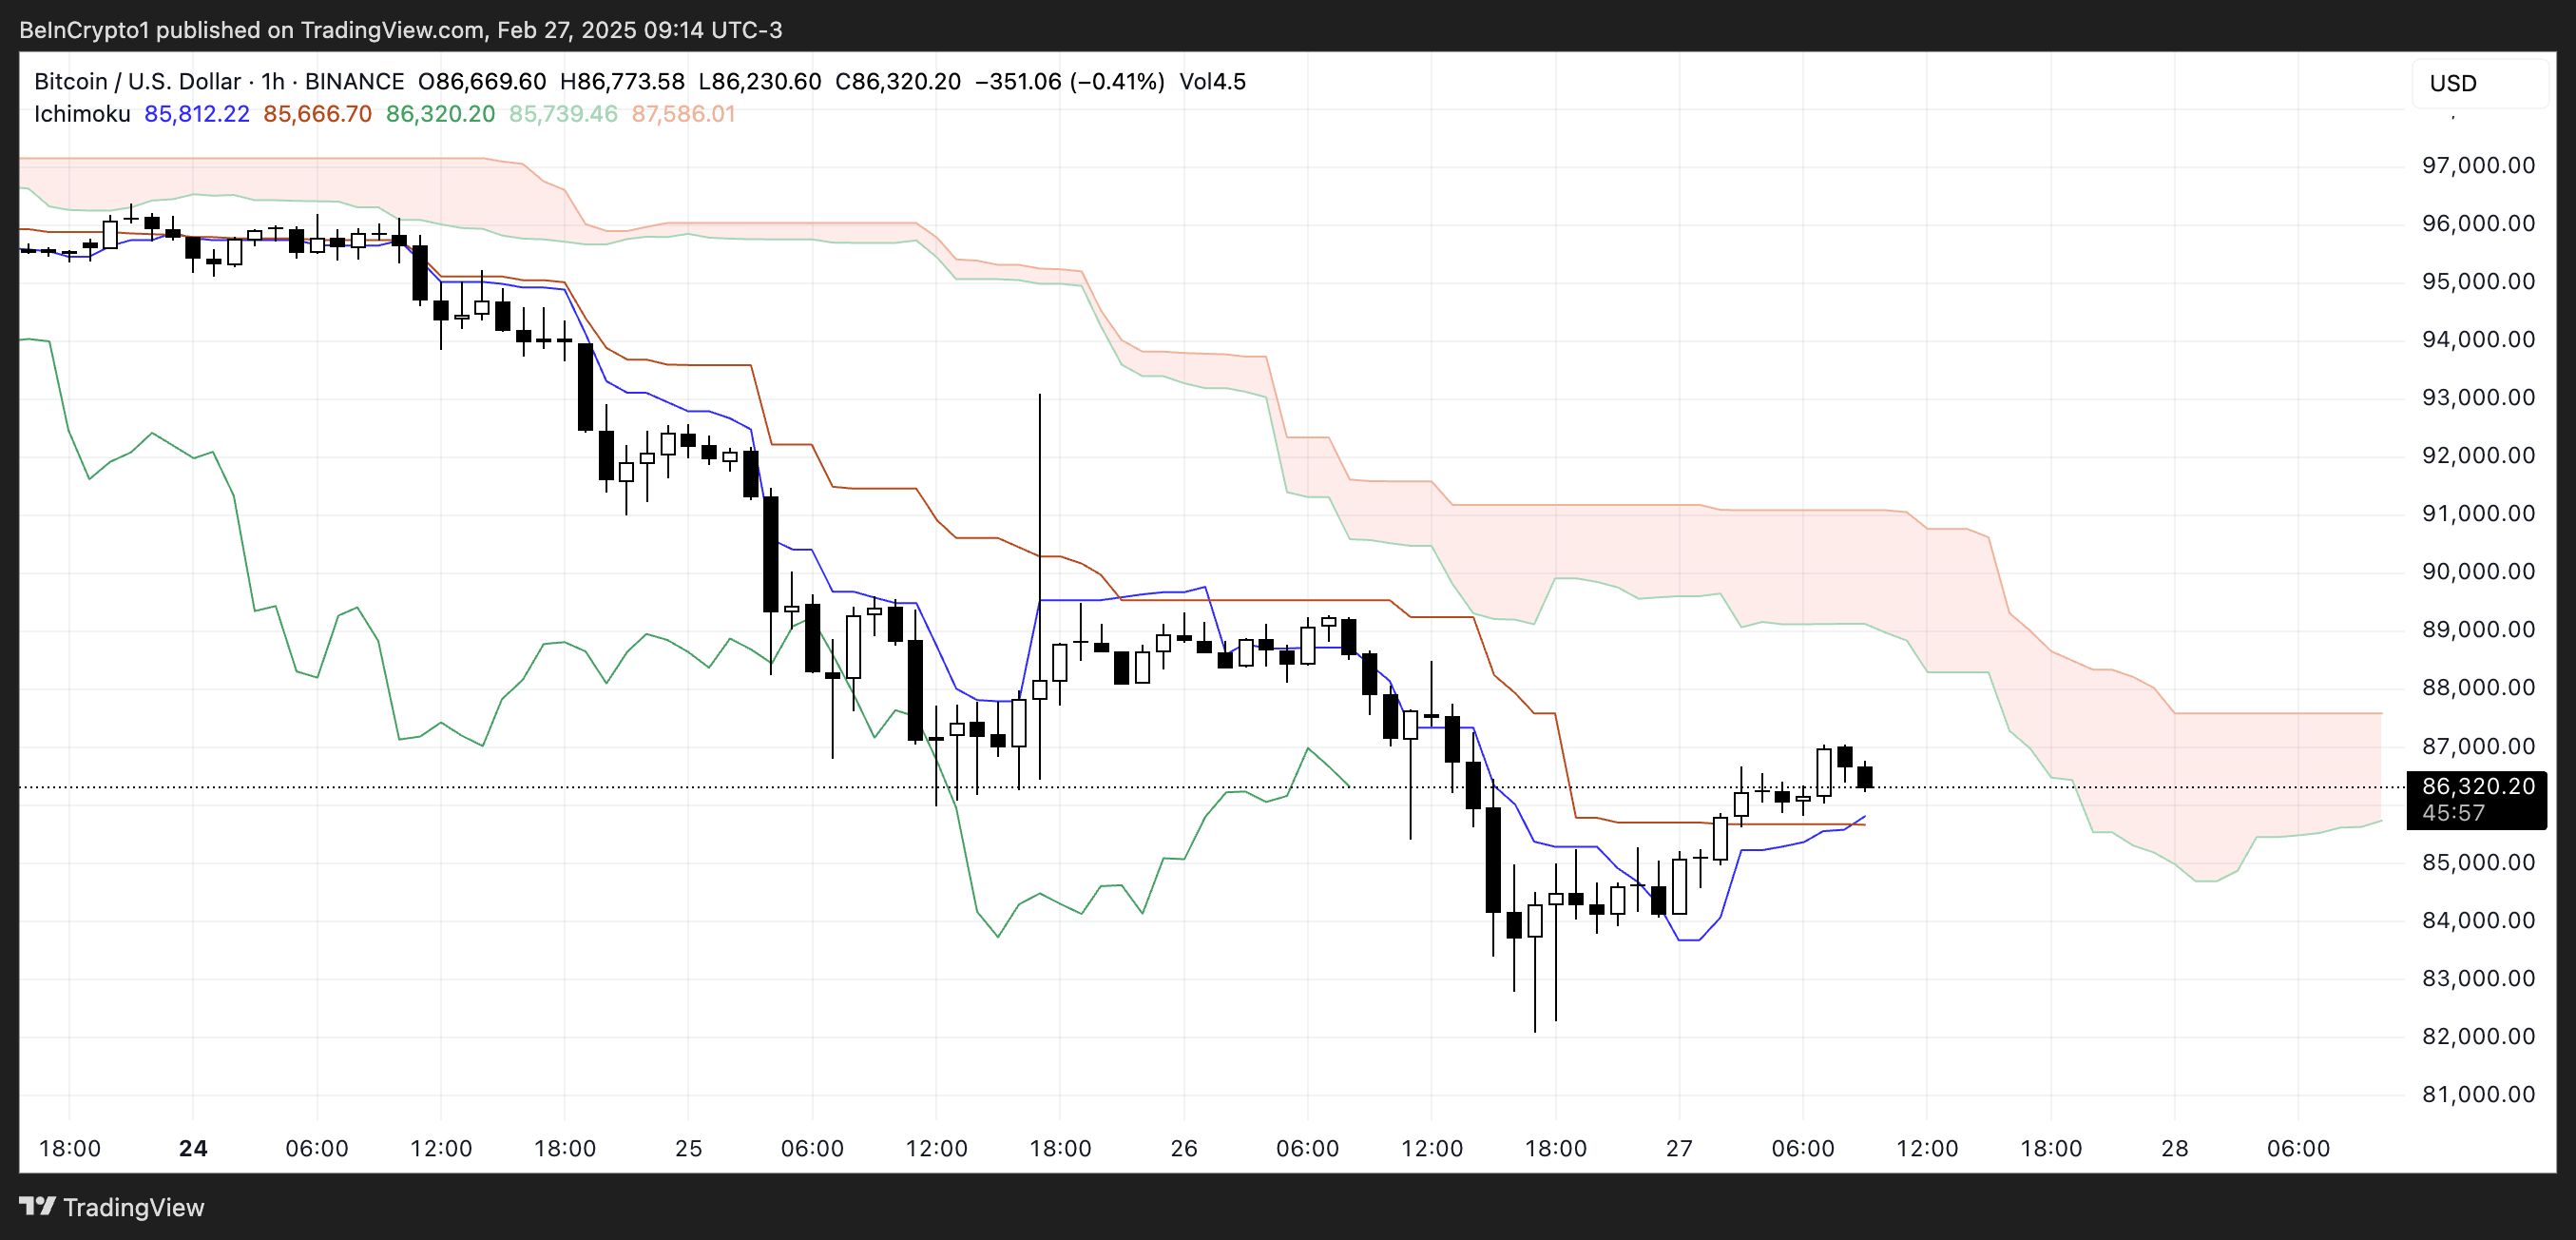 BTC Ichimoku Cloud. Source: TradingView.
The Tenkan-sen has started to flatten out, which typically indicates a pause or consolidation in the downtrend. However, it remains below the Kijun-sen, reinforcing the bearish bias.
The green Chikou Span (lagging line) is below the price action and the cloud, supporting the continuation of the bearish trend. Overall, unless BTC can push through the cloud resistance and the Tenkan-sen crosses above the Kijun-sen, the bearish momentum is likely to persist.
BTC Whales Are Going Down In the Last 5 Days
The number of Bitcoin whales, defined as addresses holding at least 1,000 BTC, demonstrated steady growth until reaching a peak of 2,054 on February 22.
Since that high point, however, the metric has begun to decline, with the current count standing at 2,042 whale addresses.
Tracking these large holders is crucial for market participants, as whales possess significant market-moving power. Their accumulation or distribution patterns often precede major price movements, and their concentration levels provide insight into Bitcoin’s wealth distribution and overall network health.
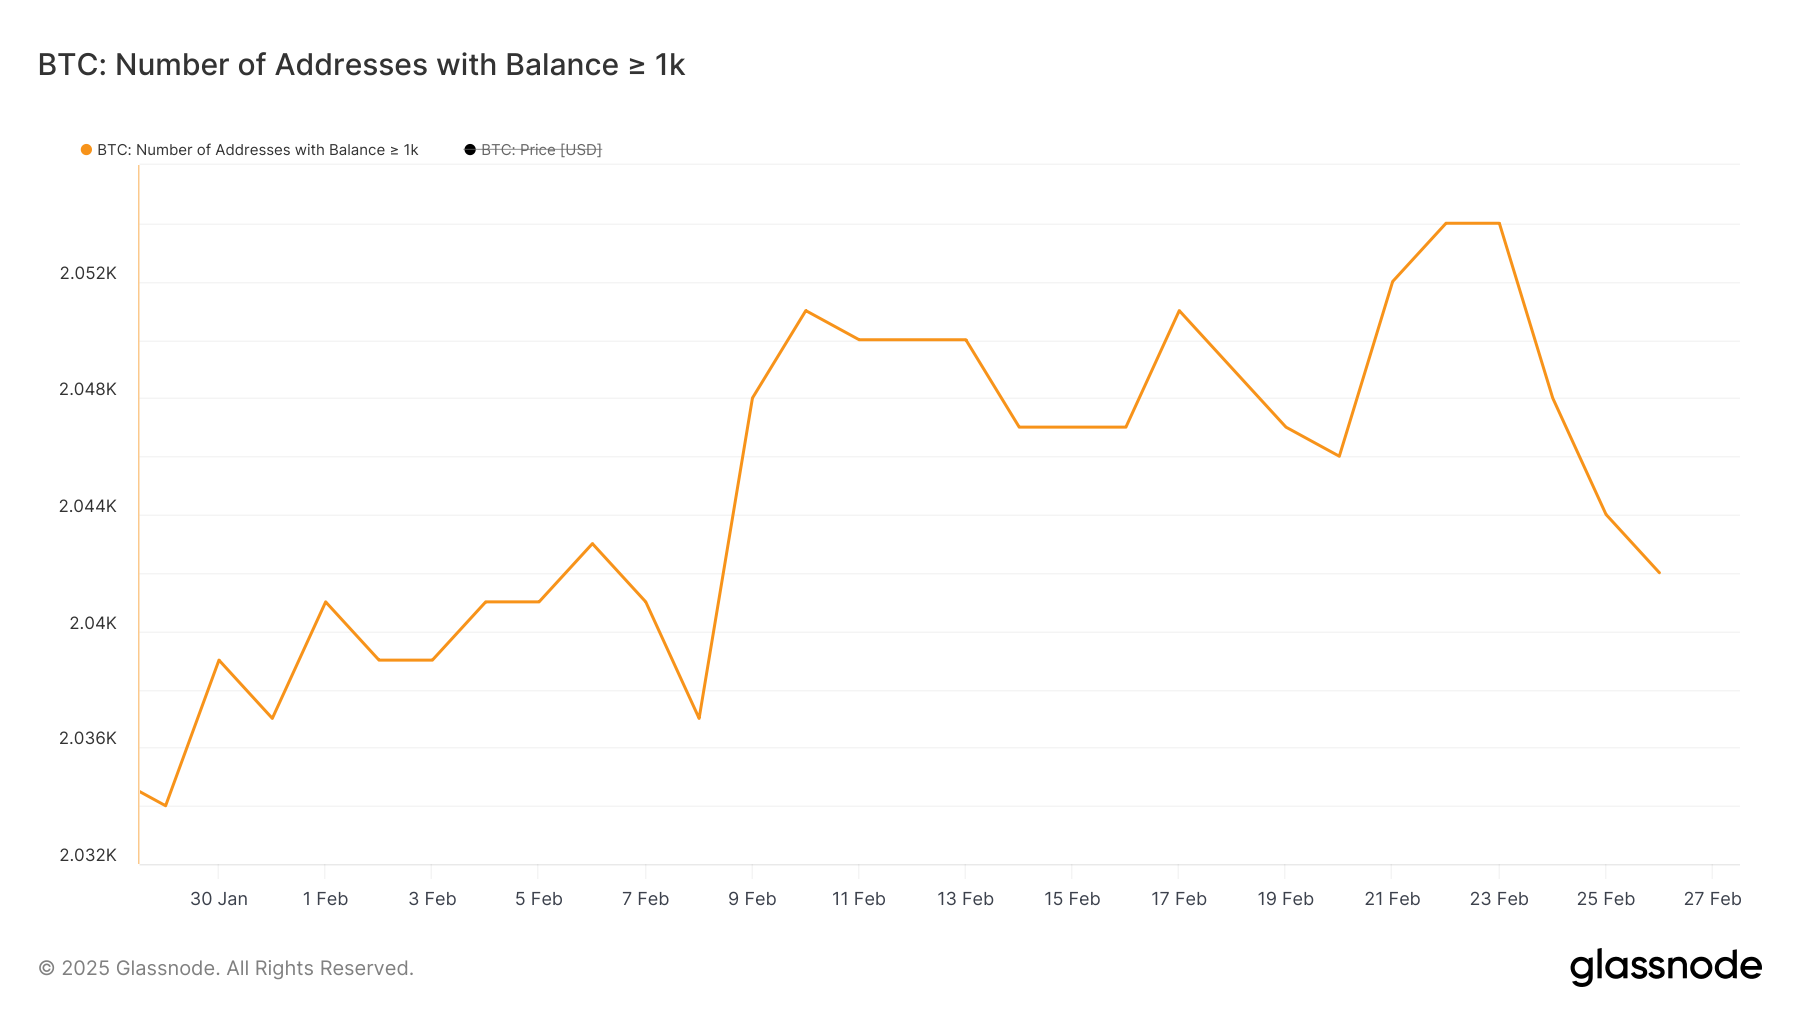 Number of addresses holding at least 1,000 BTC. Source: Glassnode.
The recent decline in whale addresses could signal short-term selling pressure, as these large holders may be taking profits or redistributing their holdings across multiple wallets for security purposes, potentially contributing to price volatility or downward pressure in the near term.
Despite this recent decrease, it’s important to note that the current whale count of 2,042 remains historically elevated compared to previous years, suggesting continued strong institutional and high-net-worth individual interest in Bitcoin as a long-term store of value. According to Tracy Jin, COO of MEXC:
“The long-term trend remains unchanged: institutional demand and the development of Bitcoin infrastructure, including ETFs and new investment products, continue to strengthen its position. However, the short-term outlook remains under pressure: the market is going through a phase of liquidation of excess leverage and a decrease in risk appetite.The market is going through a phase of liquidation of excess leverage and a decrease in risk appetite, but this is beneficial for BTC’s long-term healthy development,” Jin told BeInCrypto.
Will Bitcoin Recover Levels Above $90,000?
Bitcoin currently has a significant resistance level at $85,985. A failure to maintain this support could trigger a downward movement toward the $82,000 range, continuing the current correction.
The proximity to this resistance level has created heightened tension among traders who are carefully watching for signs of direction in this volatile market.
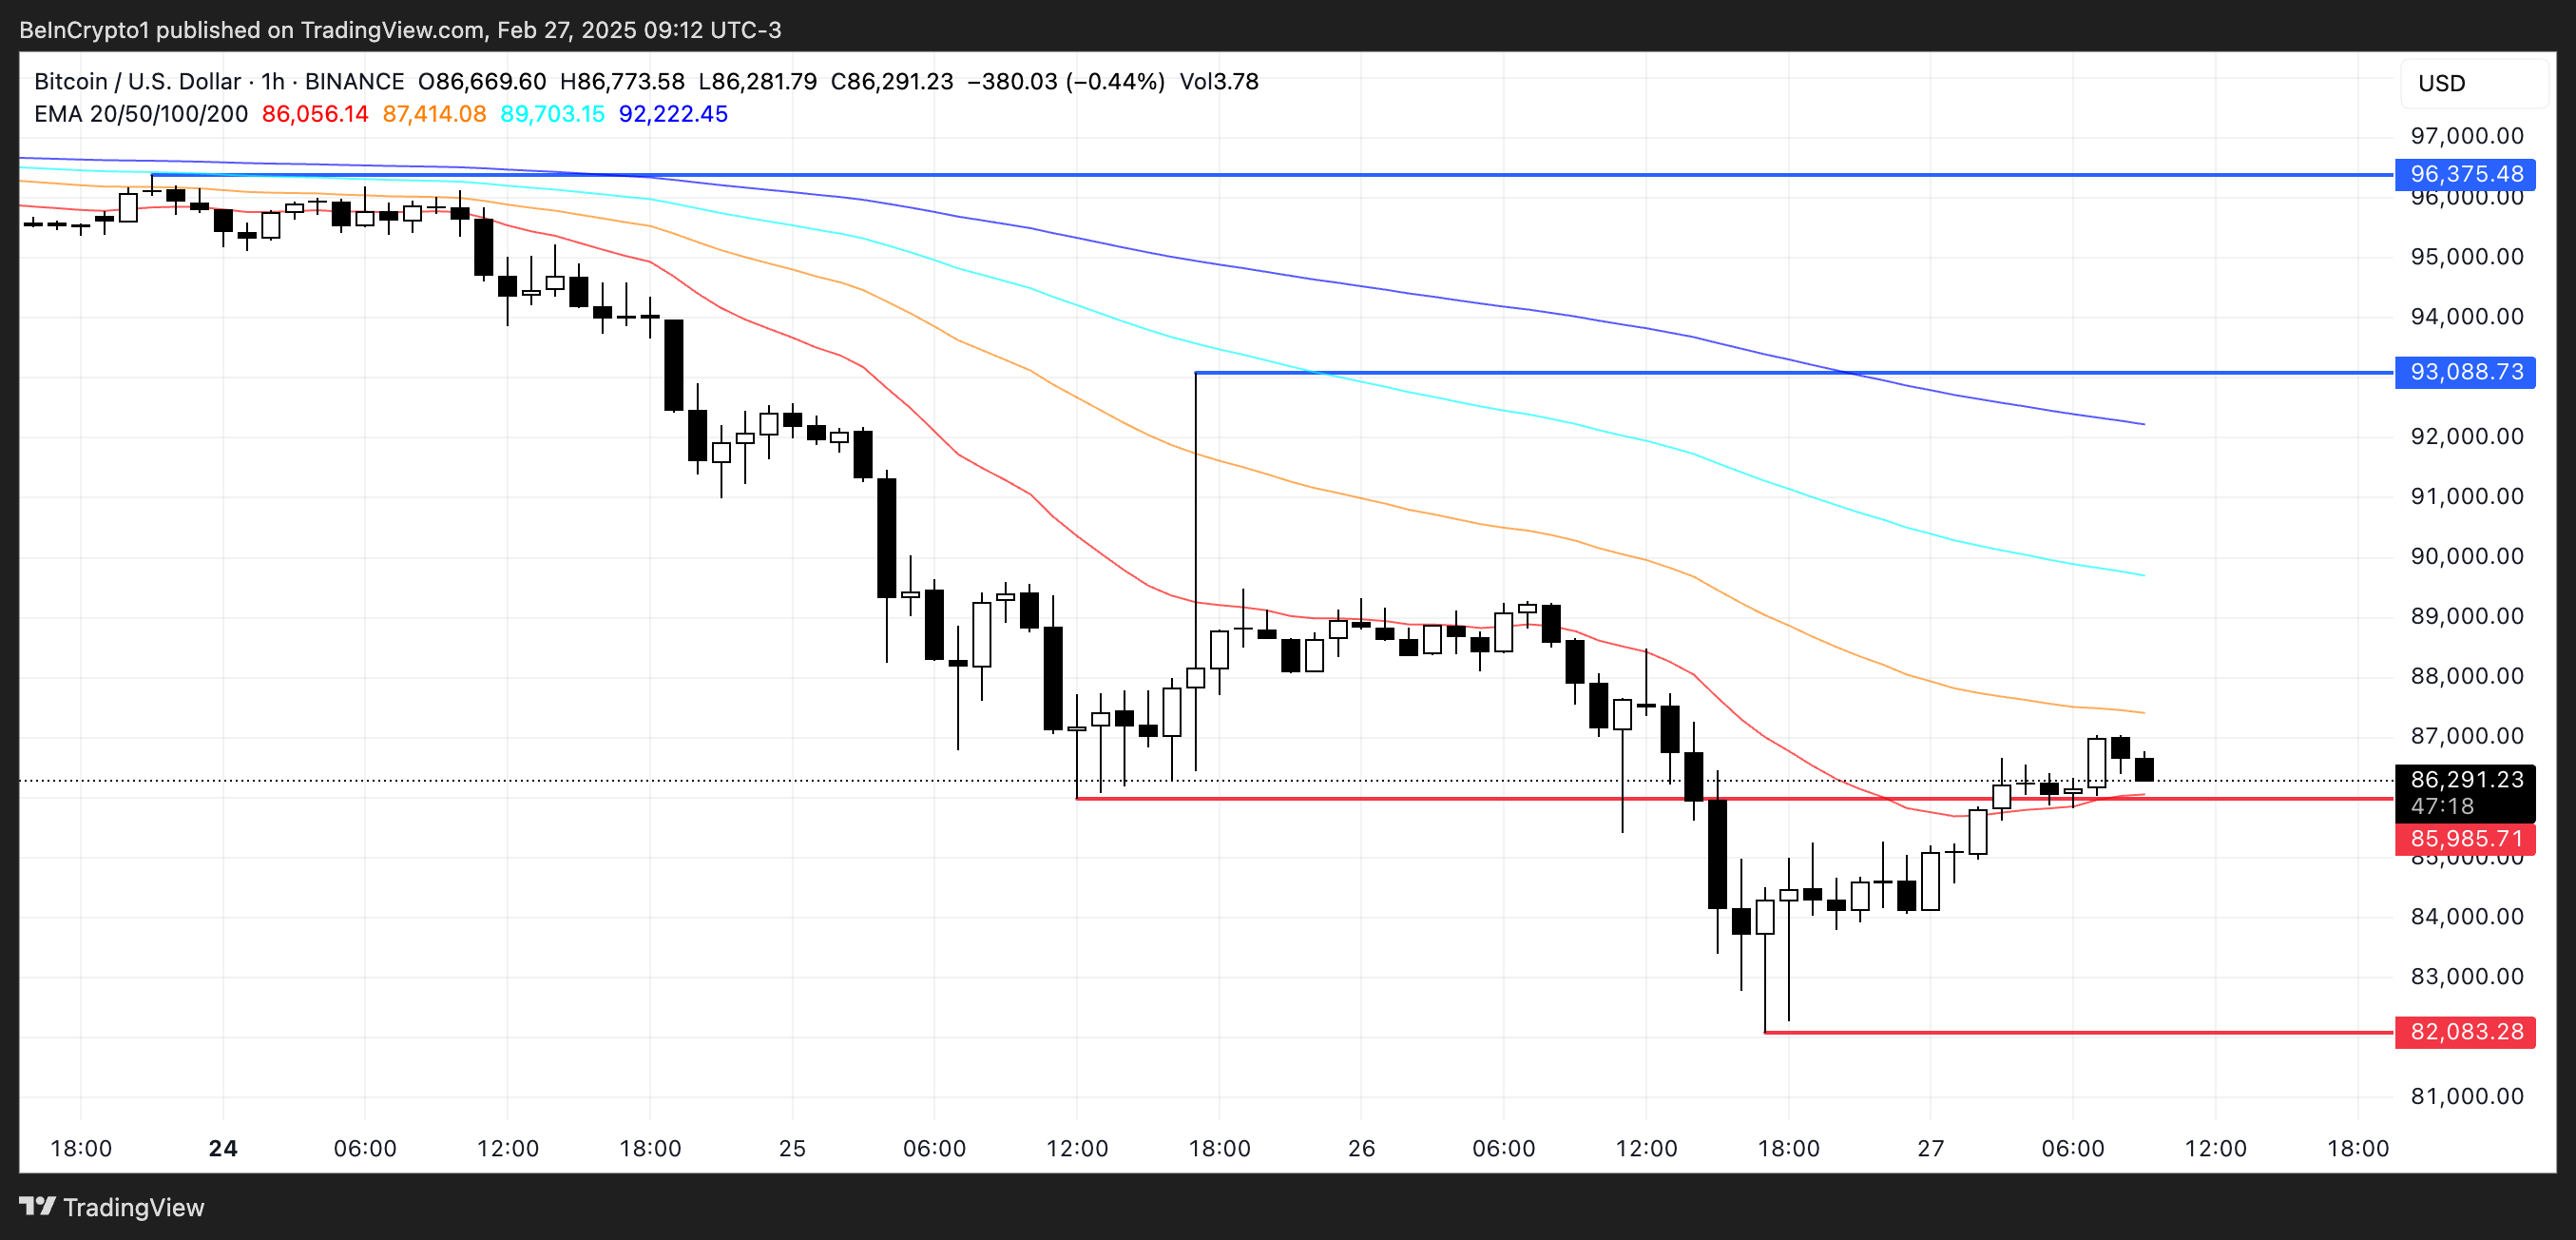 BTC Price Analysis. Source: TradingView.
Despite the current bearish configuration of Bitcoin’s Exponential Moving Average (EMA) lines, with short-term indicators positioned below their long-term counterparts, there are emerging signs of potential optimism.
“Despite the current decline, Bitcoin’s long-term trajectory remains strong. Institutional players continue to increase their positions in BTC, and the development of Bitcoin infrastructure (including new ETFs and payment solutions) only strengthens its status as digital gold. In the short term, the price needs to recover above $96,000-$100,000, which will confirm the market’s readiness for new growth. If the pressure persists, the market may enter a phase of a deeper correction.”Maria Carola, CEO of StealthEx.
The upward trajectory of the short-term EMA lines suggests a possible trend reversal in the near future. If this bullish crossover materializes, Bitcoin price could gain momentum to challenge the resistance at $93,000.
A breakthrough at this level might propel prices toward the next significant target of $96,375, potentially signaling the resumption of the broader uptrend that has characterized much of Bitcoin’s recent performance.
Recommended Articles


