


Ethereum Historical Indicator Flashes Long-Term Buy Signal – Is History Repeating?
Ethereum has been struggling below the $2,800 mark for days, unable to reclaim it as support to kickstart a recovery rally. This key level remains a significant barrier for bulls, and as the price continues to consolidate below it, bearish sentiment is growing. Many analysts call for a continuation of the downtrend, reflecting the downbeat mood in the market. Investors, who once believed Ethereum would rally alongside Bitcoin this year, are now showing signs of doubt.
However, not everyone is bearish. Some investors remain optimistic, pointing to signs that Ethereum may be gearing up for a recovery phase. Crypto analyst Ali Martinez recently shared a technical analysis revealing that the TD Sequential indicator has flashed a buy signal on Ethereum’s weekly chart. This rare event has historically indicated the beginning of a significant trend reversal. Martinez points out that whenever this indicator is triggered during the weekly timeframe, Ethereum often follows with strong upward momentum, signaling a potential bullish phase ahead.
As Ethereum hovers below the $2,800 resistance, traders and investors are watching closely. If history repeats itself and the TD Sequential signal proves accurate, Ethereum could surprise the market with an aggressive move into higher price levels.
Ethereum Prepares For A Recovery Phase
Ethereum is testing critical liquidity below the $3,000 level, a significant psychological price point that analysts believe will determine Ethereum’s performance in the coming weeks. This level has become a battleground between bulls and bears, with sentiment in the market remaining highly divided.
Retail investors, losing confidence in the potential for a near-term recovery, continue to sell, contributing to downward pressure on the price. Meanwhile, larger players appear to be taking advantage of the dip, accumulating Ethereum at an accelerated pace, signaling confidence in the asset’s long-term potential.
Martinez recently shared a technical analysis on X, highlighting a significant historical pattern on Ethereum’s weekly chart. Martinez noted that each time the TD Sequential indicator has flashed a buy signal near the lower boundary of Ethereum’s long-term ascending channel, prices have historically rebounded with strength. This indicator, widely used by traders to spot trend reversals, suggests that Ethereum may be nearing a pivotal moment.
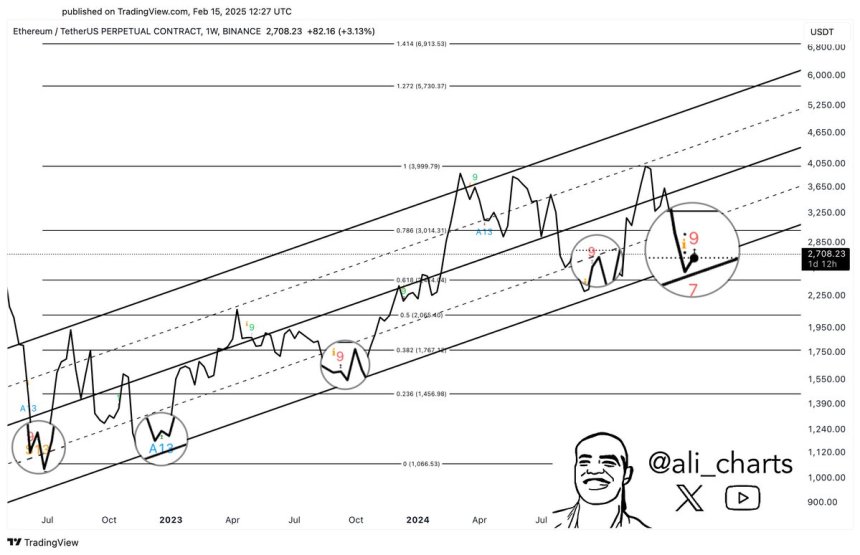
According to Martinez, a similar setup is unfolding now as Ethereum consolidates just below key resistance levels. If the TD Sequential signal plays out as it has in the past, Ethereum could be gearing up for a powerful recovery rally. Reclaiming the $3,000 level and holding it as support would mark the first step toward reversing the bearish trend and initiating a long-term uptrend. The coming weeks will be crucial for Ethereum as investors watch for signs of a breakout or a further decline.
ETH Consolidates Before A Big Move
Ethereum (ETH) is trading at $2,690 after days of sideways trading and market indecision. This period of stagnation has left investors speculating about the short-term direction of ETH, as sentiment remains divided between bullish recovery and further downside potential. The lack of momentum above key resistance levels has contributed to uncertainty, with both bulls and bears struggling to take decisive control.
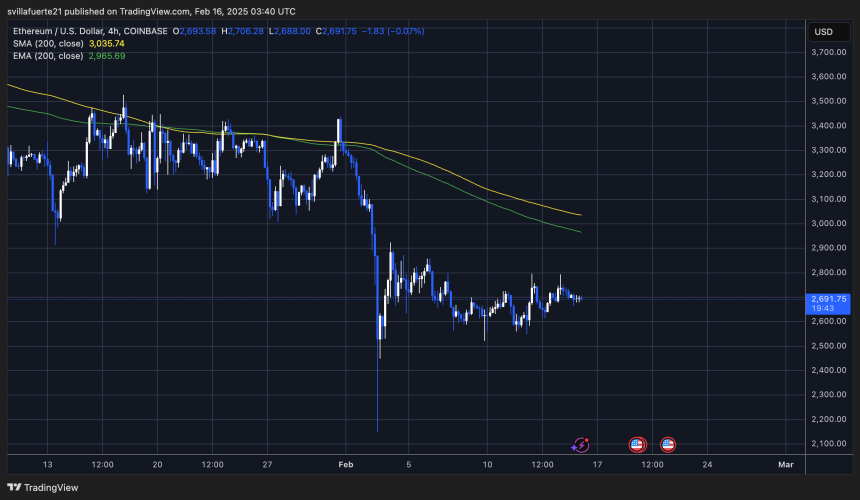
For Ethereum to initiate a recovery uptrend, bulls must reclaim the $2,800 mark as support. This critical level has acted as a key barrier in recent weeks, and breaking above it would pave the way for a push toward the $3,000 mark. A successful move above $3,000, a psychological and technical resistance level, would confirm a reversal of the downtrend and establish bullish momentum in the market.
However, the risk of further downside remains if ETH fails to reclaim the $2,800 level. A retracement could take the price into lower demand zones around $2,500, where stronger support may be found. The next few trading sessions will be critical, as Ethereum’s price action will likely dictate market sentiment and influence its short-term trajectory. Investors are watching closely for a decisive breakout or further consolidation as the market remains uncertain.
Featured image from Dall-E, chart from TradingView
Recommended Articles


