


Solana Bulls Eye $260 As Key Support Holds, Says Crypto Analyst
In a recent chart update published on February 14, 2025, crypto analyst Ali Martinez (@ali_charts) highlighted Solana’s steadfast performance above the $190 mark, suggesting the potential for a breakout toward $225 or even $260. The one-day SOL/USDT chart (Binance) reveals several notable technical signals that support Martinez’s outlook.
Why Solana Is Poised For $260
The chart outlines a rising channel that has been in play since roughly the summer, starting near $125 (close to the 0 Fibonacci level at $124.96) and stretching as high as the upper boundary near $355 (around the 1.414 Fibonacci extension at $355.78). Within this broad upward corridor, Solana’s price has consistently bounced between the lower and upper trendlines, creating a visually recognizable pattern of higher highs and higher lows.
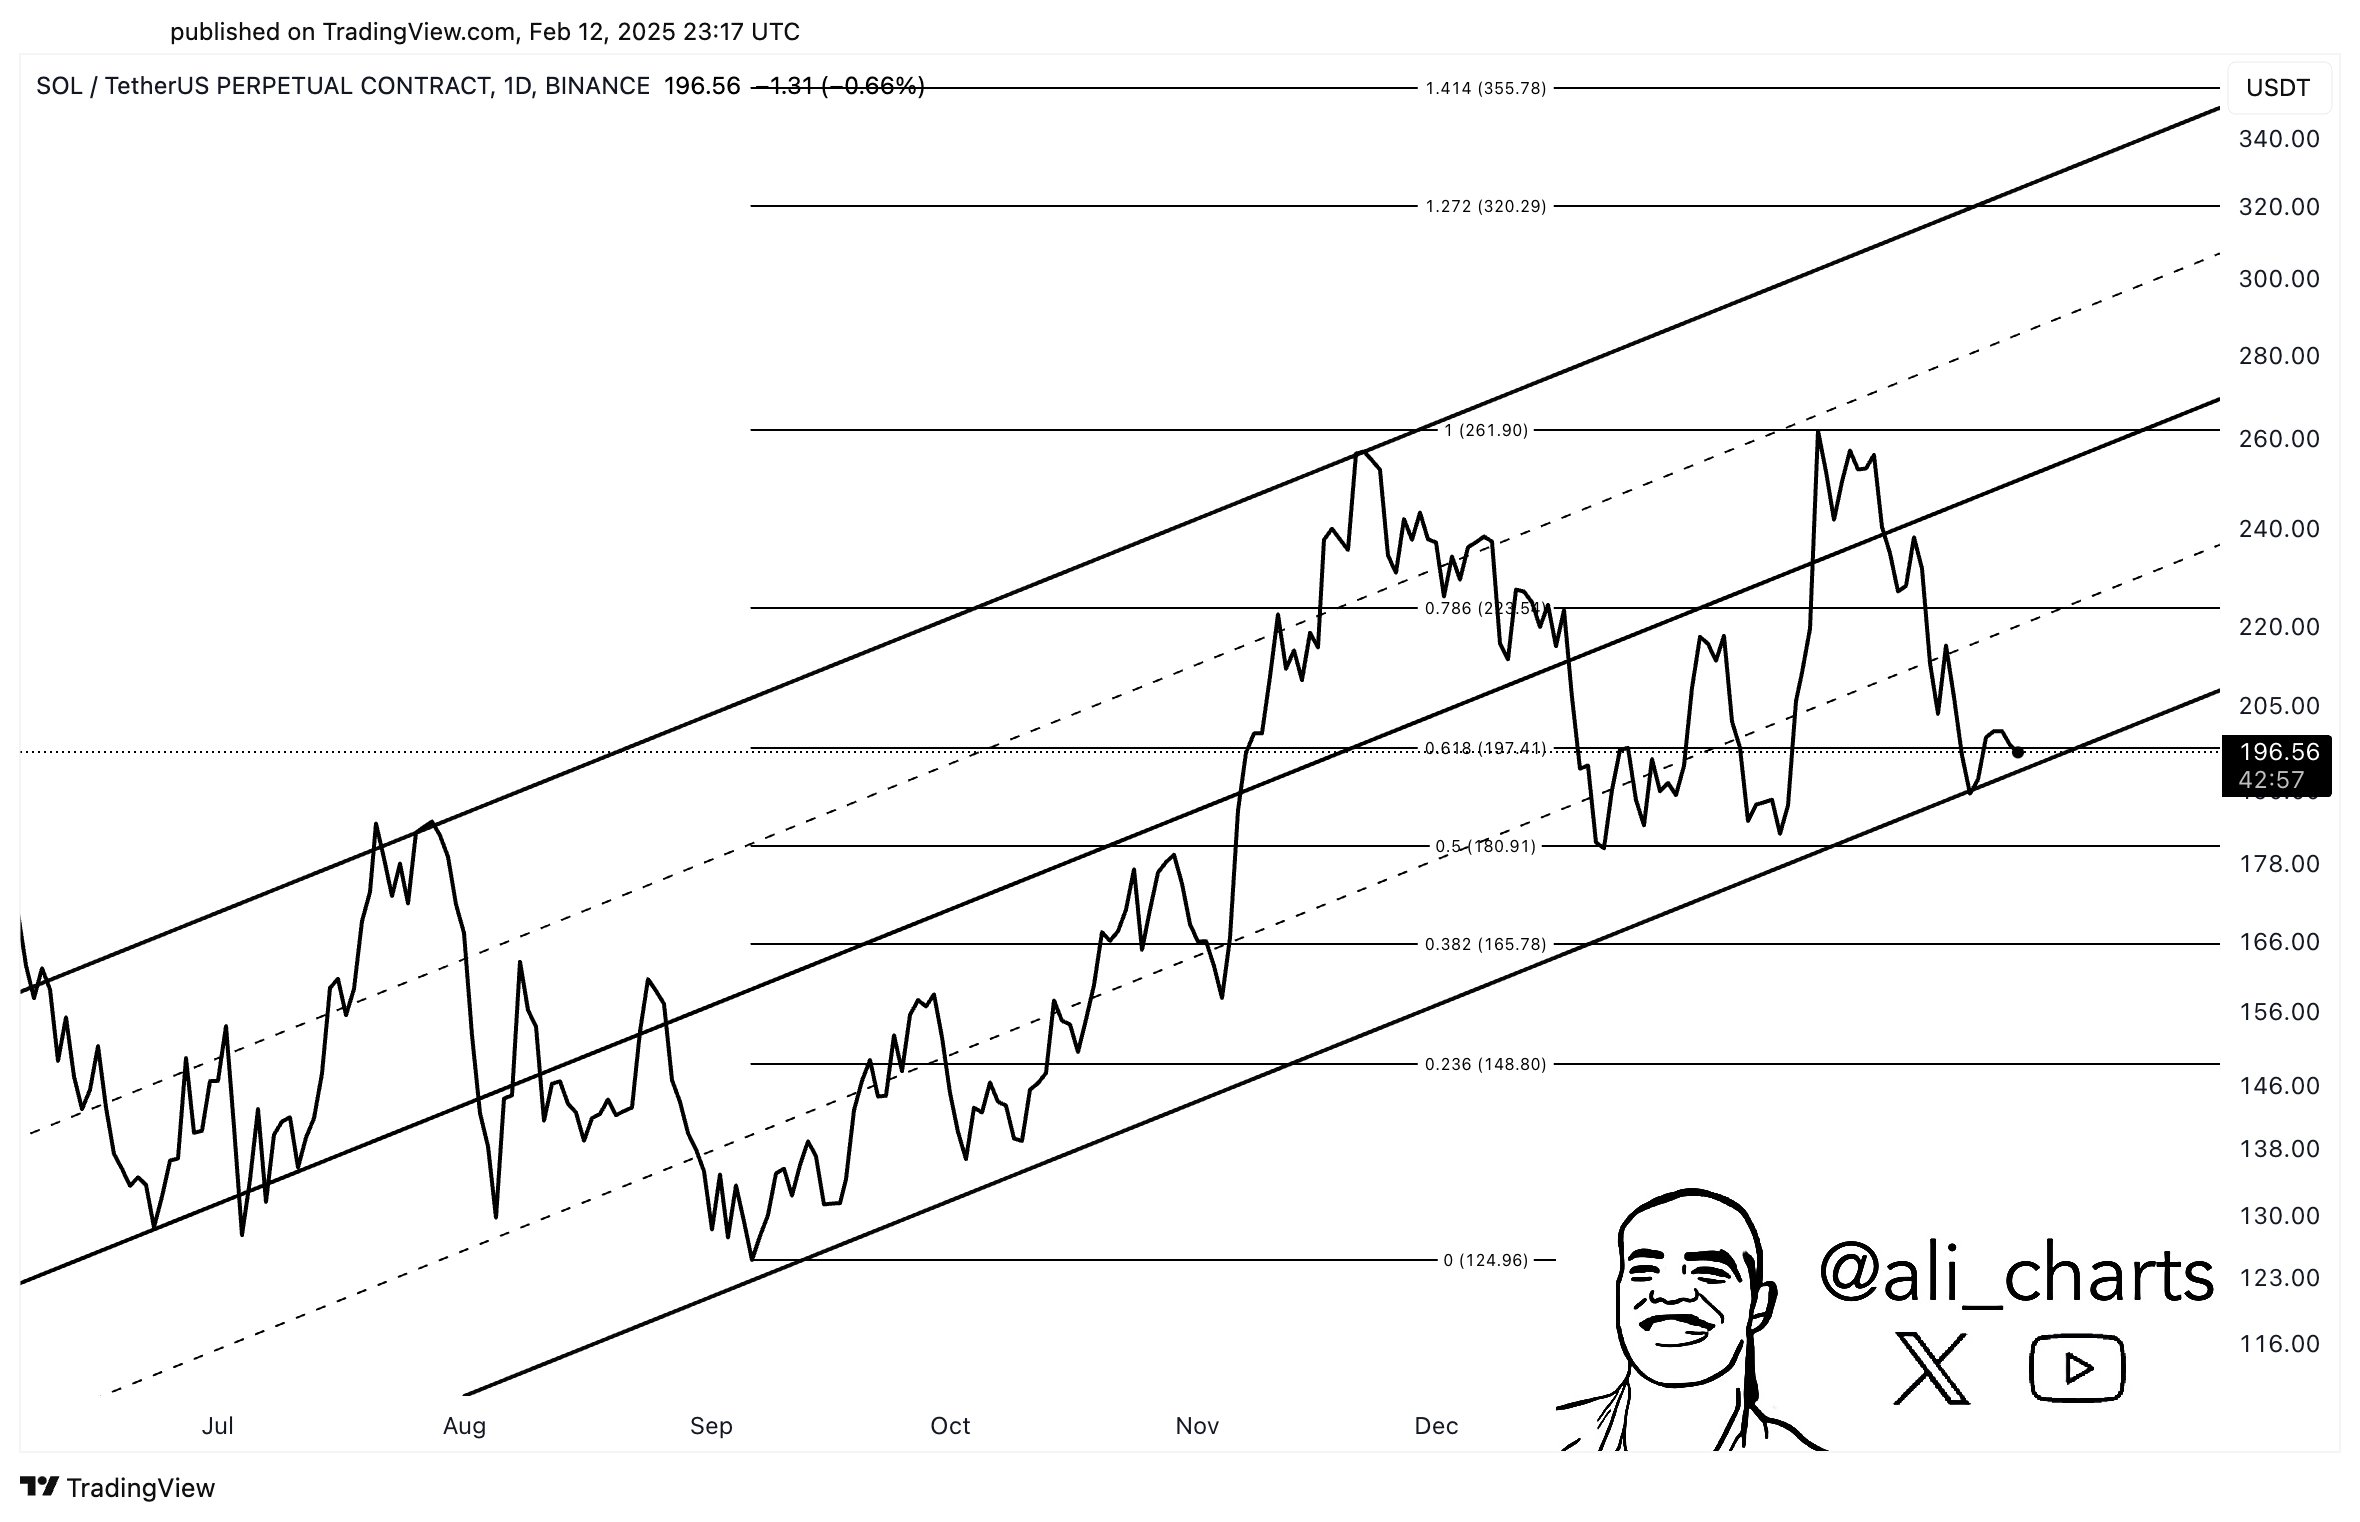
A closer look at Martinez’s annotations reveals several key Fibonacci levels. The 0.382 Fib hovers near $165.78, while the 0.5 line comes in at $180.91—both previously acting as support or resistance at different points of Solana’s climb. But the 0.618 Fib at $187.41 appears especially crucial for the current setup, as that zone has helped keep SOL on its feet during recent dips. Martinez points to this region as a core layer of support that buyers are defending.
Above these levels, the chart highlights potential take-profit or resistance targets at the 0.786 Fib around $226.28 and the 1.0 level near $261.90. Overcoming these thresholds would signal a renewed bullish push that could see SOL continuing its ascent within the channel. Meanwhile, the further extension lines at $320.29 (1.272) and $355.78 (1.414) demonstrate that, if Solana regains strong momentum, additional upside targets remain on the table for the long term.
Martinez’s mention of “Solana is holding firm above $190, setting the stage for a potential breakout to $225 or $260!” underscores the importance of the $187–$190 area. If buyers continue to defend this section of the chart, Solana may very well challenge the upper boundary of the channel again, testing the $225 resistance and potentially marching onward to the $260 region.
For now, all eyes remain on whether SOL can sustain its place above the lower portion of the ascending channel. Should that support fail, the token could retrace toward $165 (0.382 Fib) or lower. But as it stands, the overall structure still looks favorable to the upside, lending credence to Martinez’s prediction of another leg higher toward $225 and possibly $260.
However, it’s crucial to remember that broader market conditions still need to line up, particularly with Bitcoin stuck in its sideways range between $91,200 and $108,000. Any decisive move beyond this range could serve as the catalyst for altcoins like Solana to capitalize on renewed market momentum.
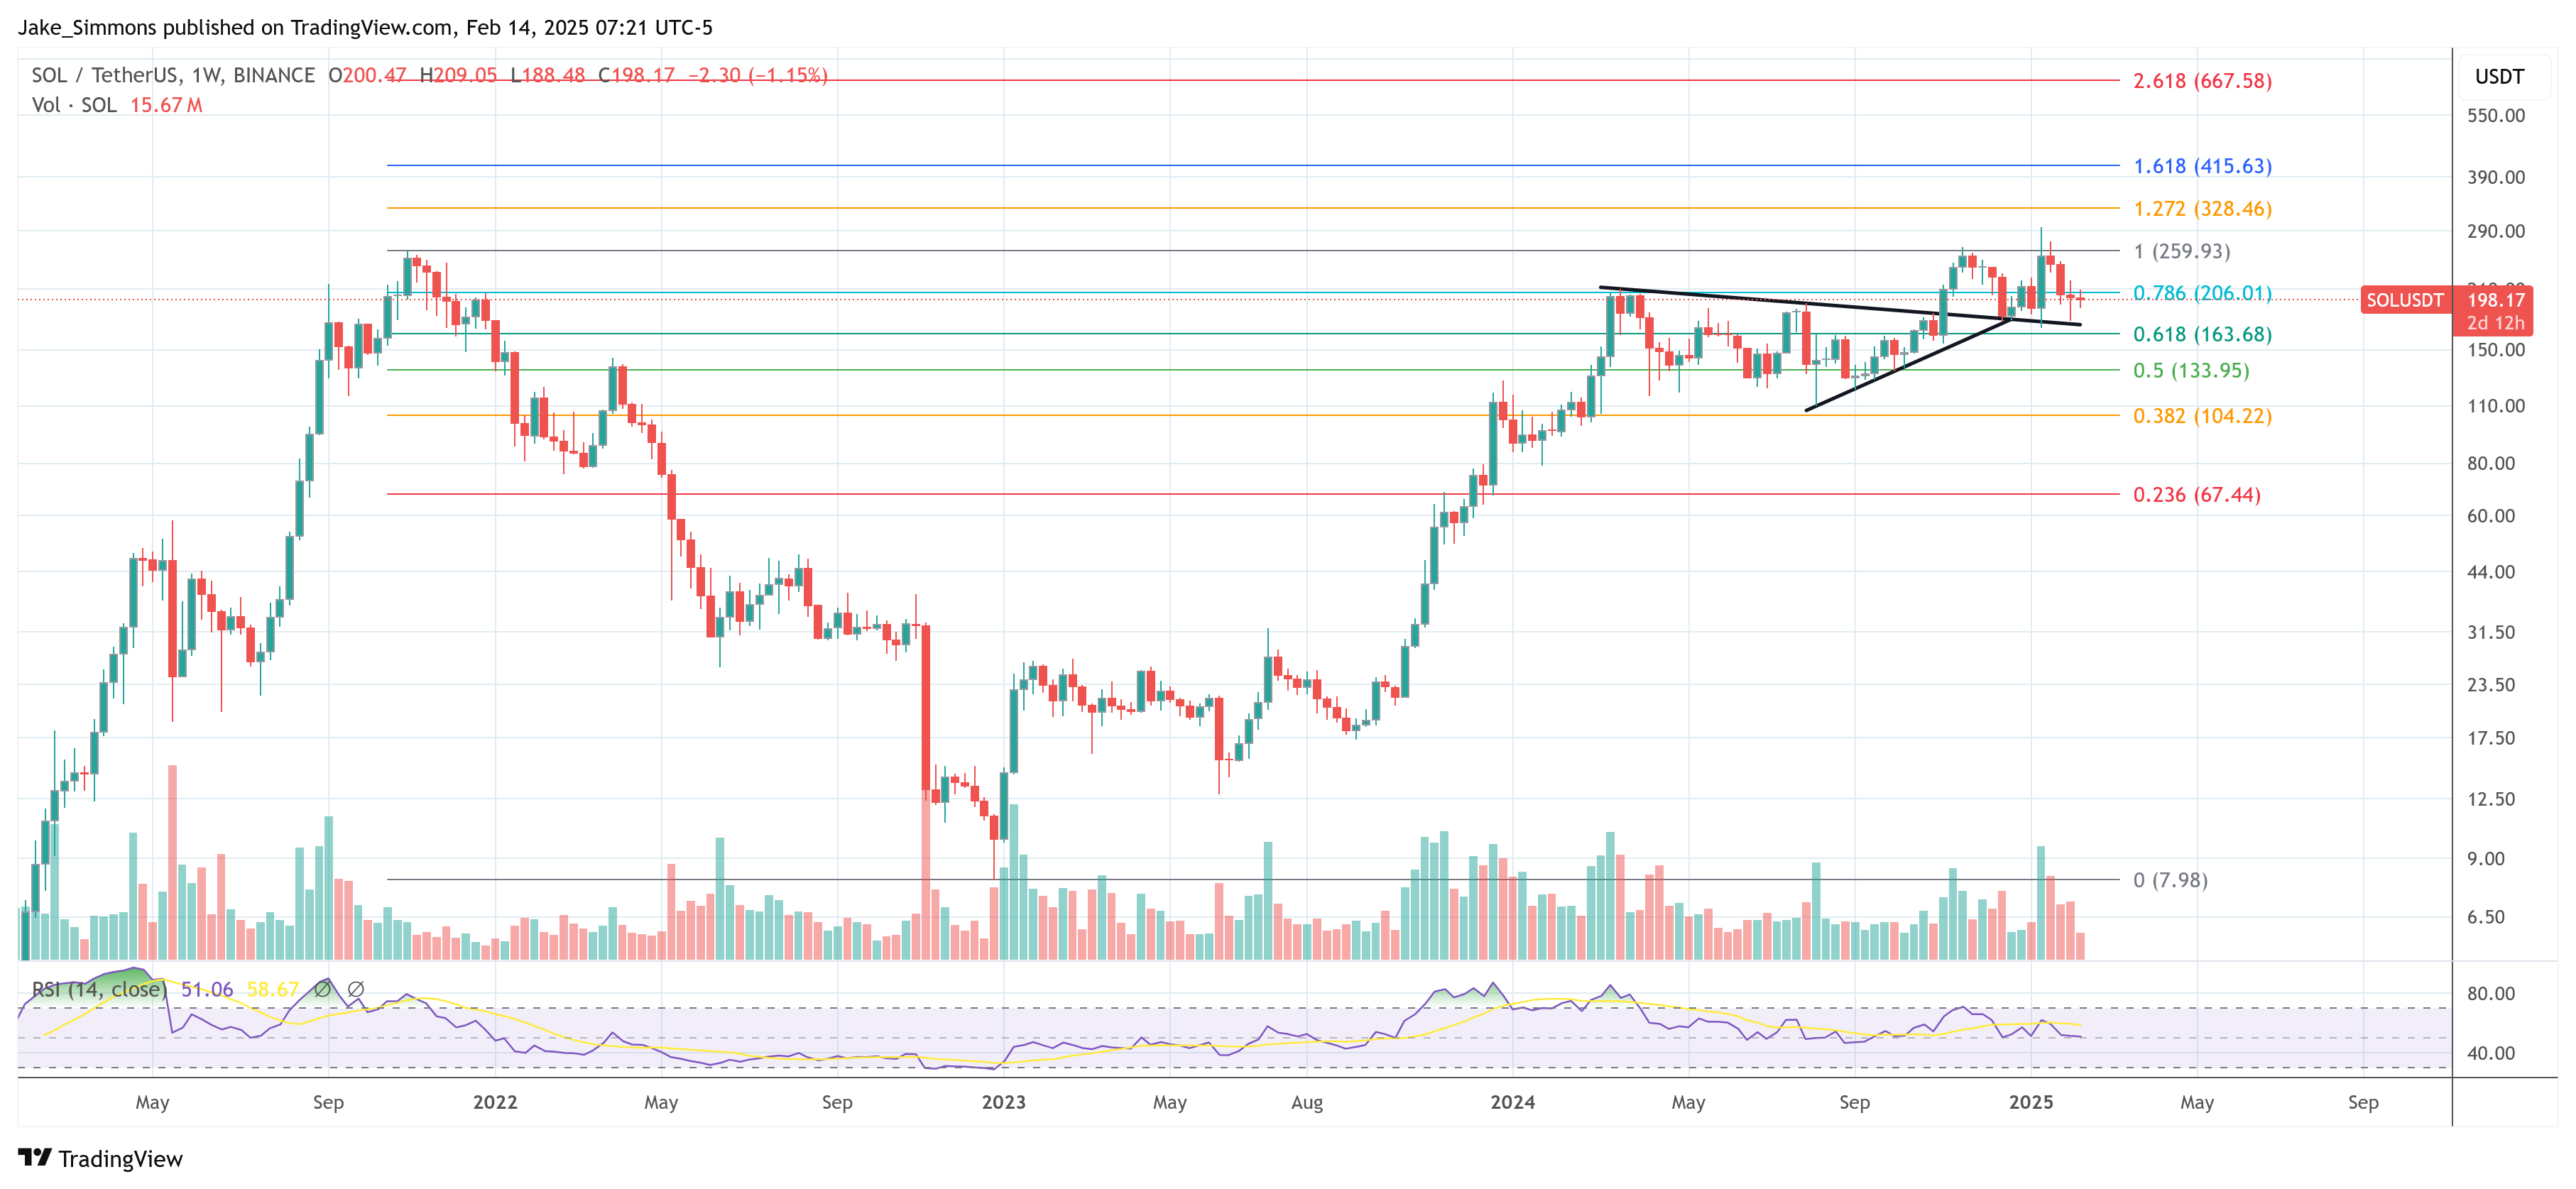
At press time, SOL traded at $198.
Recommended Articles


