

Ethereum Price Forecast: ETH eyes rally as Vitalik Buterin unveils The Splurge
Ethereum price today: $2,670
- Ethereum could be set for a bullish future following Vitalik Buterin's latest blog post series.
- The six-part blog post outlines an ambitious roadmap of how Ethereum will overcome current challenges.
- Ethereum could flip $2,817 resistance into support after bouncing off key trendline.
Ethereum (ETH) is up over 7% on Tuesday and is showing signs of reclaiming the $2,817 key price level. The price growth comes despite criticism of ETH's underperformance and co-founder Vitalik Buterin's six-part blog post response detailing Ethereum's potential bullish future.
Ethereum's Buterin releases the sixth issue of the roadmap blog post series
Ethereum is increasingly facing criticism from crypto community members for its underperformance compared to Bitcoin and Solana in the current market cycle. While Bitcoin and Solana are about 3% and 31% off their all-time highs, Ethereum lags, down nearly 50% from its all-time high of $4,878.
Despite the underperformance, Ethereum co-founder Vitalik Buterin's sixth issue in a blog post series that began earlier in October hints at a bullish future for the top Layer 1. In the blog post titled The Splurge, Buterin highlighted four key goals for this stage of the Ethereum roadmap:
- Bring the EVM (Ethereum Virtual Machine) to a performant and stable "endgame state."
- Bring account abstraction in-protocol, allowing all users to benefit from much more secure and convenient accounts.
- Optimize transaction fee economics, increasing scalability while reducing risks.
- Explore advanced cryptography that could make Ethereum far better in the long run.
The six-part blog post series outlined an ambitious roadmap detailing how Ethereum will overcome its current challenges, touting them as The Merge, The Surge, The Scourge, The Verge, The Purge and The Splurge.
Vitalik just laid out the Ethereum roadmap through 6 detailed blog posts. This remains the most ambitious and powerful roadmap in crypto.
— RYAN SΞAN ADAMS - rsa.eth (@RyanSAdams) October 29, 2024
I want this for the world.
I believe it will happen.
I am bullish ETH.
The destination is clear. pic.twitter.com/Dp2SmjGgOS
Other key goals in the preceding five issues include improving staking viability for solo stakers, reducing 51% attack risks on Ethereum, 100,000 TPS on L1+L2, minimizing the risk of excessive value extraction from users, L2s inheriting Ethereum's core properties, stateless clients, reducing client storage requirements, etc.
Meanwhile, Ethereum staking yields have also lagged other top staking-based protocols, per Kaiko Research.
"Currently, the ETH staking yield is lower than those offered by other major Layer 1 protocols such as Cosmos, Polkadot, Celestia, and Solana, where rewards range between 7% and 21%," noted Kaiko analyst.
In other news, US Ethereum exchange-traded funds (ETFs) posted net outflows of $1.10 million on Monday, per Coinglass data.
Ethereum Price Forecast: ETH sets sight on $2,817 key level
Ethereum trades around $2,670, up 7% on the day following $36.32 million in liquidations — with long and short liquidations accounting for $5.63 million and $30.69 million, respectively, per Coinglass data.
The top altcoin is trading within a key rectangular channel with resistance and support levels at $2,817 and $2,258, respectively.
ETH could flip the $2,817 resistance into a support level after bouncing off a key descending trendline extending from May 27. Such a move could trigger an ETH rally above the $3,000 psychological level toward the resistance at $3,237.
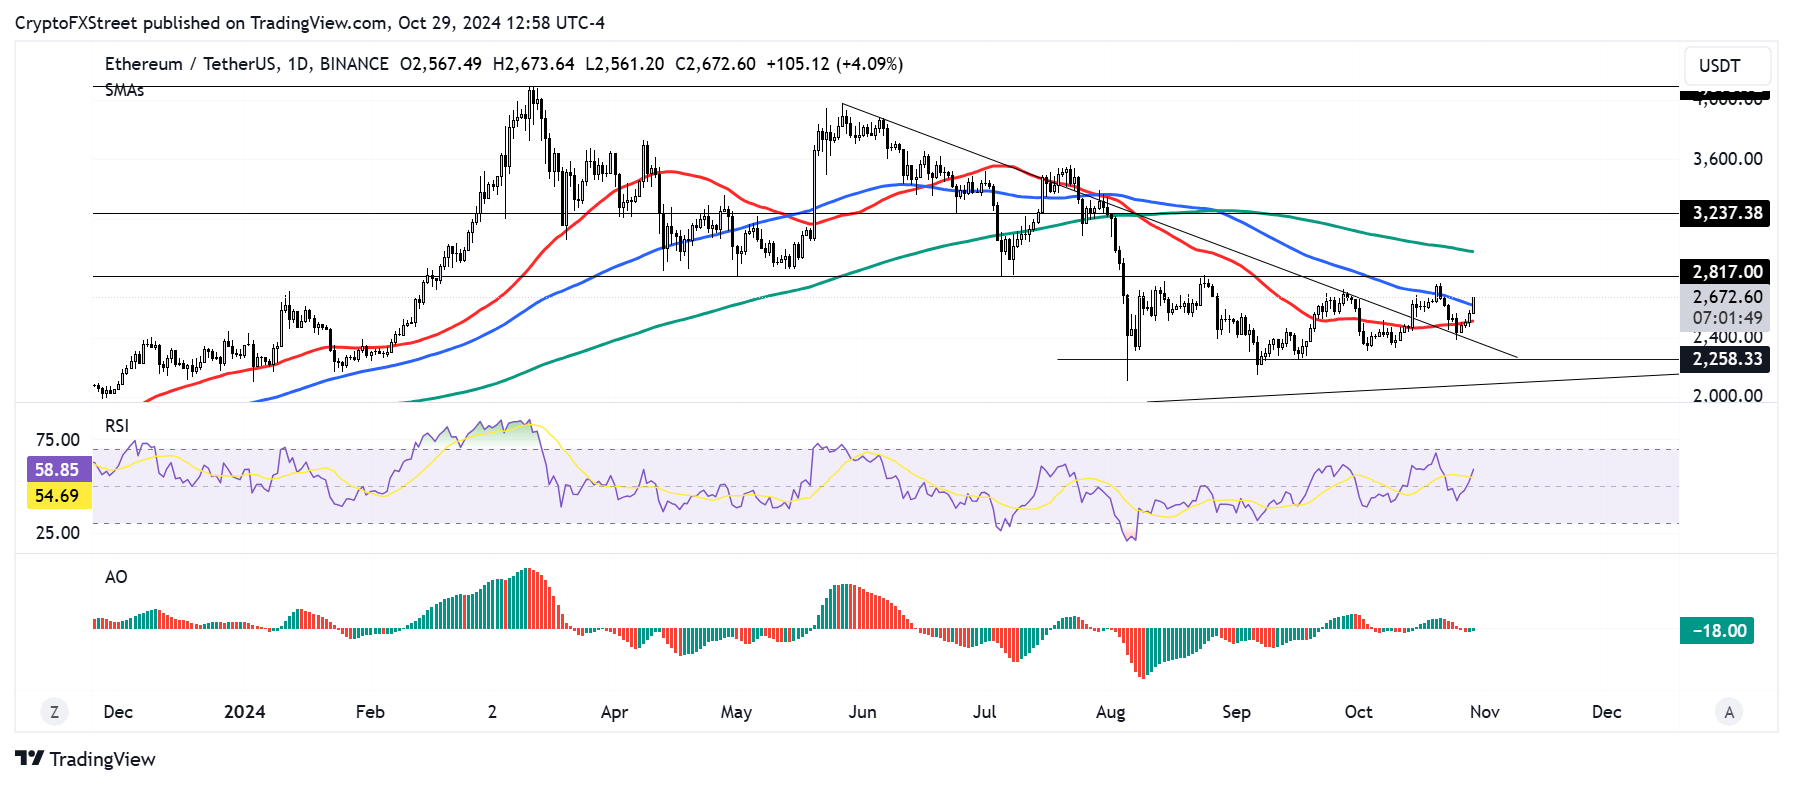
ETH/USDT daily chart
However, to increase the likelihood of a rally, ETH must maintain an extended move above the 100-day and 50-day Simple Moving Averages (SMA).
The Relative Strength Index (RSI) indicator is above its midline and has crossed above its SMA, indicating a potential bullish move.
The Awesome Oscillator is below its midline but has posted consecutive green bars after a series of red bars. This indicates that the tide is shifting in favor of bullish traders.
A daily candlestick close below the descending trendline extending from May 27 will invalidate the bullish thesis.
Ethereum FAQs
Ethereum is a decentralized open-source blockchain with smart contracts functionality. Its native currency Ether (ETH), is the second-largest cryptocurrency and number one altcoin by market capitalization. The Ethereum network is tailored for building crypto solutions like decentralized finance (DeFi), GameFi, non-fungible tokens (NFTs), decentralized autonomous organizations (DAOs), etc.
Ethereum is a public decentralized blockchain technology, where developers can build and deploy applications that function without the need for a central authority. To make this easier, the network leverages the Solidity programming language and Ethereum virtual machine which helps developers create and launch applications with smart contract functionality.
Smart contracts are publicly verifiable codes that automates agreements between two or more parties. Basically, these codes self-execute encoded actions when predetermined conditions are met.
Staking is a process of earning yield on your idle crypto assets by locking them in a crypto protocol for a specified duration as a means of contributing to its security. Ethereum transitioned from a Proof-of-Work (PoW) to a Proof-of-Stake (PoS) consensus mechanism on September 15, 2022, in an event christened “The Merge.” The Merge was a key part of Ethereum's roadmap to achieve high-level scalability, decentralization and security while remaining sustainable. Unlike PoW, which requires the use of expensive hardware, PoS reduces the barrier of entry for validators by leveraging the use of crypto tokens as the core foundation of its consensus process.
Gas is the unit for measuring transaction fees that users pay for conducting transactions on Ethereum. During periods of network congestion, gas can be extremely high, causing validators to prioritize transactions based on their fees.
Recommended Articles


