


Ethereum Price Forecast: ETH fails to recover $1,800 after futures and spot distribution
Ethereum price today: $1,750
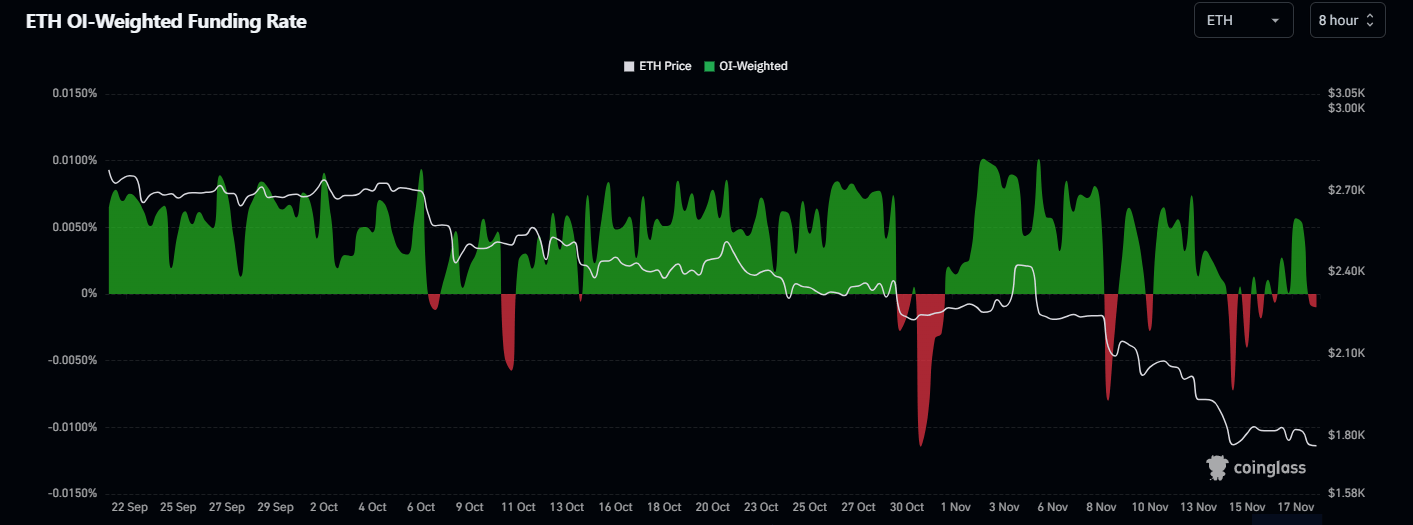
- Ethereum futures is dominated by sellers as funding rates flipped negative again.
- Spot traders are also contributing to the selling with volume expanding as prices declined.
- ETH remains restricted by the $1,827 hurdle.
Ethereum (ETH) remained below $1,800 on Wednesday, down more than 2% as sellers wrestled control over its derivatives markets.
Funding rates in ETH perpetuals flipped negative over the past few hours, indicating short traders have regained temporary dominance. The metric has posted several negative flashes since October, as ETH declined, suggesting futures sellers participated as prices fell.
Funding rates are periodic payments between traders in perpetual futures markets to keep a contract's price anchored to its underlying spot counterpart. Long traders pay short traders when funding is positive and vice versa when the metric is negative.
The seller dominance is more evident in the Futures Taker Cumulative Volume Delta on crypto exchange Binance, which tracks the net difference between aggressive buying and aggressive selling over time. For ETH futures, the latest CVD reading is at -$214 million, while the 90-day CVD has dropped from $1.253 billion in September to -$9.125 billion on Tuesday, its lowest level since February. The move shows that aggressive market selling has accumulated rather than been fully absorbed by aggressive buyers.
-1795035251571.png)
Spot traders joined in the selling
The sell-off wasn't limited to derivatives markets. As prices declined, ETH spot volume expanded from roughly 0.16 million to 0.38 million ETH earlier in October to over 1.00 million ETH, with the largest recent session reaching roughly 1.13 million and 1.00 million ETH, indicating the recent move involved high-participation selling.
US spot ETH exchange-traded funds (ETFs) played a key role, with seven consecutive weeks of net outflows, per SoSoValue data. Last week, the products recorded net withdrawals of $398.85 million.
Meanwhile, digital asset manager CoinShares said in its Q3 earnings report that it sold its entire ETH treasury for $16.6 million in the third quarter to support a share buyback program.
Ethereum technical outlook: ETH remains restricted by $1,827 hurdle
Ethereum saw $84.9 million in liquidations over the past 24 hours, led by $60.2 million in long liquidations, according to Coinglass data.
On the daily chart, ETH is extending a bearish phase with prices firmly below the 20-day, 50-day and 100-day Exponential Moving Averages (EMAs) at $2,041, $2,224 and $2,263, respectively. This configuration suggests sellers retain control despite deeply oversold conditions, with the 14-day Relative Strength Index (RSI) near 23 and the Stochastic Oscillator (Stoch) at 5, hinting that downside momentum is stretched but not yet reversed.
On the topside, initial resistance emerges at $1,827, followed by $1,971, ahead of the 20-day EMA and the $2,101 hurdle. Higher up, a dense cap forms at $2,204, the 50-day and 100-day EMAs, followed by the $2,250 horizontal level, before the stronger barrier at $2,355 and overhead levels toward $2,548 and beyond.
On the downside, immediate support is seen at $1,706. A clear break below would expose $1,603 and then $1,512, where dip buyers may attempt to steady the decline.
(The technical analysis of this story was written with the help of an AI tool. Know more.)
Recommended Articles


