

Pi Network Price Forecast: PI rebound loses steam ahead of critical resistance trendline

Source Fxstreet
  • Pi Network hovers around $0.0700 on Thursday, consolidating after Tuesday’s 8% rebound.
  • Over 590 million PI have flown from OKX’s exchange wallet to the GASW wallet this week, reducing available selling pressure.
  • The technical outlook for PI remains bearish, as the price is capped below a long-term descending trendline near $0.0730.

Pi Network (PI) price is holding steady around $0.0700 at press time on Thursday, consolidating around the round figure after Tuesday’s 8% rebound. The rebound coincided with a massive outflow of more than 590 million PI tokens from the OKX exchange wallet, suggesting reduced downside pressure. Technically, the PI remains capped below a key trendline around $0.0730, maintaining a bearish bias.

OKX exchange PI wallet drain

The OKX exchange wallet holding PI saw a massive withdrawal of 593 million tokens on Tuesday, reducing the amount of supply available for sale. This outflow increases the Pi concentration among non-selling holders, projecting long-term upside potential.
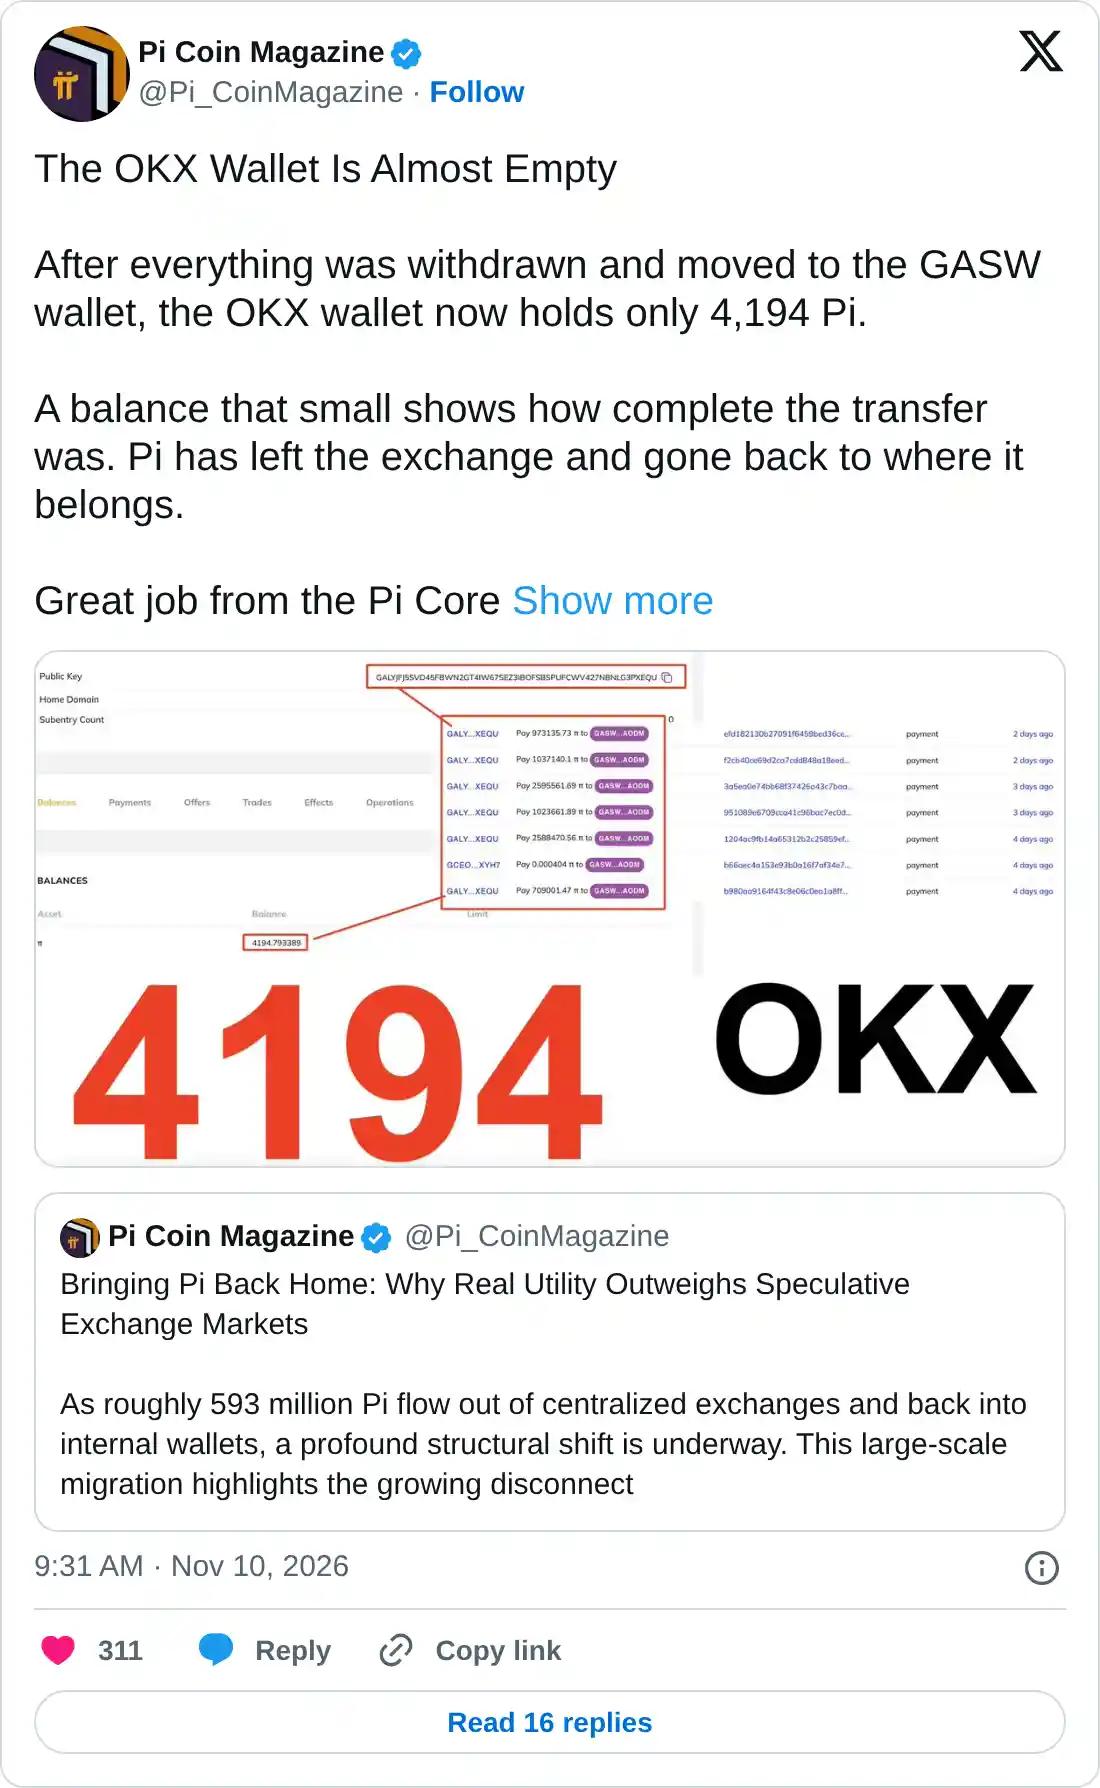
https://x.com/Pi_CoinMagazine/status/2120087046911860883

Technical outlook: Will PI extend gains for a breakout rally?

Pi Network trades at $0.0702 at press time on Thursday, extending its bearish tone below a capped resistance around $0.0730. The PI token is also trading below both the 50-day Exponential Moving Average (EMA) at $0.0792 and the 200-day EMA at $0.1097.

Momentum remains soft on the daily chart, with the Relative Strength Index (RSI) hovering around 36 and the Moving Average Convergence Divergence (MACD) below zero, suggesting lingering downside pressure.

On the topside, the immediate resistance aligns with a rising trendline around $0.0730, reinforced by the 50-day EMA at $0.0792. Further up, medium-term resistance is layered at the 50% retracement of the downswing from $0.1394 to $0.0704, at $0.1049, and at the 200-day EMA at $0.1097.

Chart Analysis PI/USD (baha Crypto)
PI/USD daily price chart.

Looking down, if PI extends below the descending trendline, the 127.2% Fibonacci extension level at $0.0516 could serve as a base for buyers to step in.

(The technical analysis of this story was written with the help of an AI tool. Know more.)

Disclaimer: For information purposes only. Past performance is not indicative of future results.
placeholder
China's factories are pricing in 5.7%. Its shoppers are pricing in 0.7%.China's October PPI rose 5.7% year on year, the fastest since June 2022, while CPI slowed to 0.7% and core CPI to 0.8%. Input prices rose faster than factory-gate prices, squeezing mid-stream margins by roughly five percentage points. The Hang Seng fell 0.13% on a day the S&P 500 rose 2.35%, the only major market to sit out the risk-on session.
Author  Irene Q.
Nov 10, Tue
China's October PPI rose 5.7% year on year, the fastest since June 2022, while CPI slowed to 0.7% and core CPI to 0.8%. Input prices rose faster than factory-gate prices, squeezing mid-stream margins by roughly five percentage points. The Hang Seng fell 0.13% on a day the S&P 500 rose 2.35%, the only major market to sit out the risk-on session.
placeholder
Gold Price Analysis Today | Forex Gold Analysis | XAU/USD Analysis - November 11, 2026Get the latest gold price analysis, forex gold insights, and XAU/USD analysis for November 11, 2026. Read on for the details.
Author  Mitrade
Nov 11, Wed
Get the latest gold price analysis, forex gold insights, and XAU/USD analysis for November 11, 2026. Read on for the details.
placeholder
Gold Extends Slide Below $4,000 as Rising US Inflation, Fed December Hike Bets Pressure Prices On November 12, gold prices (XAUUSD) extended their recent losses, falling further below $4,000 in early Asian trading to hit an intraday low near $3,968, marking a third consecutive day
Author  TradingKey
Yesterday 02: 00
On November 12, gold prices (XAUUSD) extended their recent losses, falling further below $4,000 in early Asian trading to hit an intraday low near $3,968, marking a third consecutive day
placeholder
Gold closed below $4,000 again — the ETF crowd and central banks stayed, the momentum money leftSpot gold is trading near $3,999, its third consecutive lower daily low, after a 5.00% 10-year yield and a 102.85 dollar index raised the odds of a December hike to 87%. But the selling is not coming from the strategic holders: managed-money net longs fell to 324 tonnes, a 21-week low, and Goldman Sachs attributes roughly 95% of five weeks of selling to non-reportable positions. ETFs still hold a record 4,256 tonnes and central banks bought 321 tonnes in Q3. The table below sets the triggers, directions and levels.
Author  Irene Q.
Yesterday 03: 20
Spot gold is trading near $3,999, its third consecutive lower daily low, after a 5.00% 10-year yield and a 102.85 dollar index raised the odds of a December hike to 87%. But the selling is not coming from the strategic holders: managed-money net longs fell to 324 tonnes, a 21-week low, and Goldman Sachs attributes roughly 95% of five weeks of selling to non-reportable positions. ETFs still hold a record 4,256 tonnes and central banks bought 321 tonnes in Q3. The table below sets the triggers, directions and levels.
placeholder
US October PPI Preview: Fed Rate Hike Expectations Rise, PPI May Be Key Variable; How Will US Stocks, Dollar, and Gold Move?On Friday (Nov. 13) Eastern Time, the U.S. will release the October Producer Price Index (PPI). Following the October CPI once again exceeding expectations, the market will look to the PP
Author  TradingKey
Yesterday 08: 36
On Friday (Nov. 13) Eastern Time, the U.S. will release the October Producer Price Index (PPI). Following the October CPI once again exceeding expectations, the market will look to the PP
goTop
quote