

Bitcoin Price Forecast: Hotter-Than-Expected US Inflation Drags BTC Below $74,000 as Bulls Eye $73,000 Support

Source Tradingkey

TradingKey - On Thursday (November 12), Bitcoin (BTC) continued its recent downward trend. As of today's European trading session, Bitcoin fell below $74,000 intraday, with the latest price trading near $73,600. From a fundamental perspective, rising Federal Reserve rate-hike expectations and persistent ETF capital outflows are the two primary headwinds driving Bitcoin's recent decline.

The latest U.S. October CPI rose 0.4% month-over-month, exceeding market expectations of 0.3%, while core CPI climbed 0.3% month-over-month, also topping the expected 0.2%. Persistent inflationary pressures have further cemented market expectations of a Federal Reserve rate hike in December. Currently, the market prices in approximately an 87% probability of a 25-basis-point rate hike in December and about a 13% probability of a 50-basis-point hike. Meanwhile, the U.S. Dollar Index climbed to around 103. A stronger dollar and rising U.S. Treasury yields have enhanced the relative appeal of holding dollar- and bond-denominated assets, putting pressure on risk assets such as Bitcoin.

In terms of fund flows, U.S. spot Bitcoin ETFs continued to face redemptions. According to CoinGlass data, U.S. spot Bitcoin ETFs logged net outflows of $299.8 million on November 11, up from $95 million in the prior trading session. Among them, BlackRock's IBIT recorded net outflows of $269.7 million. Since November 5, spot Bitcoin ETFs have seen cumulative net outflows of over $1.4 billion, indicating that investor demand for allocating to Bitcoin via ETFs remains weak recently.
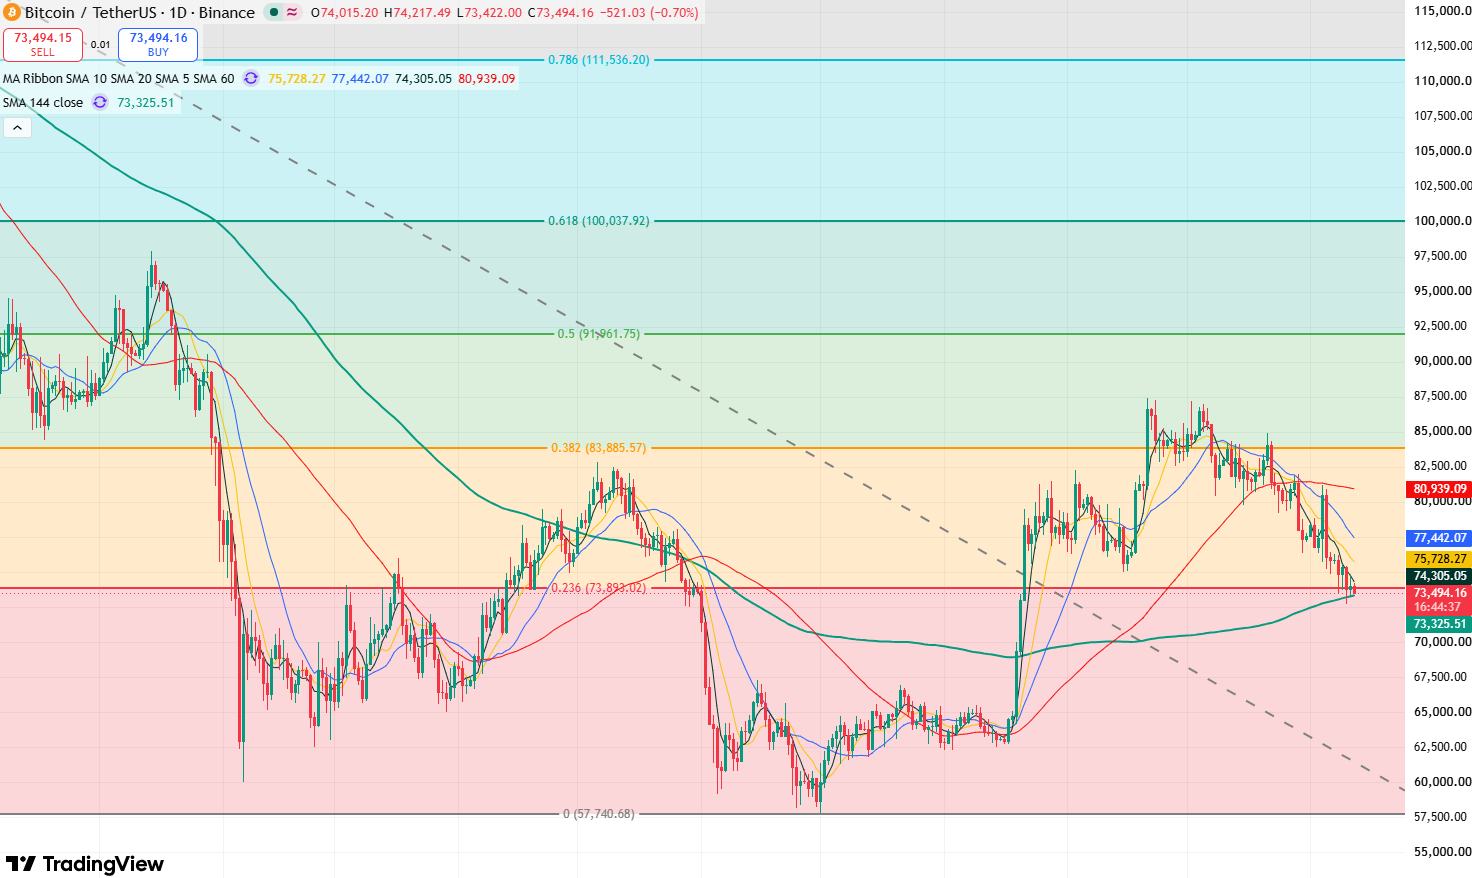
btc-e35f5f1fe40e4285b2159b1338f988f7

Bitcoin daily price chart, Source: TradingView

From Bitcoin's daily chart, Bitcoin has continued to decline recently, with candlestick highs and lows steadily moving lower. Following the breakdown below the September 15 low of $74,967, Bitcoin's recent candlestick structure has weakened noticeably, with bearish momentum clearly dominating the market.

In terms of technical indicators, the Relative Strength Index (RSI) sits near 33.9 and has not yet entered oversold territory, indicating that the likelihood of further near-term downside remains significant. Meanwhile, the MACD continues to linger in negative territory, showing that downward momentum has not yet fully dissipated.

Currently, Bitcoin has retreated to near its 144-day moving average ($73,000), which also coincides with the 0.236 Fibonacci retracement level, potentially creating a confluence of support. If Bitcoin can hold firmly above $73,000 in the near term, it is poised for a short-term technical corrective rebound. The initial target of the rebound would be to test resistance at $75,000; a breakout above this level would see it further test resistance at $77,000.

Conversely, if Bitcoin breaks below $73,000, it will open up room for a deeper decline, with the primary downside target to watch being the $70,000 mark. If this level is lost, Bitcoin will slide further toward $67,000.

Disclaimer: For information purposes only. Past performance is not indicative of future results.
placeholder
China's factories are pricing in 5.7%. Its shoppers are pricing in 0.7%.China's October PPI rose 5.7% year on year, the fastest since June 2022, while CPI slowed to 0.7% and core CPI to 0.8%. Input prices rose faster than factory-gate prices, squeezing mid-stream margins by roughly five percentage points. The Hang Seng fell 0.13% on a day the S&P 500 rose 2.35%, the only major market to sit out the risk-on session.
Author  Irene Q.
Nov 10, Tue
China's October PPI rose 5.7% year on year, the fastest since June 2022, while CPI slowed to 0.7% and core CPI to 0.8%. Input prices rose faster than factory-gate prices, squeezing mid-stream margins by roughly five percentage points. The Hang Seng fell 0.13% on a day the S&P 500 rose 2.35%, the only major market to sit out the risk-on session.
placeholder
Gold Price Analysis Today | Forex Gold Analysis | XAU/USD Analysis - November 11, 2026Get the latest gold price analysis, forex gold insights, and XAU/USD analysis for November 11, 2026. Read on for the details.
Author  Mitrade
Nov 11, Wed
Get the latest gold price analysis, forex gold insights, and XAU/USD analysis for November 11, 2026. Read on for the details.
placeholder
Bitcoin lost its 200-day average — but the exit started three sessions before the CPIBitcoin fell 2.5% to about $73,400 on 11 November, an 11-week low, breaking its 200-day moving average near $73,100. The 24-hour liquidation tally reached $632 to $705 million, roughly 82% of it longs. But spot ETF outflows began three sessions earlier and USDT's market cap has shrunk $6.6 billion in 60 days — the leveraged length left before the inflation print did. A double top at 81,890 and 81,080 leaves a measured target of 69,366.
Author  Suzie
Nov 11, Wed
Bitcoin fell 2.5% to about $73,400 on 11 November, an 11-week low, breaking its 200-day moving average near $73,100. The 24-hour liquidation tally reached $632 to $705 million, roughly 82% of it longs. But spot ETF outflows began three sessions earlier and USDT's market cap has shrunk $6.6 billion in 60 days — the leveraged length left before the inflation print did. A double top at 81,890 and 81,080 leaves a measured target of 69,366.
placeholder
Gold Extends Slide Below $4,000 as Rising US Inflation, Fed December Hike Bets Pressure Prices On November 12, gold prices (XAUUSD) extended their recent losses, falling further below $4,000 in early Asian trading to hit an intraday low near $3,968, marking a third consecutive day
Author  TradingKey
Yesterday 02: 00
On November 12, gold prices (XAUUSD) extended their recent losses, falling further below $4,000 in early Asian trading to hit an intraday low near $3,968, marking a third consecutive day
placeholder
Gold closed below $4,000 again — the ETF crowd and central banks stayed, the momentum money leftSpot gold is trading near $3,999, its third consecutive lower daily low, after a 5.00% 10-year yield and a 102.85 dollar index raised the odds of a December hike to 87%. But the selling is not coming from the strategic holders: managed-money net longs fell to 324 tonnes, a 21-week low, and Goldman Sachs attributes roughly 95% of five weeks of selling to non-reportable positions. ETFs still hold a record 4,256 tonnes and central banks bought 321 tonnes in Q3. The table below sets the triggers, directions and levels.
Author  Irene Q.
Yesterday 03: 20
Spot gold is trading near $3,999, its third consecutive lower daily low, after a 5.00% 10-year yield and a 102.85 dollar index raised the odds of a December hike to 87%. But the selling is not coming from the strategic holders: managed-money net longs fell to 324 tonnes, a 21-week low, and Goldman Sachs attributes roughly 95% of five weeks of selling to non-reportable positions. ETFs still hold a record 4,256 tonnes and central banks bought 321 tonnes in Q3. The table below sets the triggers, directions and levels.
goTop
quote