


Ripple Price Forecast: XRP correction pauses, but recovery prospects remain limited
- XRP hovers above the critical $1.00 support level but faces diminishing recovery potential.
- Binance XRP futures Open Interest falls to $189 million, the lowest level in three months.
- XRP holds above the weekly SuperTrend support, offering bulls some short-term relief despite the broader bearish technical setup.
Ripple (XRP) trades around $1.06 on Wednesday, as its correction takes a breather, reflecting the broader cryptocurrency market calm after the storm sentiment. The remittance token sits above a solid support range from $0.94 to the current market price, while its upside is largely capped by structural hurdles, including major moving averages.
XRP Binance Open Interest falls to $189M
The XRP futures Open Interest (OI) on the Binance exchange has fallen to $189 million on Wednesday, the lowest level in three months, according to a report published on CryptoQuant. With August OI averaging $182 million on the same platform, risk-on sentiment has taken a hit.
Bybit's XRP open interest climbed to $255 million, up from $229 million on August 2, while OKX saw XRP derivatives volumes reach approximately $46 million as of November 11.
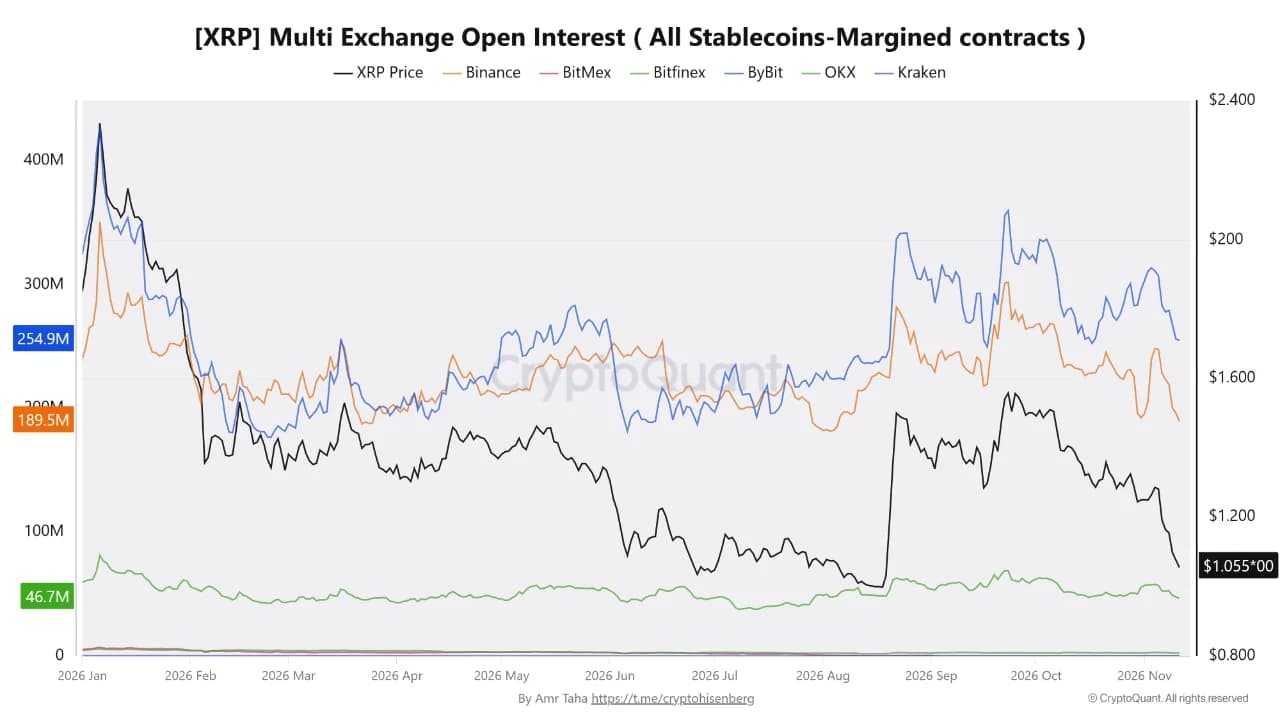
Aggregate open interest on Binance, Bybit, and OKX has climbed to around $490 million, with XRP trading near $1.06. This underscores the varied levels of derivatives exposure among leading exchanges, with Binance reverting to its early-August levels while Bybit continues to hold a comparatively larger outstanding position.
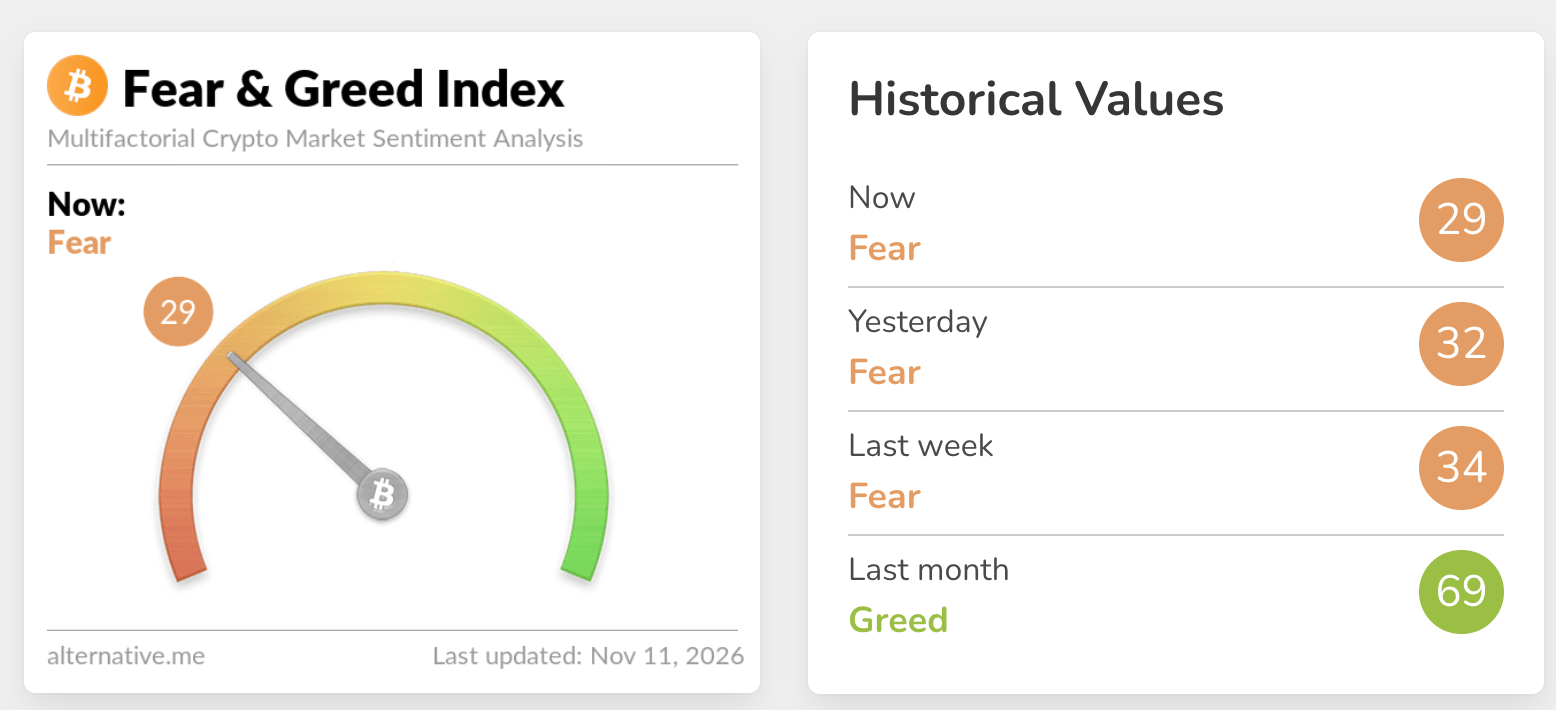
More broadly, subdued futures OI aligns with the Fear & Greed Index, which held at 29 in Fear territory on Wednesday, down slightly from 32 the previous day. Looking back, the index averaged 69 in the Greed territory last month, undermining diminishing investor appetite.
Technical analysis: XRP holds key support
XRP trades at $1.06, extending a clear bearish phase as price holds well below the 50-day, 100-day, and 200-day Exponential Moving Averages (EMAs), clustered between roughly $1.28 and $1.35. The SuperTrend indicator sits above the market at $1.22, reinforcing a dominant downside bias, while the Relative Strength Index (RSI) at about 24 slips further into oversold territory and the Moving Average Convergence Divergence (MACD) remains negative, both suggesting persistent but stretched bearish momentum.
Initial resistance lies at the SuperTrend barrier near $1.22, ahead of a dense EMA cluster where the 50-day EMA comes in at $1.28, and the nearby downward resistance trendline reference at $1.29 adds to selling pressure. Above, the 100-day EMA at $1.30 and the longer-term 200-day EMA at $1.35 form subsequent resistance layers that would need to be reclaimed to ease the prevailing bearish bias. The absence of clearly defined support levels below spot leaves the pair vulnerable to further downside exploration until fresh demand emerges.
The bearish tone continues on the weekly timeframe, with spot price well below the 50-week, 100-week and 200-week EMAs at $1.46, $1.55 and $1.37, respectively, which sit overhead as a broad cap, while a long-running descending trendline projected from prior cycle highs adds topside supply around $1.44.
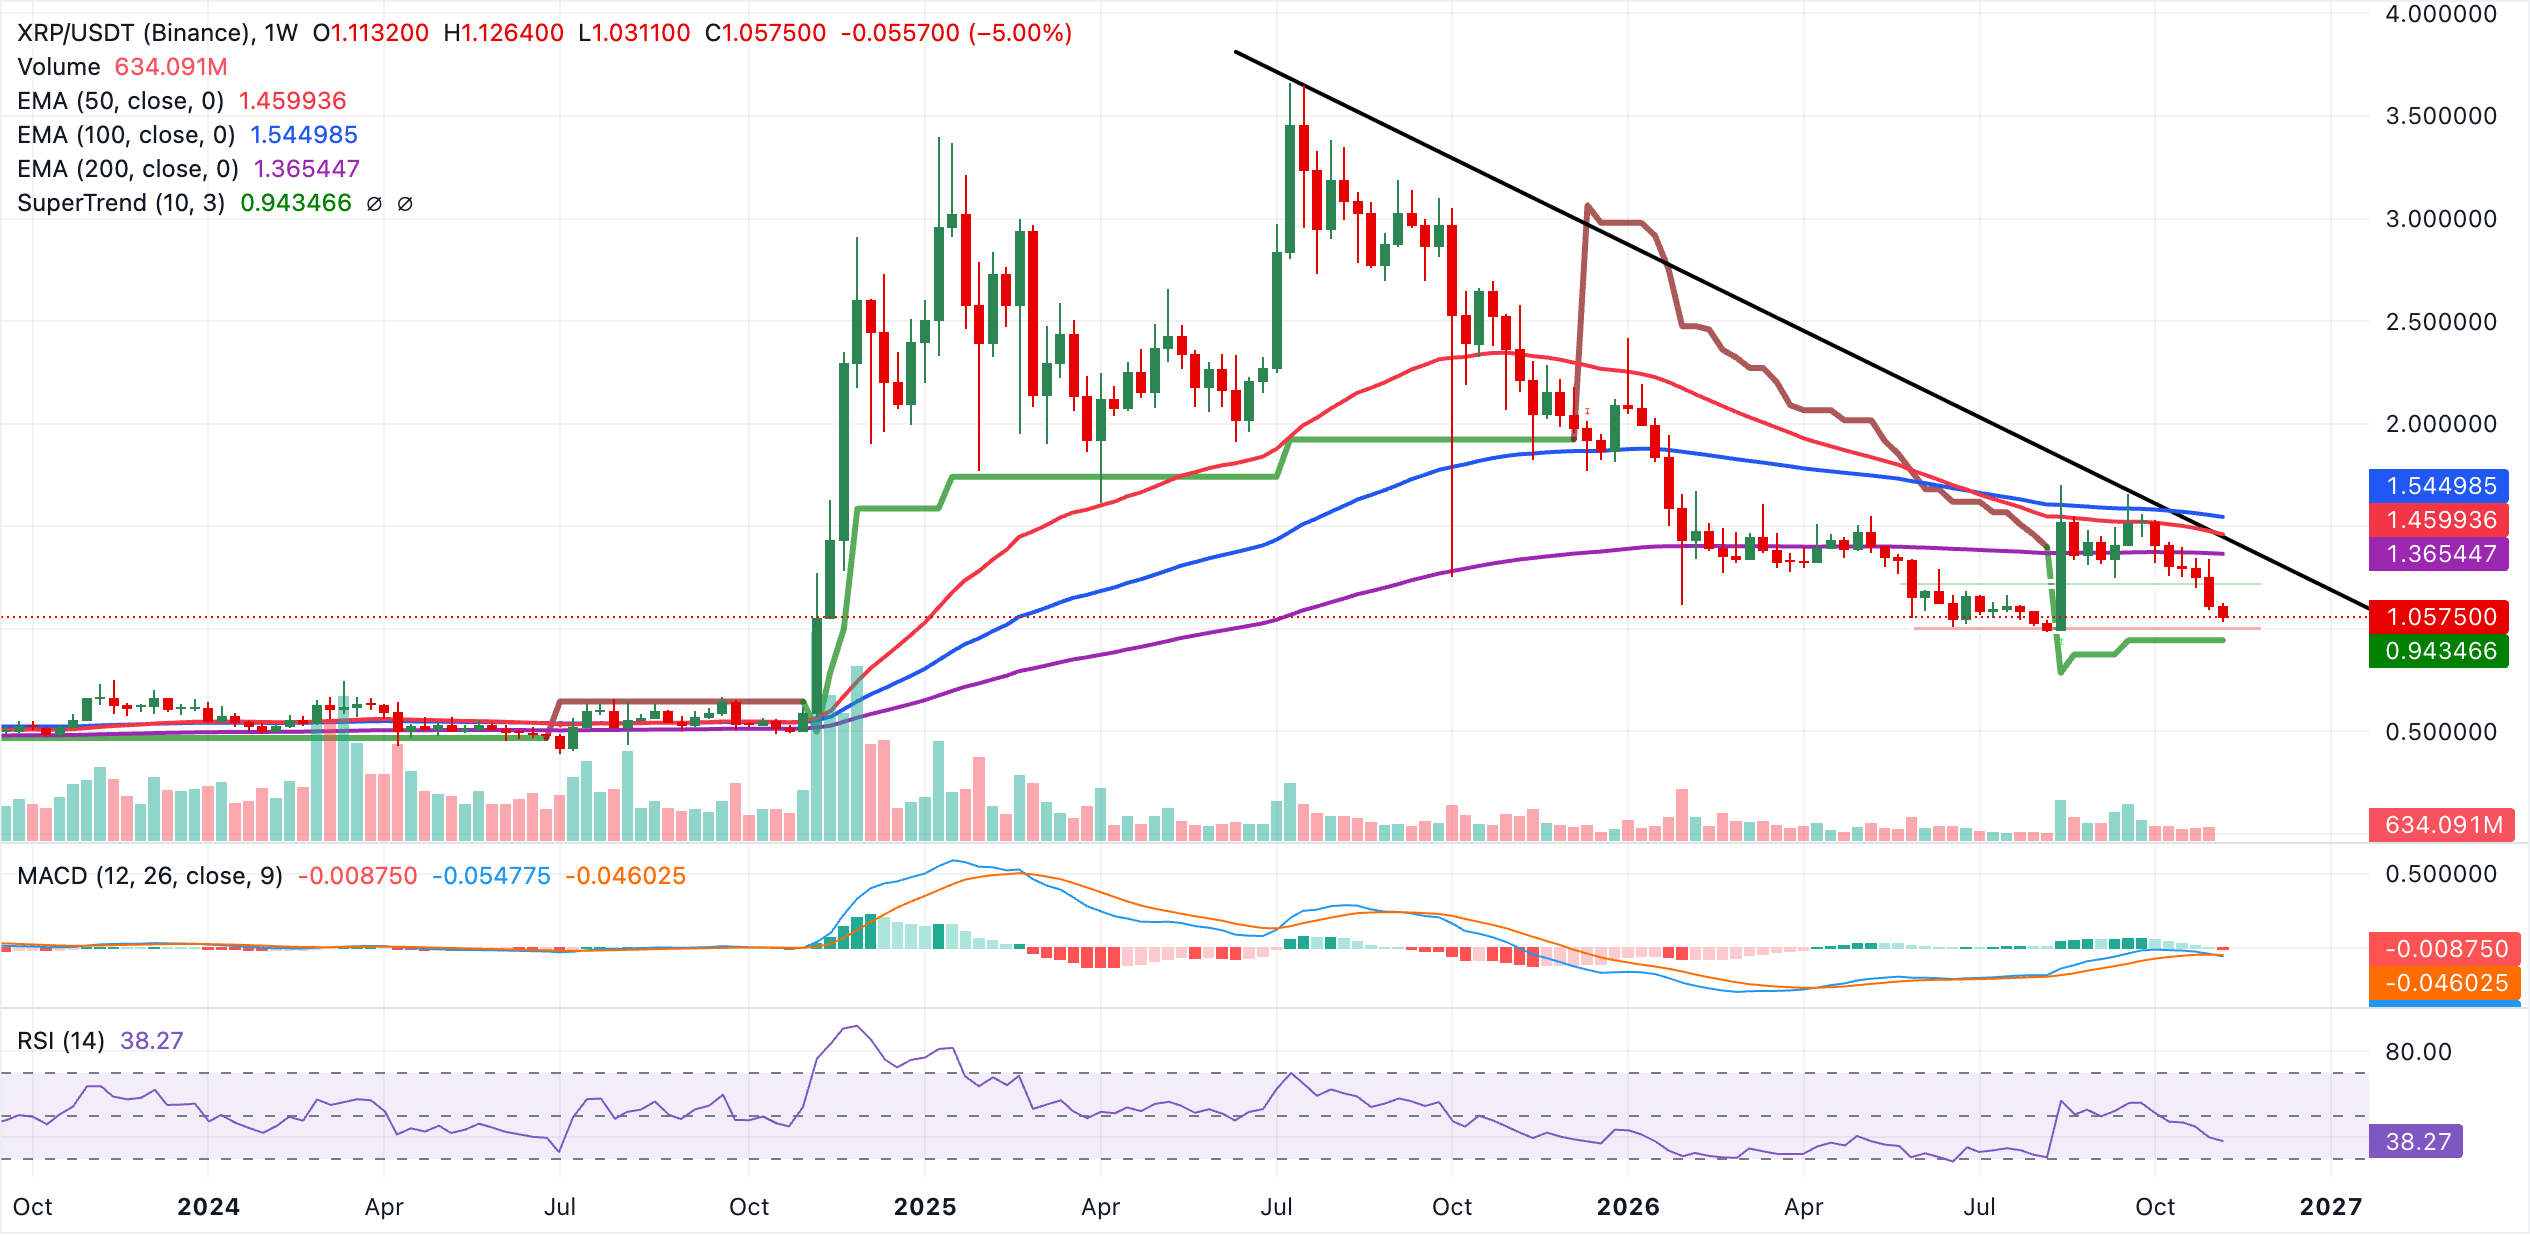
Initial technical support is offered by the weekly SuperTrend line around $0.94, which marks the first notable demand zone if sellers extend control. On the topside, a recovery would first need to challenge the 200-week EMA near $1.37, ahead of the descending trendline barrier around $1.44 sustained break above these would then expose the higher EMA cluster, with the 50-week EMA at $1.46 followed by the 100-week EMA near $1.55, acting as subsequent resistance layers that are likely to limit gains on initial tests.
(The technical analysis of this story was written with the help of an AI tool. Know more.)
Cryptocurrency metrics FAQs
The developer or creator of each cryptocurrency decides on the total number of tokens that can be minted or issued. Only a certain number of these assets can be minted by mining, staking or other mechanisms. This is defined by the algorithm of the underlying blockchain technology. On the other hand, circulating supply can also be decreased via actions such as burning tokens, or mistakenly sending assets to addresses of other incompatible blockchains.
Market capitalization is the result of multiplying the circulating supply of a certain asset by the asset’s current market value.
Trading volume refers to the total number of tokens for a specific asset that has been transacted or exchanged between buyers and sellers within set trading hours, for example, 24 hours. It is used to gauge market sentiment, this metric combines all volumes on centralized exchanges and decentralized exchanges. Increasing trading volume often denotes the demand for a certain asset as more people are buying and selling the cryptocurrency.
Funding rates are a concept designed to encourage traders to take positions and ensure perpetual contract prices match spot markets. It defines a mechanism by exchanges to ensure that future prices and index prices periodic payments regularly converge. When the funding rate is positive, the price of the perpetual contract is higher than the mark price. This means traders who are bullish and have opened long positions pay traders who are in short positions. On the other hand, a negative funding rate means perpetual prices are below the mark price, and hence traders with short positions pay traders who have opened long positions.
Recommended Articles


