

Pi Network Price Forecast: Post-US midterm elections market sell-off weighs on PI

Source Fxstreet
  • Pi Network hovers around $0.0750 on Friday, extending its prevailing downtrend capped by a long-term resistance trendline.
  • Total crypto market long liquidations exceeded $1 billion on Thursday as the post-election rally reversed amid a broader risk-off sell-off.
  • The technical outlook for PI remains bearish, with selling pressure persisting.

Pi Network (PI) continues to attract sellers, as the post-US midterm results triggered a sell-off in the US tech stock market and also wiped out over $1 billion from the crypto market. The declining trend in PI token risks forming a lower leg below its record low of $0.0704, with persistent selling pressure and faltering crypto market sentiment.

Post-US midterms weigh on the crypto market

The cryptocurrency market took a nosedive on Thursday, bleeding over $1 billion in long liquidations amid concerns that Democrats controlling the US Senate and House of Congress could lead to tighter crypto and AI regulations, as previously reported by FXStreet. In addition, CoinMarketCap’s Fear and Greed Index dropped to 31 on Friday, from 36 last week, suggesting persistent risk-off sentiment with a brief recovery on Tuesday, the day of midterm results. 

Typically, broader market uncertainty weighs down high-risk crypto assets, similar to PI. Investors looking for a relief rally might have to wait for political clarity in the US.
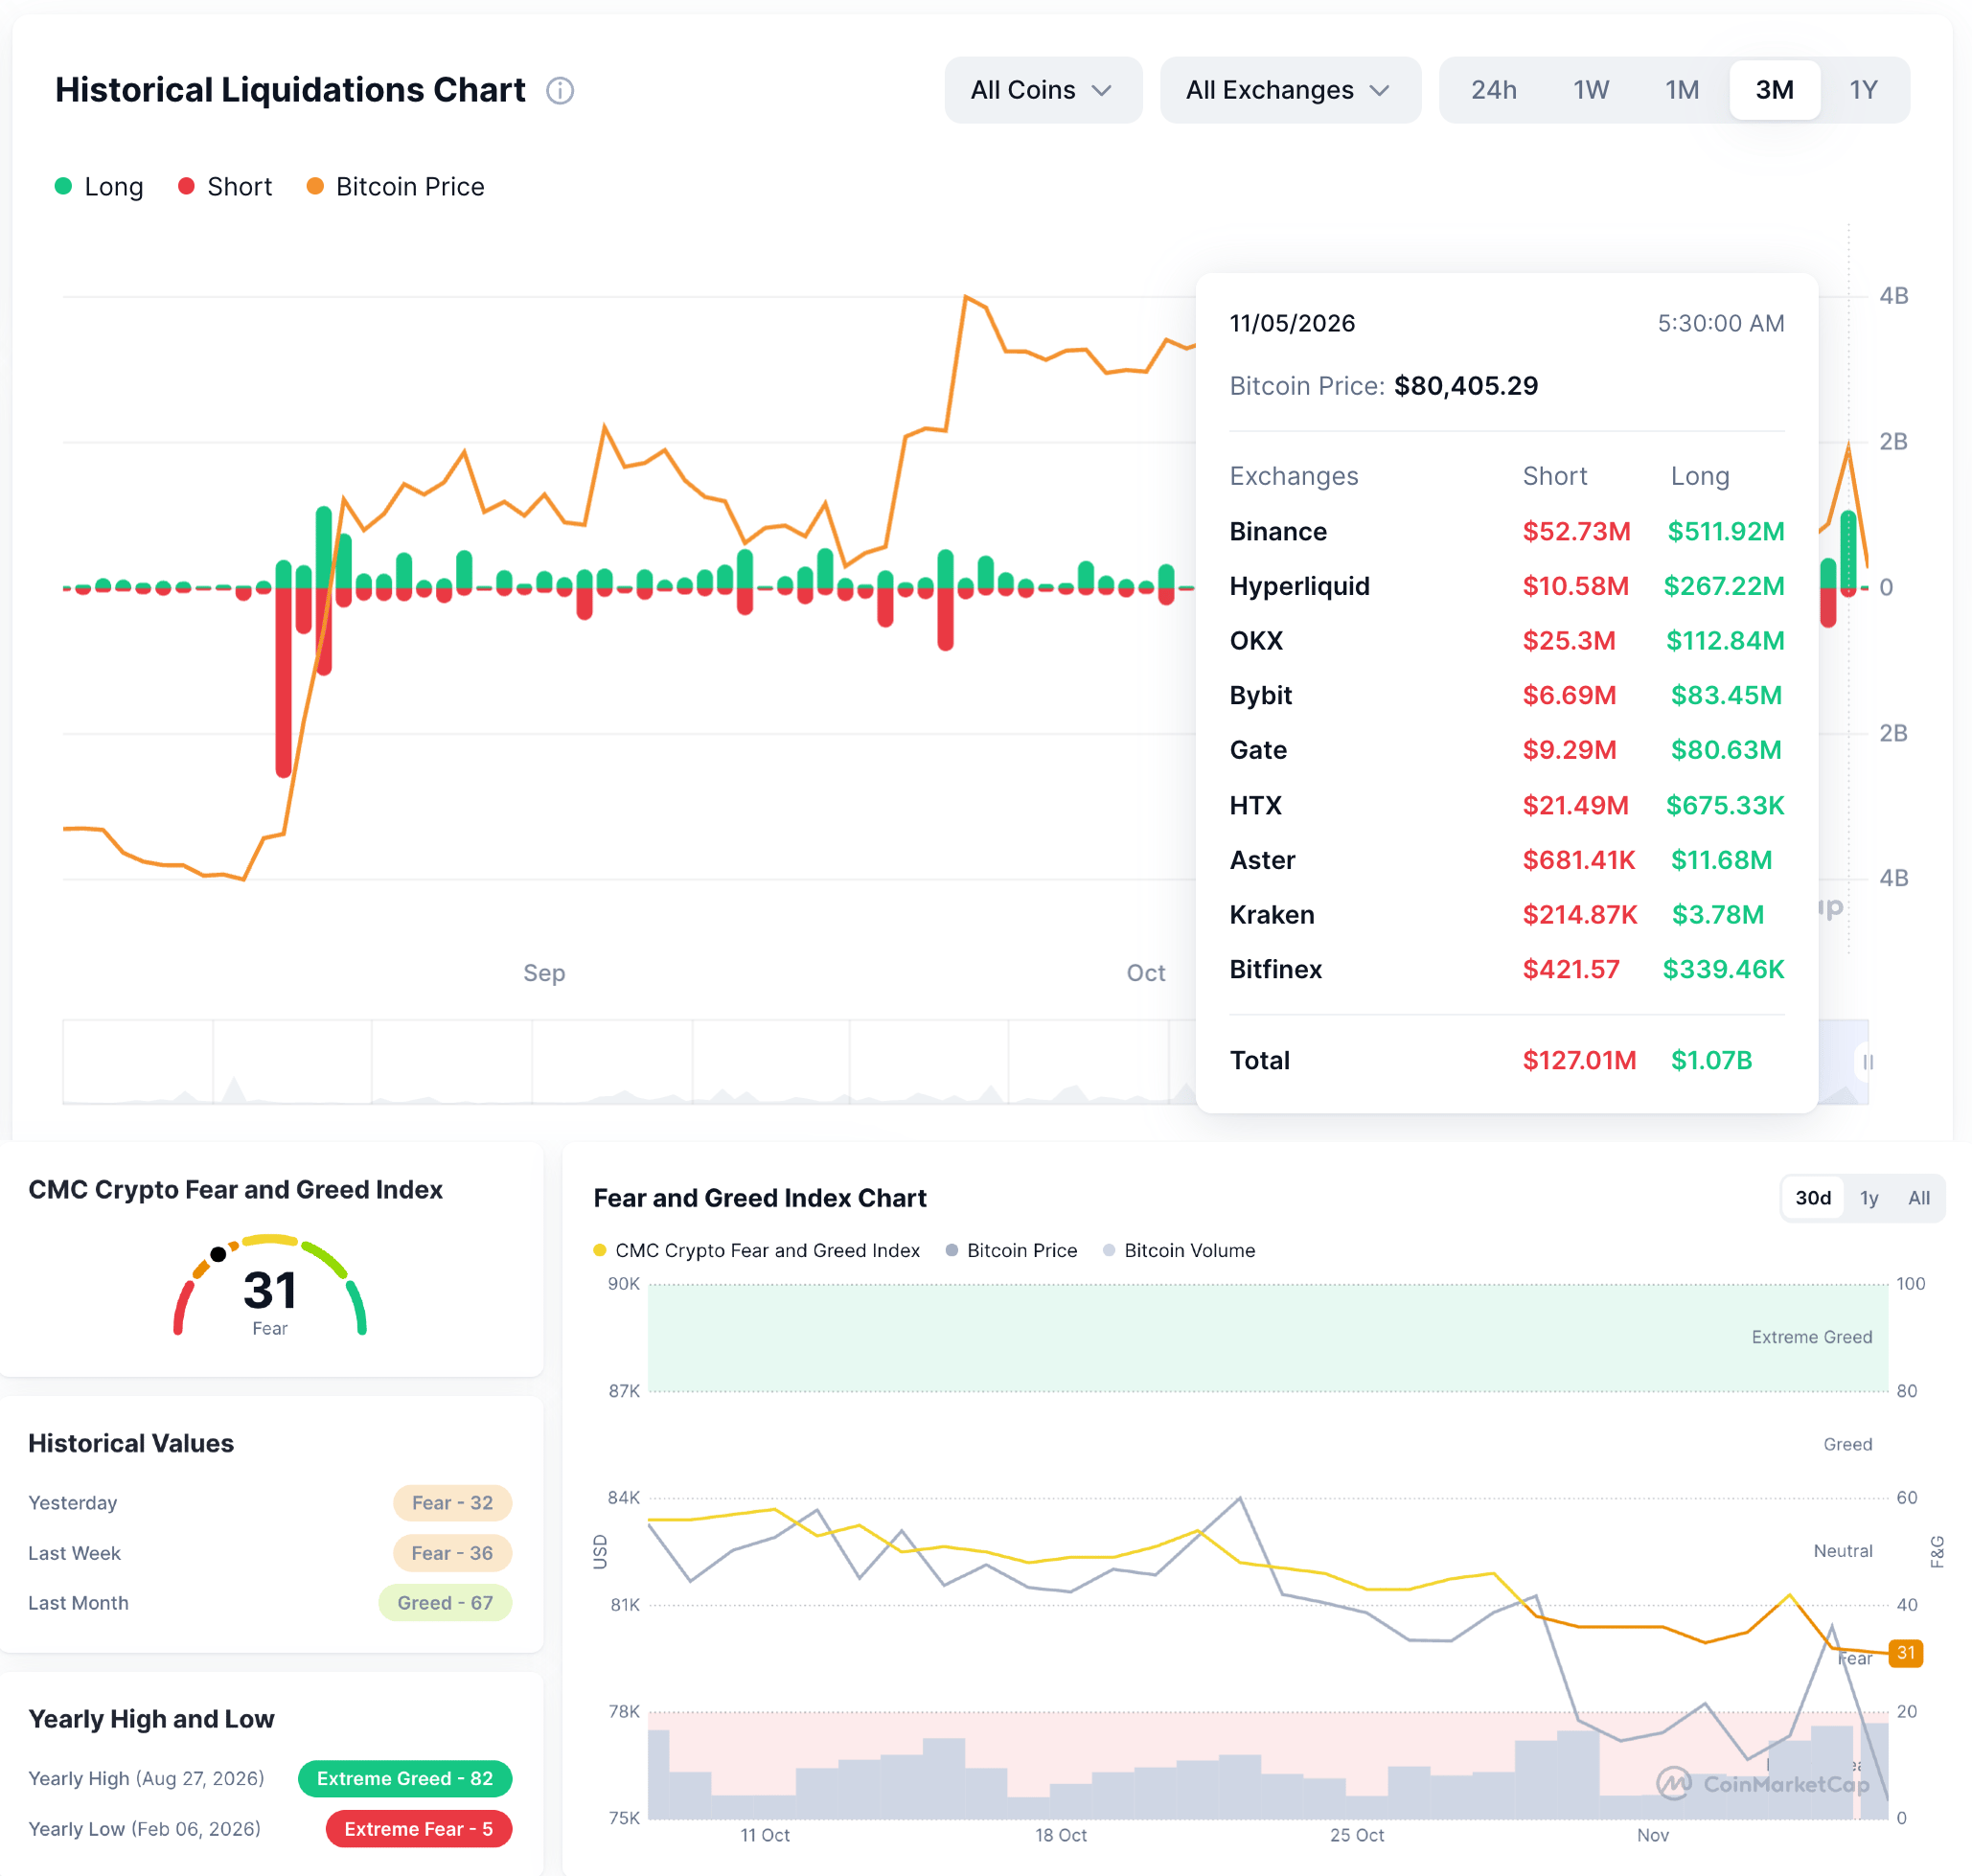
Liquidation chart and Fear and Greed Index. Source: CoinMarketCap

Technical outlook: Will PI defend its final support?

Pi Network trades around $0.0756 at press time on Friday, keeping a bearish near-term tone. PI sits well below the 50-day and 200-day Exponential Moving Averages (EMAs) at roughly $0.0817 and $0.1101, respectively.

The Moving Average Convergence Divergence (MACD) risks crossing below its signal line as the positive histogram wanes, while the Relative Strength Index (RSI) hovers near 37, hinting at fragile momentum and a move toward oversold levels.

Looking down, the only nearby structural support is the October 15 low at $0.0740, followed by the record low of $0.0704 set on July 14, where buyers may look to defend the current range if selling pressure resumes.

Chart Analysis PI/USD (baha Crypto)
PI/USD daily price chart.

On the topside, initial resistance appears near the trendline break area around $0.0770, followed by the 50-day EMA at $0.0817. Higher up, additional barriers are seen at the 50% retracement level around $0.1049, measured from $0.1394 to $0.0704, and the 200-day EMA at $0.1101.

(The technical analysis of this story was written with the help of an AI tool. Know more.)

Disclaimer: For information purposes only. Past performance is not indicative of future results.
placeholder
Gold rebounds to $3,946 off $3,870 as oil does the Fed's work — but the ETF bid is still missingGold closed at $3,946, up 1.84% from a one-year low of $3,870.25, as Brent's 7.6% slide cut December hike odds to 77%. ETF holdings are still shrinking — a short-covering bounce, not new money.
Author  Irene Q.
Nov 03, Tue
Gold closed at $3,946, up 1.84% from a one-year low of $3,870.25, as Brent's 7.6% slide cut December hike odds to 77%. ETF holdings are still shrinking — a short-covering bounce, not new money.
placeholder
TradingKey Daily Market Brief: Nasdaq Falls Over 5%, AI Stocks Plunge as Nvidia Drops Over 9%, Micron Falls Over 17%, SanDisk Drops Over 22% During the Asian trading session on November 6, the three major U.S. stock indices tumbled across the board overnight as the sell-off across the AI data center suppl
Author  TradingKey
Yesterday 01: 41
During the Asian trading session on November 6, the three major U.S. stock indices tumbled across the board overnight as the sell-off across the AI data center suppl
placeholder
Gold Price Analysis Today | Forex Gold Analysis | XAU/USD Analysis - November 6, 2026Get the latest gold price analysis, forex gold insights, and XAU/USD analysis for November 6, 2026. Read on for the details.
Author  Mitrade
Yesterday 01: 36
Get the latest gold price analysis, forex gold insights, and XAU/USD analysis for November 6, 2026. Read on for the details.
placeholder
Gold's $250 week runs into the last payrolls before DecemberSpot gold traded at $4,080.79 after a roughly 6% weekly rally from the Oct 30 low of $3,869.85, touching $4,146.63 on Nov 5. Three bids are stacked into the move: real-rate relief, record official-sector buying, and a geopolitical premium. Tonight's October payrolls (+65K consensus, 4.2% unemployment) decide which bid survives, with $4,000 and $4,200 as the two lines.
Author  Irene Q.
Yesterday 03: 03
Spot gold traded at $4,080.79 after a roughly 6% weekly rally from the Oct 30 low of $3,869.85, touching $4,146.63 on Nov 5. Three bids are stacked into the move: real-rate relief, record official-sector buying, and a geopolitical premium. Tonight's October payrolls (+65K consensus, 4.2% unemployment) decide which bid survives, with $4,000 and $4,200 as the two lines.
placeholder
Micron's $4.5 billion Taiwan fab won't make a chip until 2028 — the market sold it as a 2026 problemMicron fell 17.46% to $656.39 after Bloomberg reported construction at its $4.5 billion Taoyuan Fab 11E had all but halted over a labor dispute. The plant was not due online until 2028, so no 2026 output is lost. With FY27 EPS consensus near $160 and 2027 HBM sold out, the selloff is a peak-cycle multiple reset, not a demand collapse — and $650 is the line that separates the two.
Author  Irene Q.
Yesterday 03: 28
Micron fell 17.46% to $656.39 after Bloomberg reported construction at its $4.5 billion Taoyuan Fab 11E had all but halted over a labor dispute. The plant was not due online until 2028, so no 2026 output is lost. With FY27 EPS consensus near $160 and 2027 HBM sold out, the selloff is a peak-cycle multiple reset, not a demand collapse — and $650 is the line that separates the two.
goTop
quote