


Bitcoin Price Forecast: BTC slides below $80,000 as Fed holds rates steady with a hawkish tone
- Bitcoin erases most weekly gains, retreating below $80,000 on Thursday as the Fed kept rates unchanged with a hawkish tone.
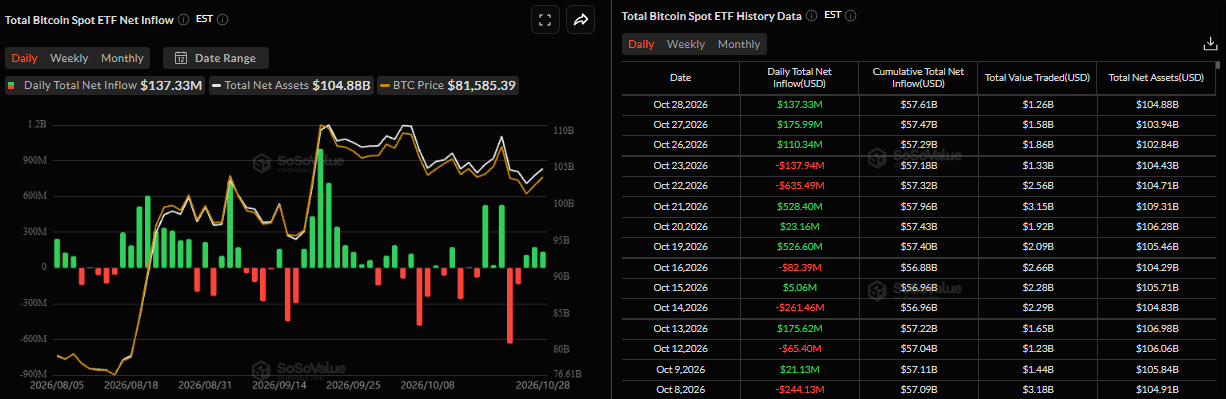
- US-listed spot ETFs recorded an inflow of $137.33 million on Wednesday, marking three consecutive days of positive flows.
- Market participants now await US September PCE and Q3 GDP data on Thursday for fresh clues on the health of the economy.
Bitcoin (BTC) slips below $80,000 on Thursday, erasing most of its weekly gains after the Federal Reserve (Fed) held interest rates steady while signaling a hawkish policy stance. Despite the price correction, institutional demand remained modest so far this week, with spot Bitcoin Exchange Traded Funds (ETFs) recording $137.33 million on Wednesday, marking three consecutive days of positive flows.
Meanwhile, traders now remain cautious ahead of the US September Personal Consumption Expenditures (PCE) inflation report and Q3 Gross Domestic Product (GDP) data, both due later on Thursday, for fresh clues on the health of the economy.
Fed leaves rates unchanged with a clear warning on inflation
The Fed held its policy rate steady at 3.75%-4.00% at its two-day October policy meeting on Wednesday. The decision wasn’t unanimous. Among the two officials who wanted a 25-basis-point hike were Lisa Cook and Beth Hammack, while Chair Kevin Warsh said the Fed would use the coming flow of information to decide whether further action is needed.
Warsh said during his press conference that officials have “made clear our readiness to act as circumstances require, and we have shown our willingness to act.”
“It’s our responsibility to get inflation down,” Warsh said. “That’s the reason the FOMC’s discussion over the last couple of days focused mainly on the price stability side of our remit,” he added.
Market participants had already priced in steady rates, but the hawkish undertone and inflation concerns in forward guidance add to a cautious market backdrop and weigh on risky assets such as Bitcoin. According to the CME FedWatch Tool, the probability of the Fed tightening at the December 9 meeting rose slightly to 79.6% on Thursday, up from 78.33% on Tuesday. The shift toward tighter monetary policy is mildly supporting safe-haven assets, with the 10-year Treasury yield holding above 5% and the US Dollar Index (DXY) above $102, while weighing on risky assets such as BTC, which slid below $80,000 on Thursday.
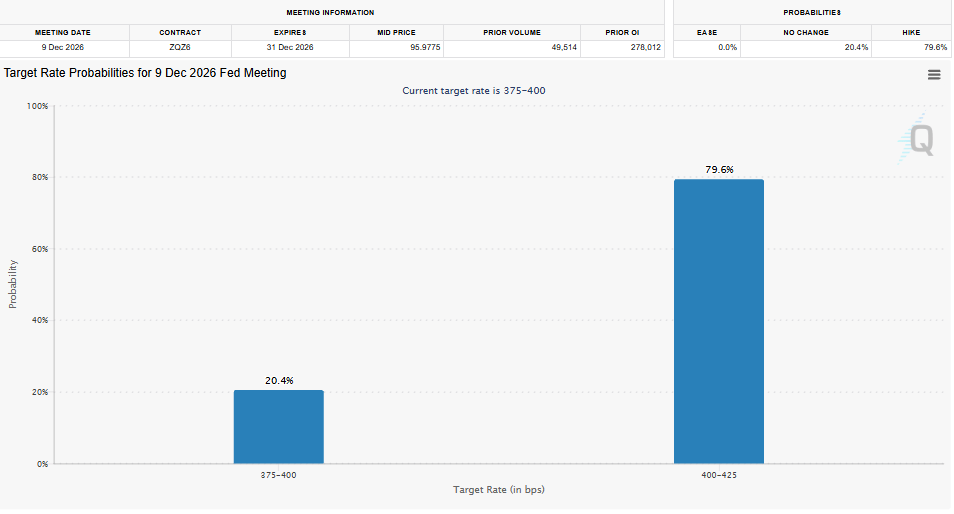
Meanwhile, USD bulls seem hesitant and are waiting for more cues before placing fresh bets. Hence, the focus will remain glued to US economic releases – the Advance Q3 GDP report and the Personal Consumption Expenditures (PCE) Price Index on Thursday. These key data will play a major role in shaping USD price dynamics, offer fresh clues on economic health and insights into the monetary policy path, which could give a directional bias for BTC.
Institutional investors’ demand remains modest
Institutional demand for Bitcoin remains cautiously bullish. SoSoValue data showed that spot Bitcoin ETFs recorded inflows of $137.33 million on Wednesday, marking the third consecutive week of inflows. These daily inflows so far indicate modest institutional buying interest but remain less substantial than last week, suggesting investors are taking a cautious approach. If this inflow trend continues and intensifies this week, BTC could rebound.
Bitcoin technical outlook: BTC slips below $80,000
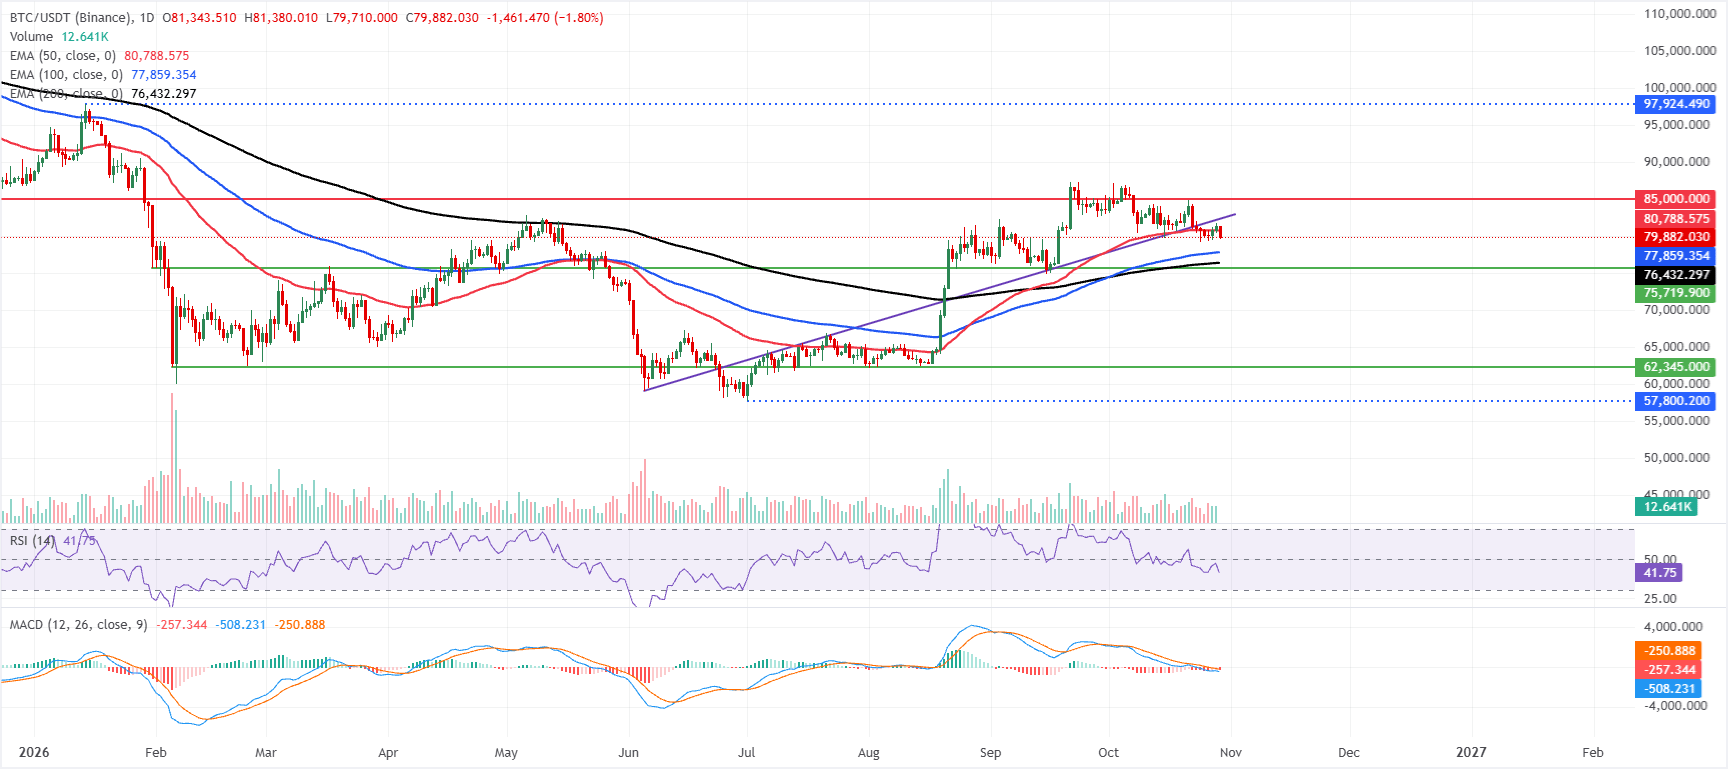
Bitcoin price trades at $79,882 on Thursday, holding above the 100-day and 200-day Exponential Moving Averages (EMAs) at $77,859 and $76,432, which underpin the broader uptrend. Still, the pair is increasingly capped by the 50-day EMA at $80,788.
The Relative Strength Index (RSI) has slipped toward the low-40s. Meanwhile, the Moving Average Convergence Divergence (MACD) remains in negative territory with subdued momentum, suggesting a consolidative, mildly bearish tone as buyers struggle to reclaim the short-term average.
On the topside, immediate resistance is located at the 50-day EMA near $80,788, followed by the horizontal barrier at $85,000, where fresh supply could emerge if price extends higher.
On the downside, initial support is the 100-day EMA around $77,859, with a deeper floor at the 200-day EMA near $76,432; a daily close below these averages would significantly weaken the current structure and open the door to a broader corrective phase.
(The technical analysis of this story was written with the help of an AI tool. Know more.)
Bitcoin, altcoins, stablecoins FAQs
Bitcoin is the largest cryptocurrency by market capitalization, a virtual currency designed to serve as money. This form of payment cannot be controlled by any one person, group, or entity, which eliminates the need for third-party participation during financial transactions.
Altcoins are any cryptocurrency apart from Bitcoin, but some also regard Ethereum as a non-altcoin because it is from these two cryptocurrencies that forking happens. If this is true, then Litecoin is the first altcoin, forked from the Bitcoin protocol and, therefore, an “improved” version of it.
Stablecoins are cryptocurrencies designed to have a stable price, with their value backed by a reserve of the asset it represents. To achieve this, the value of any one stablecoin is pegged to a commodity or financial instrument, such as the US Dollar (USD), with its supply regulated by an algorithm or demand. The main goal of stablecoins is to provide an on/off-ramp for investors willing to trade and invest in cryptocurrencies. Stablecoins also allow investors to store value since cryptocurrencies, in general, are subject to volatility.
Bitcoin dominance is the ratio of Bitcoin's market capitalization to the total market capitalization of all cryptocurrencies combined. It provides a clear picture of Bitcoin’s interest among investors. A high BTC dominance typically happens before and during a bull run, in which investors resort to investing in relatively stable and high market capitalization cryptocurrency like Bitcoin. A drop in BTC dominance usually means that investors are moving their capital and/or profits to altcoins in a quest for higher returns, which usually triggers an explosion of altcoin rallies.
Recommended Articles


