


3 Indications a Market Crash Could Be Coming Soon
Key Points
The Buffett indicator, which measures U.S. GDP as a percentage of total stock market value, is at levels implying the market is highly overvalued.
The CAPE ratio, which measures the average inflation-adjusted P/E ratio, is getting close to record highs.
High inflation and interest rates could stunt economic activity.
- Motley Fool Issues Rare "Total Conviction" Buy Alert ›
Is the bull market finally coming to an end? The S&P 500 (SNPINDEX: ^GSPC) has more than doubled over the past four years, and it's up 11% year to date. However, it's roughly flat over the past month. The current negative market sentiment is tied to worries about artificial intelligence (AI) spend and high oil prices.
Does that mean a crash is on the way? Not necessarily. But don't be caught off guard if the bubble finally bursts. Here are three indications that a market crash could be happening soon.
Missed AI’s "Act 1"? Act 2 Could Be 15x Bigger. Most investors think they missed the AI boat because they didn't buy Nvidia in 2005. But according to our analysts, we’re only at the end of "Act 1"—the R&D phase. "Act 2" is the global rollout. Continue »
1. Investors are "playing with fire"
In 1999, at the height of a bull market, Warren Buffett wrote an article for Fortune explaining why a market drop was likely. The S&P 500 peaked in March 2000, capping more than five years of double-digit returns before beginning to fall.
Image source: Getty Images.
In December 2001, he penned another article explaining why the January 2000 market crash was inevitable. By that time, the S&P 500 had fallen 25%, and Buffett was confident it would fall further. In total, the index lost almost half of its total value from peak to trough, and the Nasdaq-100 lost 83%.
Buffett's not a prophet; he just understands economics and markets. He explained that corporate earnings growth can't substantially outpace gross domestic product (GDP) growth. As the sentiment of how companies are doing, measured by total stock market value, increases relative to GDP, stocks become overvalued.
His formula to gauge that metric is simple: Divide the total stock market value by GDP. If the result is 70% to 80%, Buffett says that "buying stocks is likely to work very well for you." If it crosses 200%, like it did before the market crashed in 2000, he says, "You are playing with fire."
Today, what's now known as the Buffett indicator stands at 301%.
2. Prices are outpacing earnings
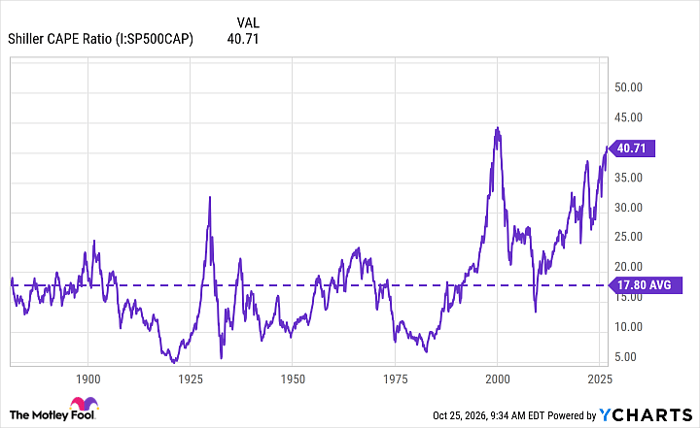
The CAPE ratio is another measure of how expensive the market is right now. It was developed by economist Robert Shiller and is also known as the Shiller CAPE ratio. It stands for cyclically adjusted P/E ratio, and it's calculated by dividing the level of the index, here the S&P 500, by the average 10-year inflation-adjusted earnings.
The average CAPE ratio over time is 17.8, and it has surpassed 40 only twice: once before the dot-com crash in 2000, when it hit an all-time high of 44, and now.
Shiller CAPE Ratio data by YCharts
3. Interest rates might be on their way up
The third indication that a market crash could be on the way is the economic landscape. Inflation has been unrelenting, and interest rates are likely to be raised again to combat it.
This could negatively impact the market in several ways. Higher interest rates make it harder for companies to borrow money and keep growing. If they can't expand, earnings might fall. A combination of slow growth and declining earnings will naturally send stock prices lower.
It affects individuals by making it less likely they'll have extra money to spend on stocks. Stock prices move higher as more people buy them. It's a simple supply-and-demand model. If people need to hold on to their cash to pay for essentials, they won't be buying stocks.
Finally, as interest rates rise, investors can earn more on instruments directly correlated with them, such as Treasury bills and corporate bonds. High bond yields make it less likely that investors will want to buy riskier stocks.
None of this means a market crash is imminent, although it might be. There's a chance that the Federal Reserve will raise interest rates and they'll do their job of dampening inflation before a crash. If businesses can keep growing, they may earn their valuations.
However, if you haven't yet prepared your portfolio for the possibility of a market crash happening soon, now's the time to do so.
Should you buy stock in S&P 500 Index right now?
Before you buy stock in S&P 500 Index, consider this:
The Motley Fool Stock Advisor analyst team just identified what they believe are the 10 best stocks for investors to buy now… and S&P 500 Index wasn’t one of them. The 10 stocks that made the cut could produce monster returns in the coming years.
Consider when Netflix made this list on December 17, 2004... if you invested $1,000 at the time of our recommendation, you’d have $337,166!* Or when Nvidia made this list on April 15, 2005... if you invested $1,000 at the time of our recommendation, you’d have $1,339,143!*
Now, it’s worth noting Stock Advisor’s total average return is 904% — a market-crushing outperformance compared to 213% for the S&P 500. Don't miss the latest top 10 list, available with Stock Advisor, and join an investing community built by individual investors for individual investors.
See the 10 stocks »
*Stock Advisor returns as of October 29, 2026.
Jennifer Saibil has no position in any of the stocks mentioned. The Motley Fool has no position in any of the stocks mentioned. The Motley Fool has a disclosure policy.
Recommended Articles


