


Crypto Overview: Bitcoin tops $80,000 as US Treasury fights high yields – AERO, VIRTUAL rally
- Bitcoin edges above $80,000 on Tuesday, with bulls targeting a breakout above the $82,850 swing high.
- Risk-on market sentiment holds as the US Treasury could take further actions to lower yields.
- Aerodrome Finance and Virtuals Protocol emerged as top performers over the last 24 hours.
Bitcoin (BTC) extends gains above $80,000 on Tuesday as broader market risk-on sentiment persists. The scarce asset could extend its rally as the US Treasury combats high yields in the long-dated bond market, with further interventions on the horizon. Aerodrome Finance (AERO) and Virtuals Protocol (VIRTUAL) emerged as top performers over the last 24 hours.
Could the US Treasury intervene again?
The Kobeissi Letter, in a recent X post, reported that the US Treasury could double down on its efforts to curb its $40 trillion debt and lower the yields in the bond market. The post suggests that after the recent doubling of buyback operations to $4 billion, the US Treasury could intervene by selling short-term debt, eliminating long-dated bonds, and more.
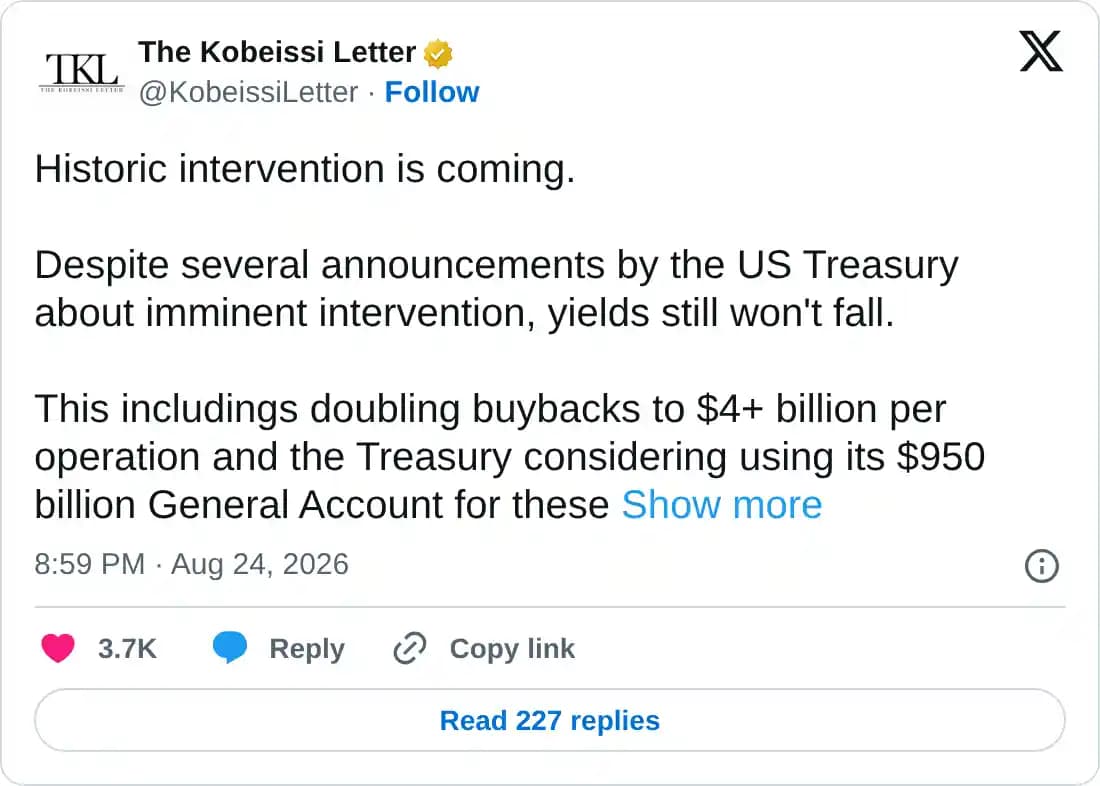
In addition, in a Bloomberg report, Martin Tobias, a US interest-rate strategist, said that US officials have been looking at ways to use any surplus cash, with Morgan Stanley estimating that the Treasury might have $80 billion to $200 billion available to fund larger buybacks.
Bitcoin and other scarce assets are likely to extend their rally, as seen last week when the buyback operation doubled.
Technical outlook: How high will Bitcoin's price go?
Bitcoin is up over 2% on Tuesday, pushing it above $80,000. BTC maintains a bullish bias as the rally extends above both the 50-day Exponential Moving Average (EMA) at $67,394 and the 200-day EMA at $72,431.
Momentum supports the rally, with the Moving Average Convergence Divergence (MACD) and signal line advancing in positive territory, hinting at persistent upside momentum. At the same time, the Relative Strength Index (RSI) near 83 signals an overbought condition that could encourage corrective pullbacks.
From a technical perspective, BTC is inching toward the May 6 high at $82,850, where a confirmed breakout could extend its rally. Looking up, the 127.2% Fibonacci extension, measured from the downswing from $82,850 to $57,800, at $91,374, could serve as a potential target level.
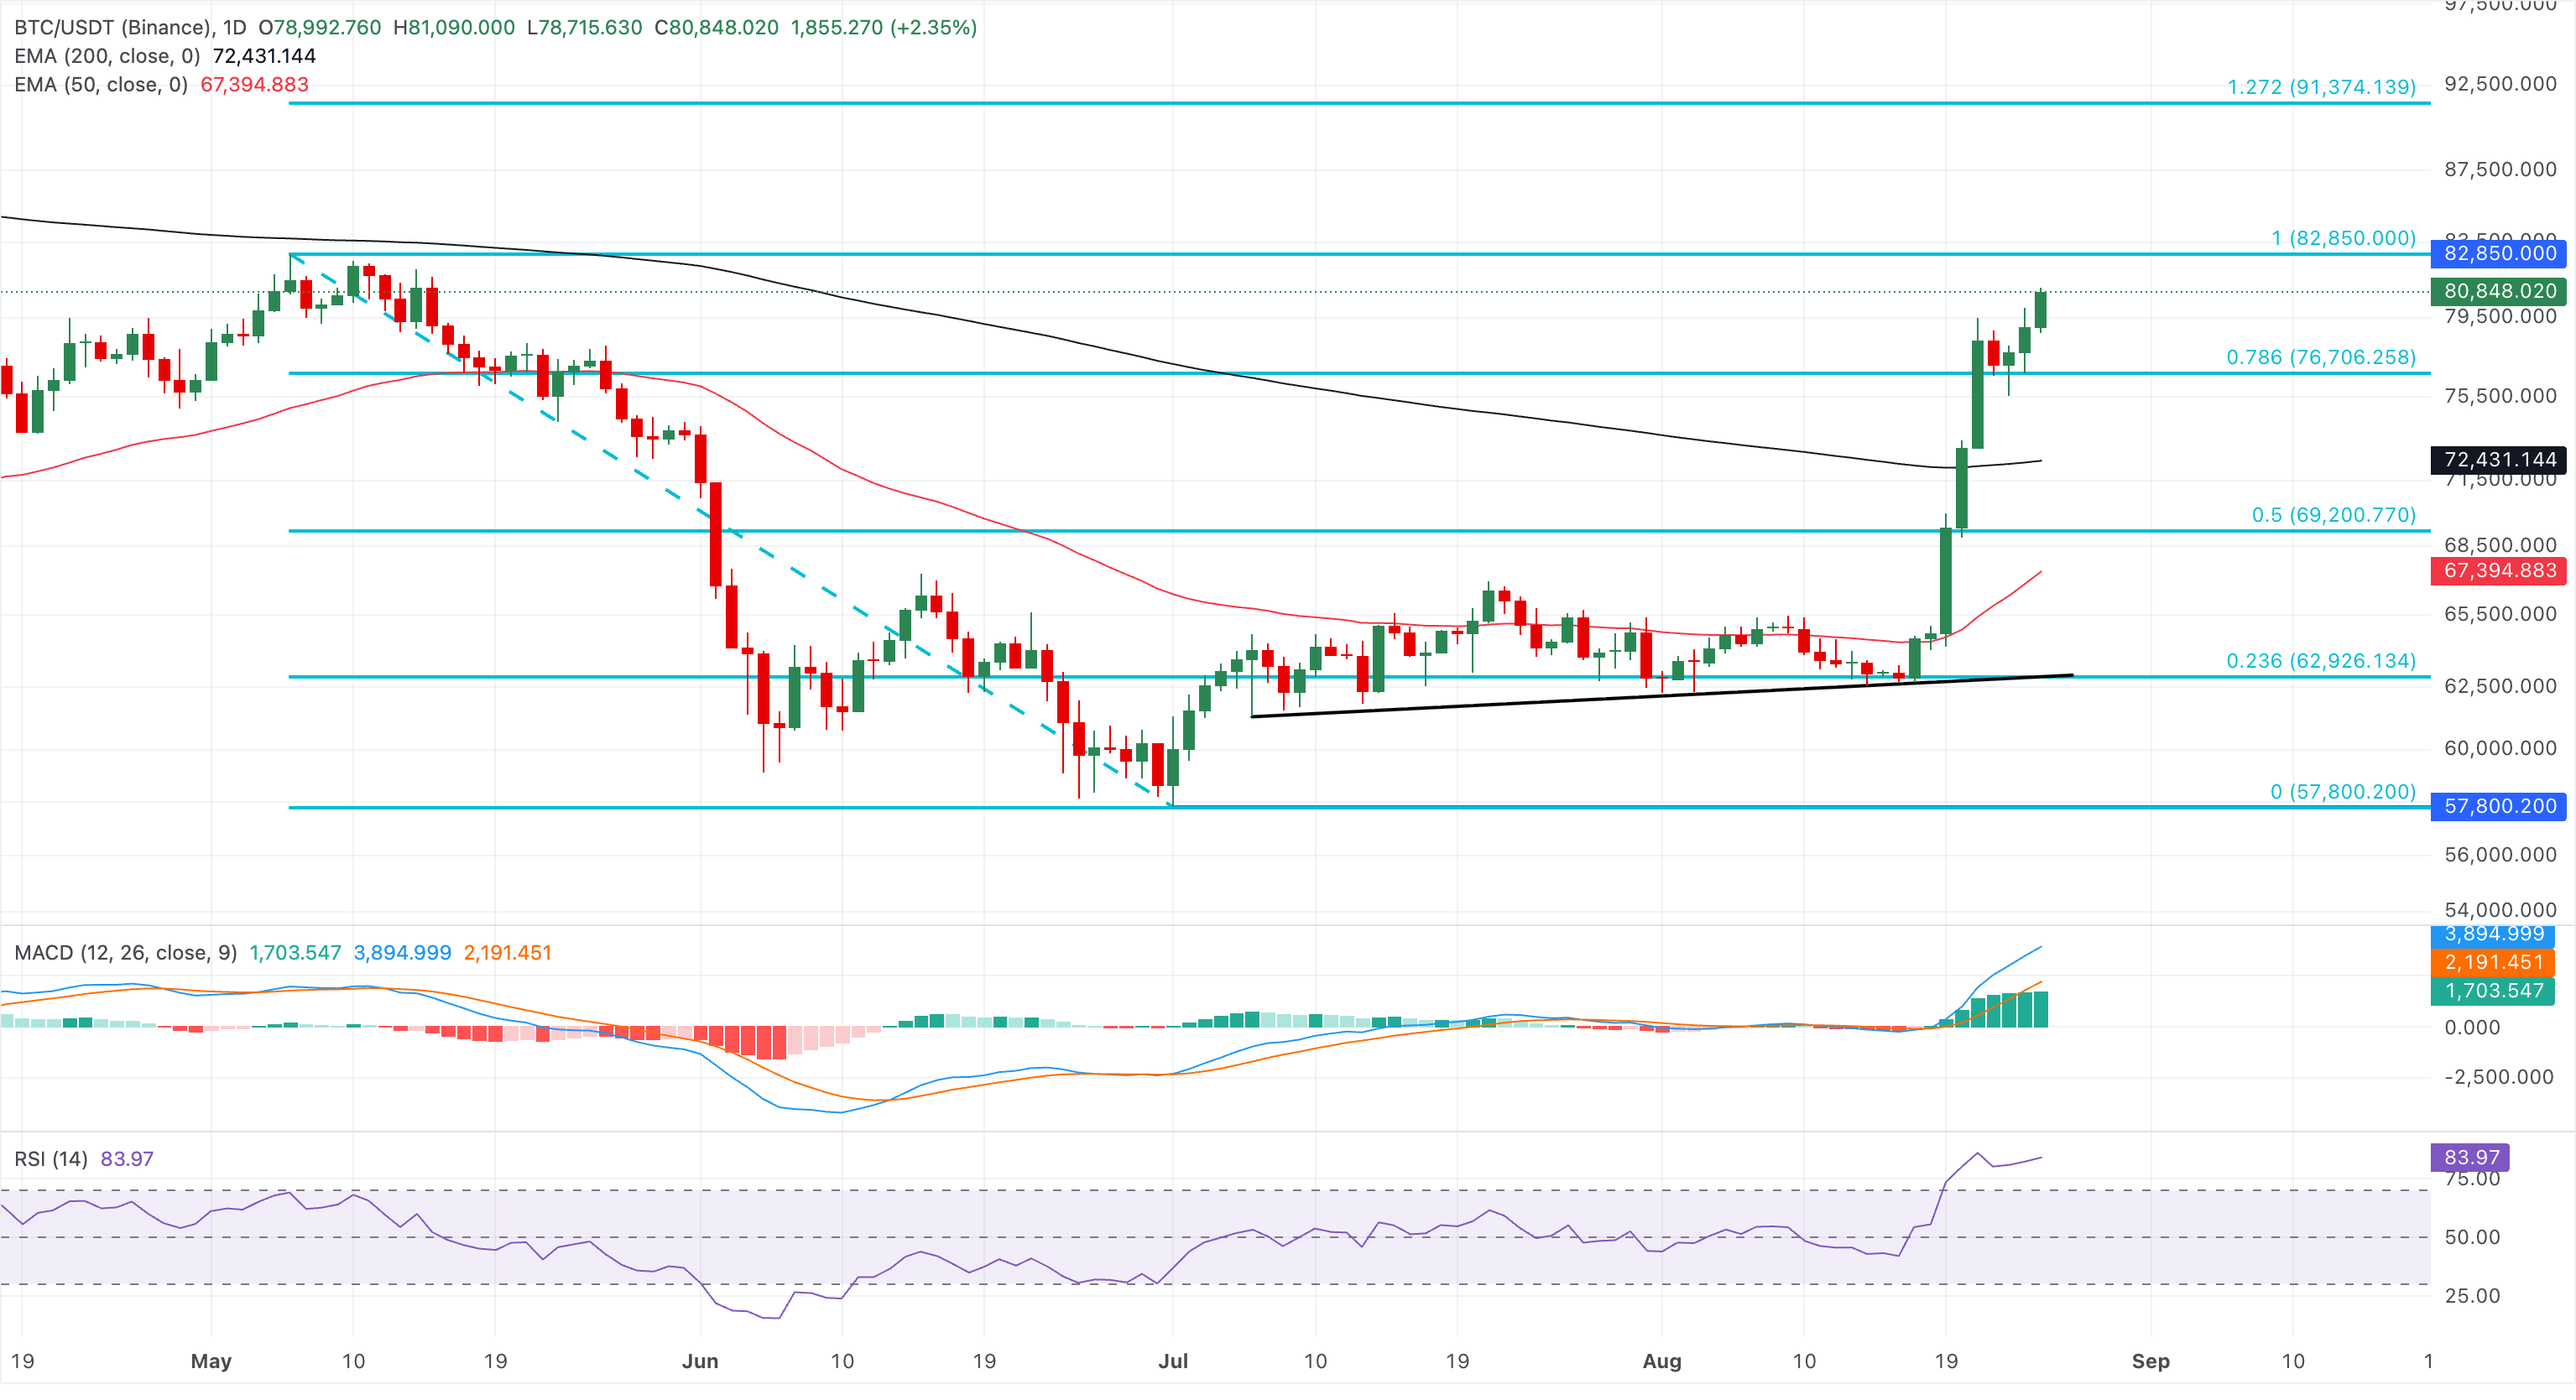
On the downside, initial support is seen at the 78.6% Fibonacci retracement at $76,706, ahead of a deeper cushion formed by the 200-day EMA at $72,431, while the 50% retracement at $69,200 with the 50-day EMA at $67,394 reinforces a broader demand zone on a larger dip.
Technical outlook: Could Aerodrome Finance and Virtuals Protocol extend their rally?
Aerodrome Finance is up 2% on Tuesday, maintaining a constructive bullish bias as the price holds well above the 50-day and 200-day EMAs at $0.4492 and $0.4658, respectively. The DeFi token is advancing toward the July 7 high at $0.6100, where a confirmed breakout could target the 127.2% Fibonacci extension of the $0.3055-$0.6100 upswing, at $0.7362.
The RSI at 74 hints at strong but increasingly stretched upside momentum, while the MACD and signal line rise into the positive territory with a firm bullish profile.
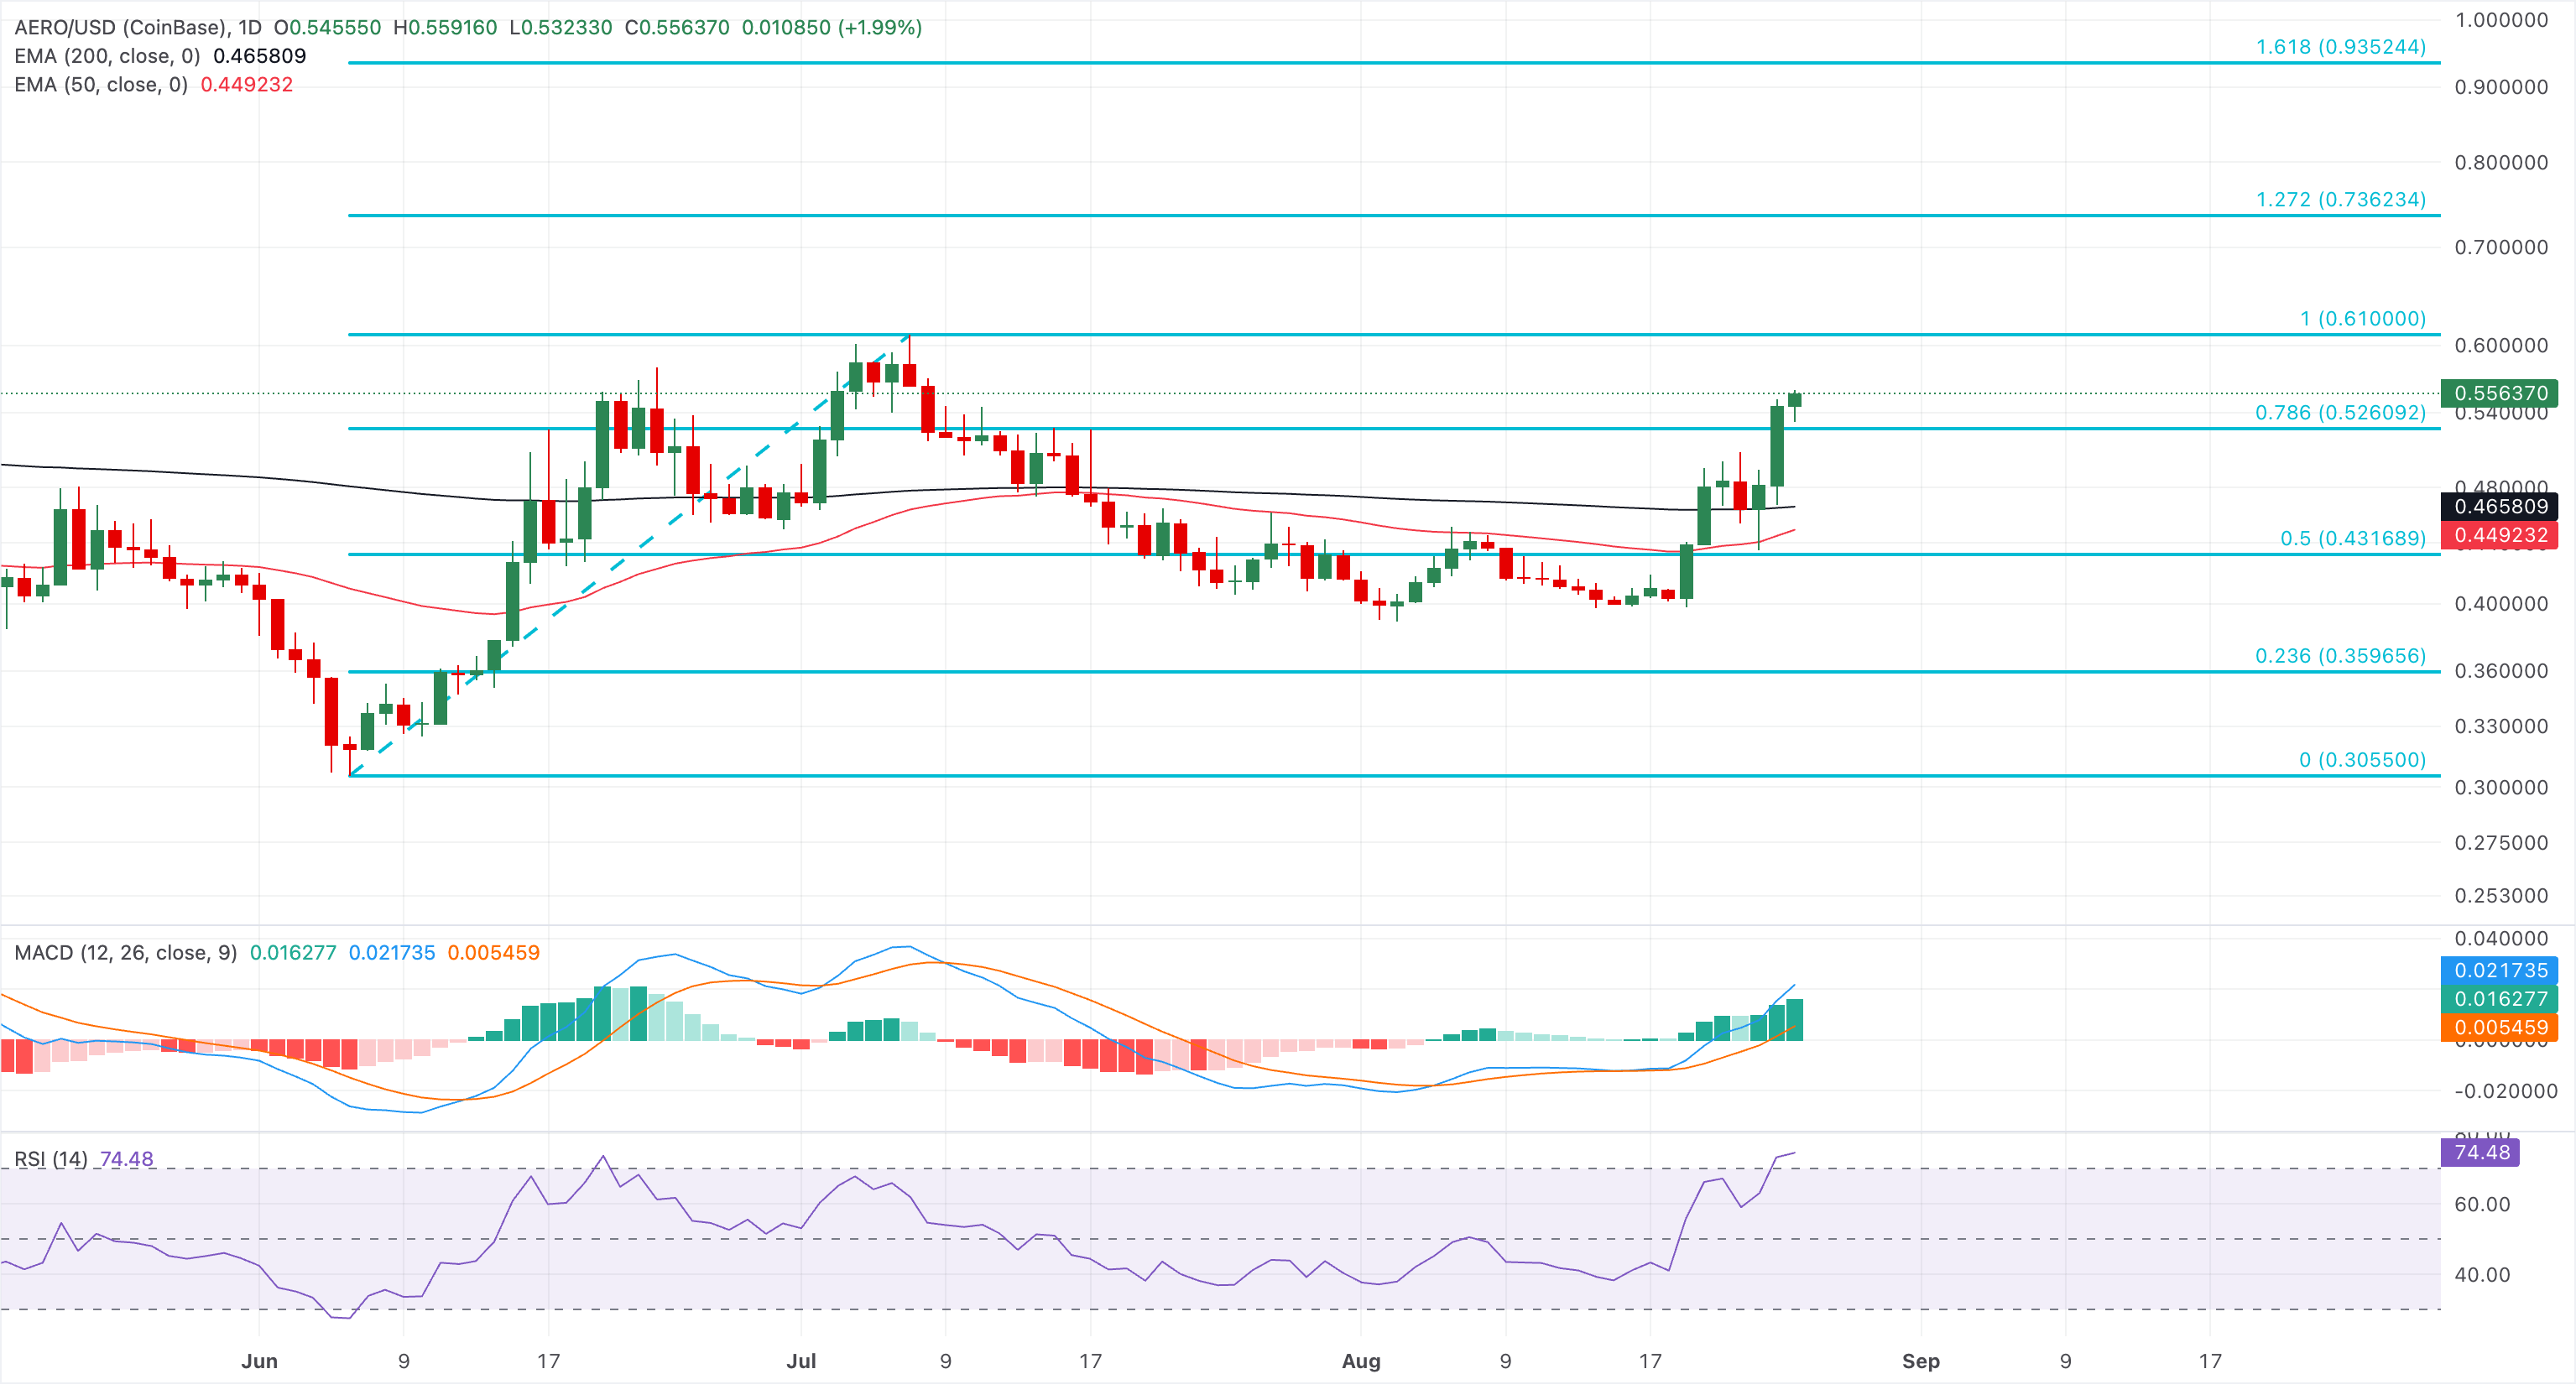
On the downside, initial support is seen at the 78.6% Fibonacci retracement near $0.5260, with additional demand layered at the 200-day EMA at $0.4658.
Virtuals Protocol is up nearly 3% on Tuesday, extending its 8% gains from the previous day. VIRTUAL extends its recovery above both the 50-day EMA at $0.6156 and the 200-day EMA at $0.6956, tilting the near-term bias firmly to the upside.
The RSI hovers in overbought territory around 75, while the MACD and signal line show a steady upward trend with an expanding bullish profile, hinting that bullish momentum remains strong, albeit stretched.
Looking up, the VIRTUAL rally targets the December 3 high at $1.0127, followed by the September 15 high at $1.1821.
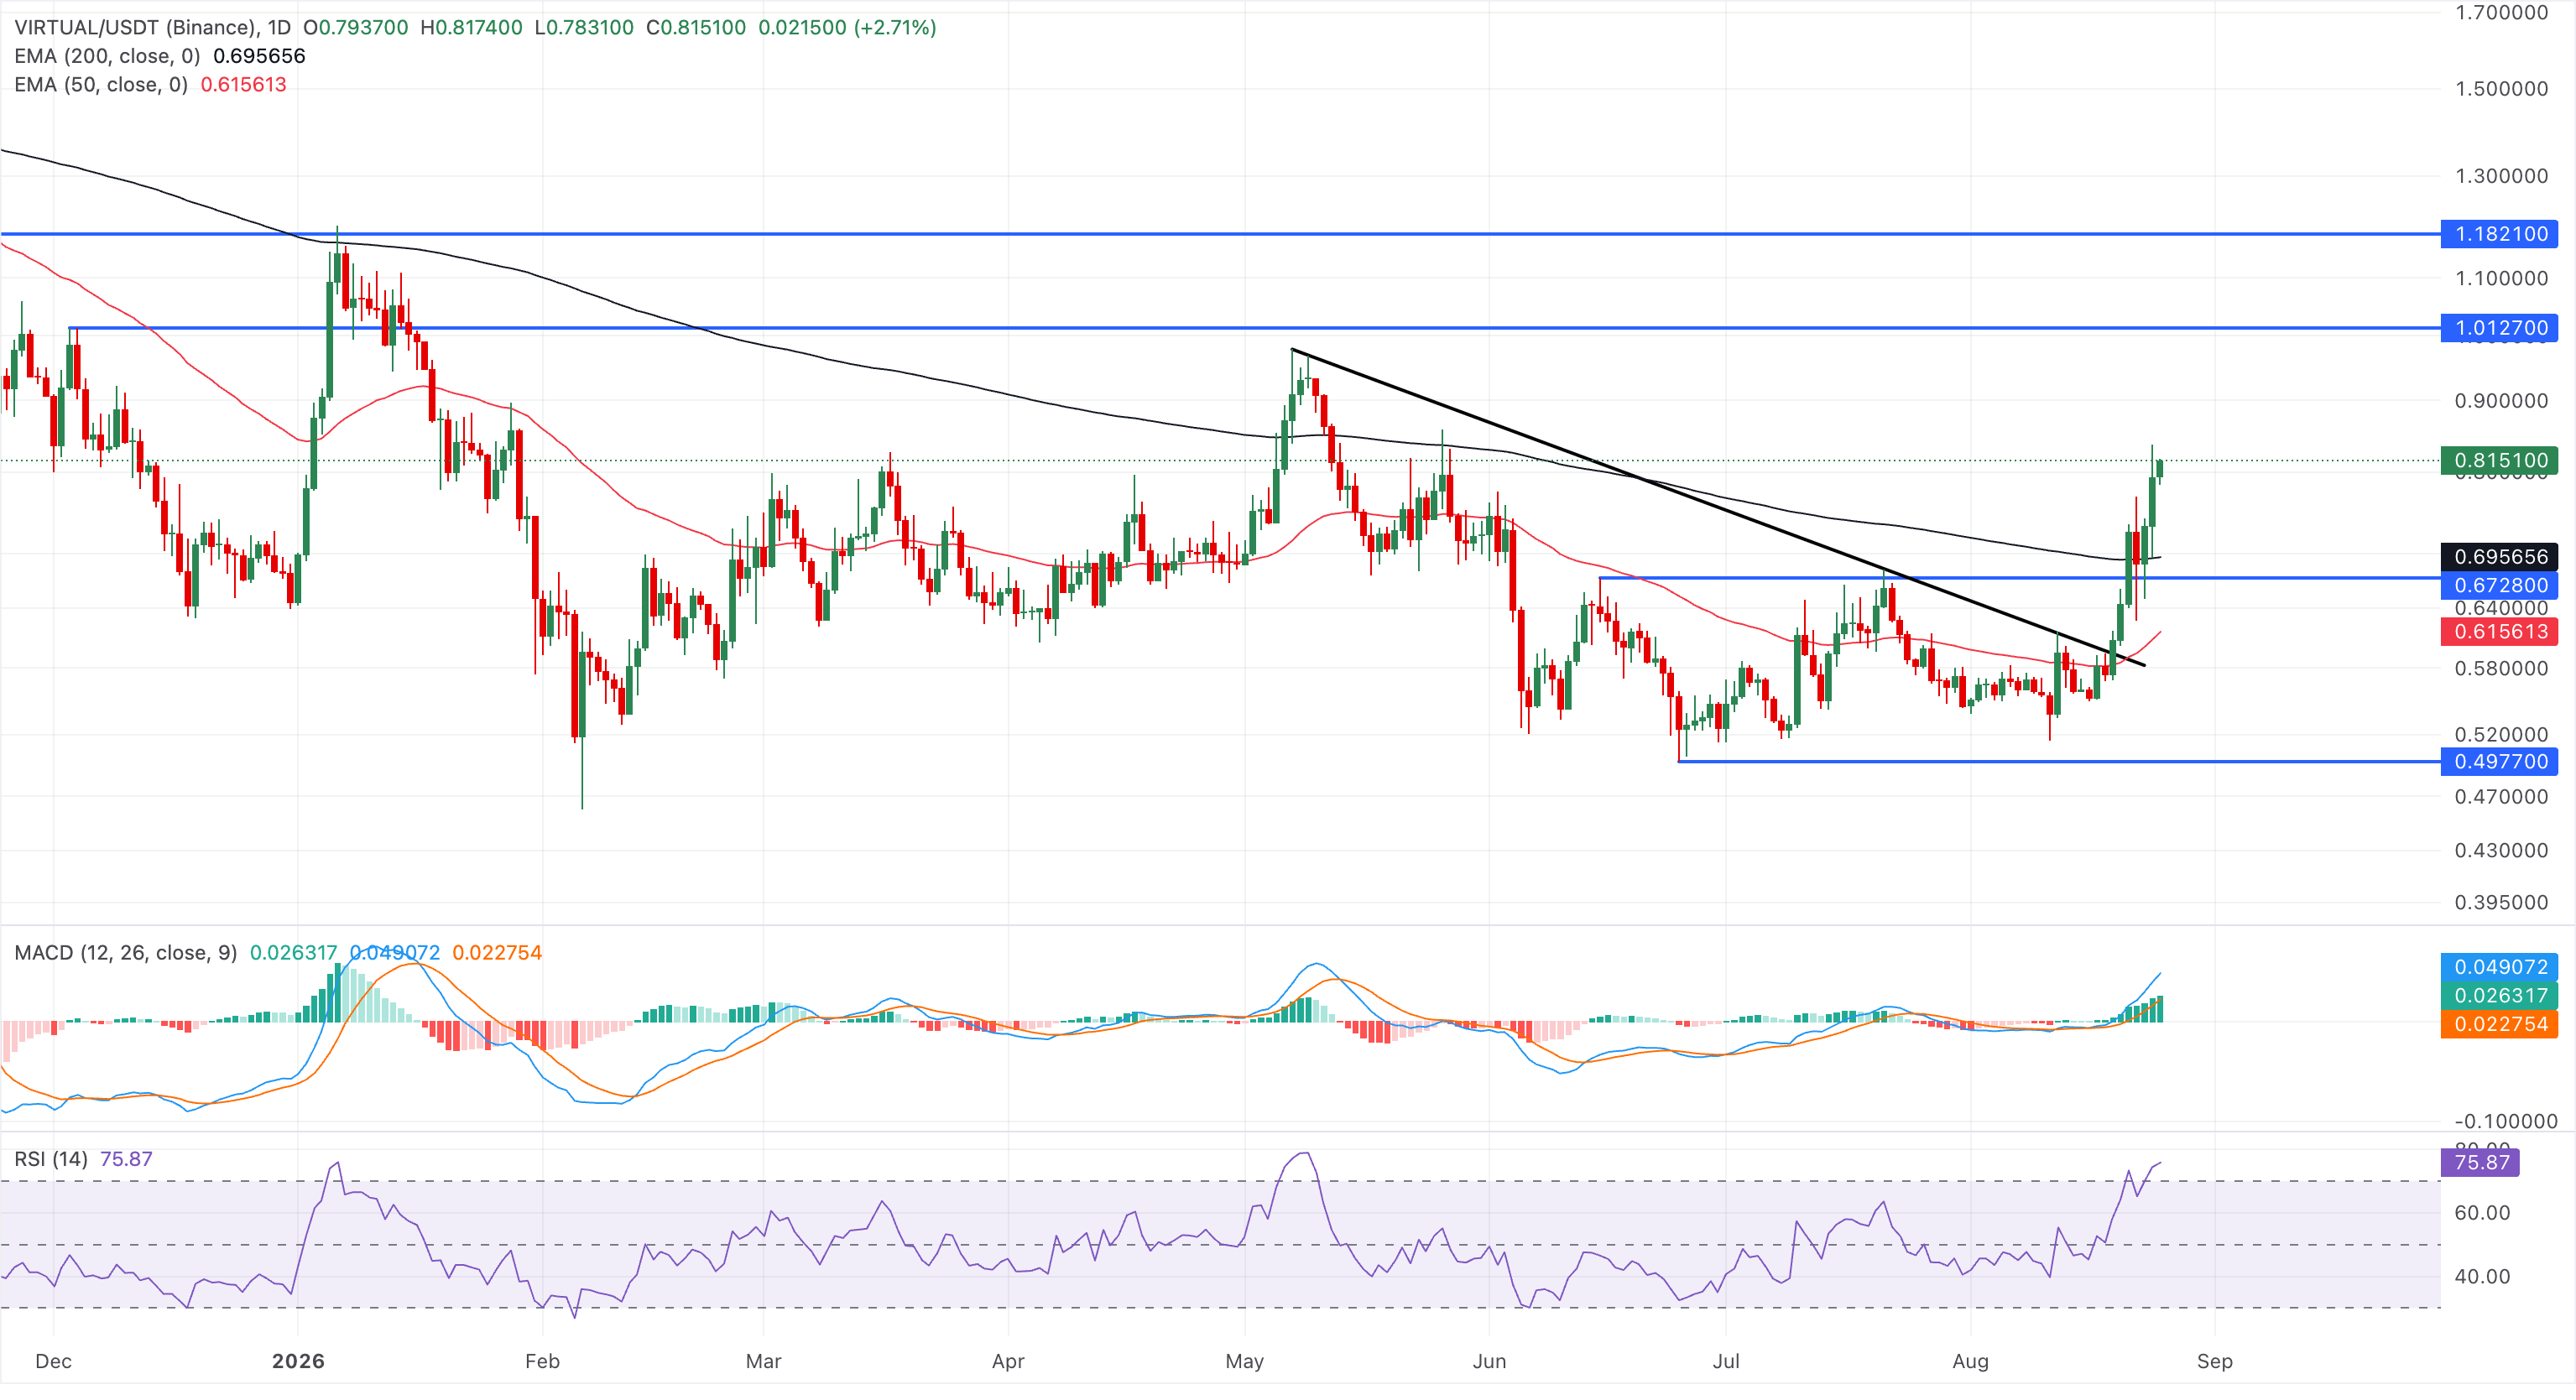
On the downside, initial support is seen at the 200-day EMA at $0.6956 and the 50-day EMA at $0.6156, followed by the broken trendline near $0.5750.
(The technical analysis of this story was written with the help of an AI tool. Know more.)
Recommended Articles


