


Hyperliquid Price Forecast: Mixed signals weigh down HYPE mild recovery
- Hyperliquid extends gains above $60 on Monday for the third consecutive day.
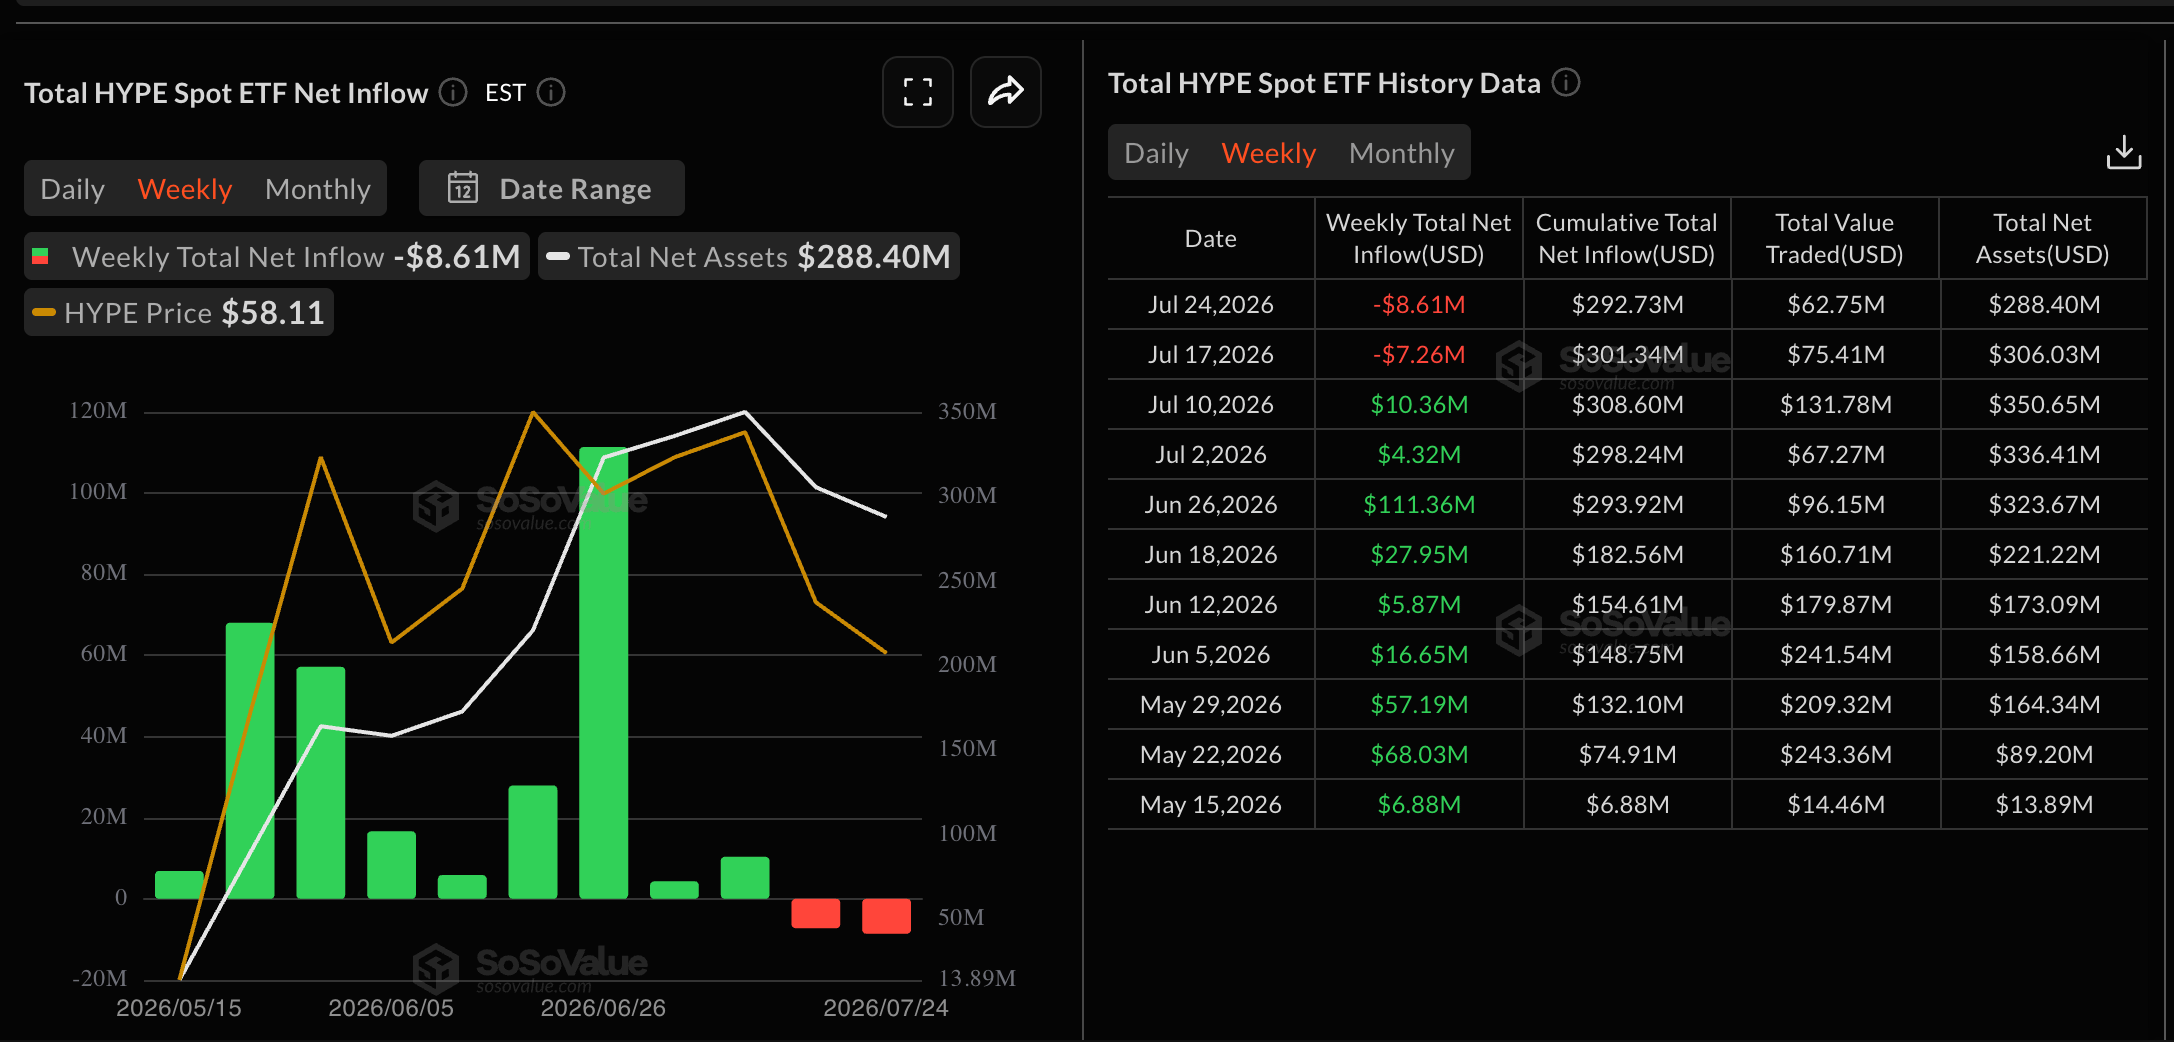
- HYPE-focused ETFs recorded $8.61 million in outflows last week, pointing to easing institutional demand.
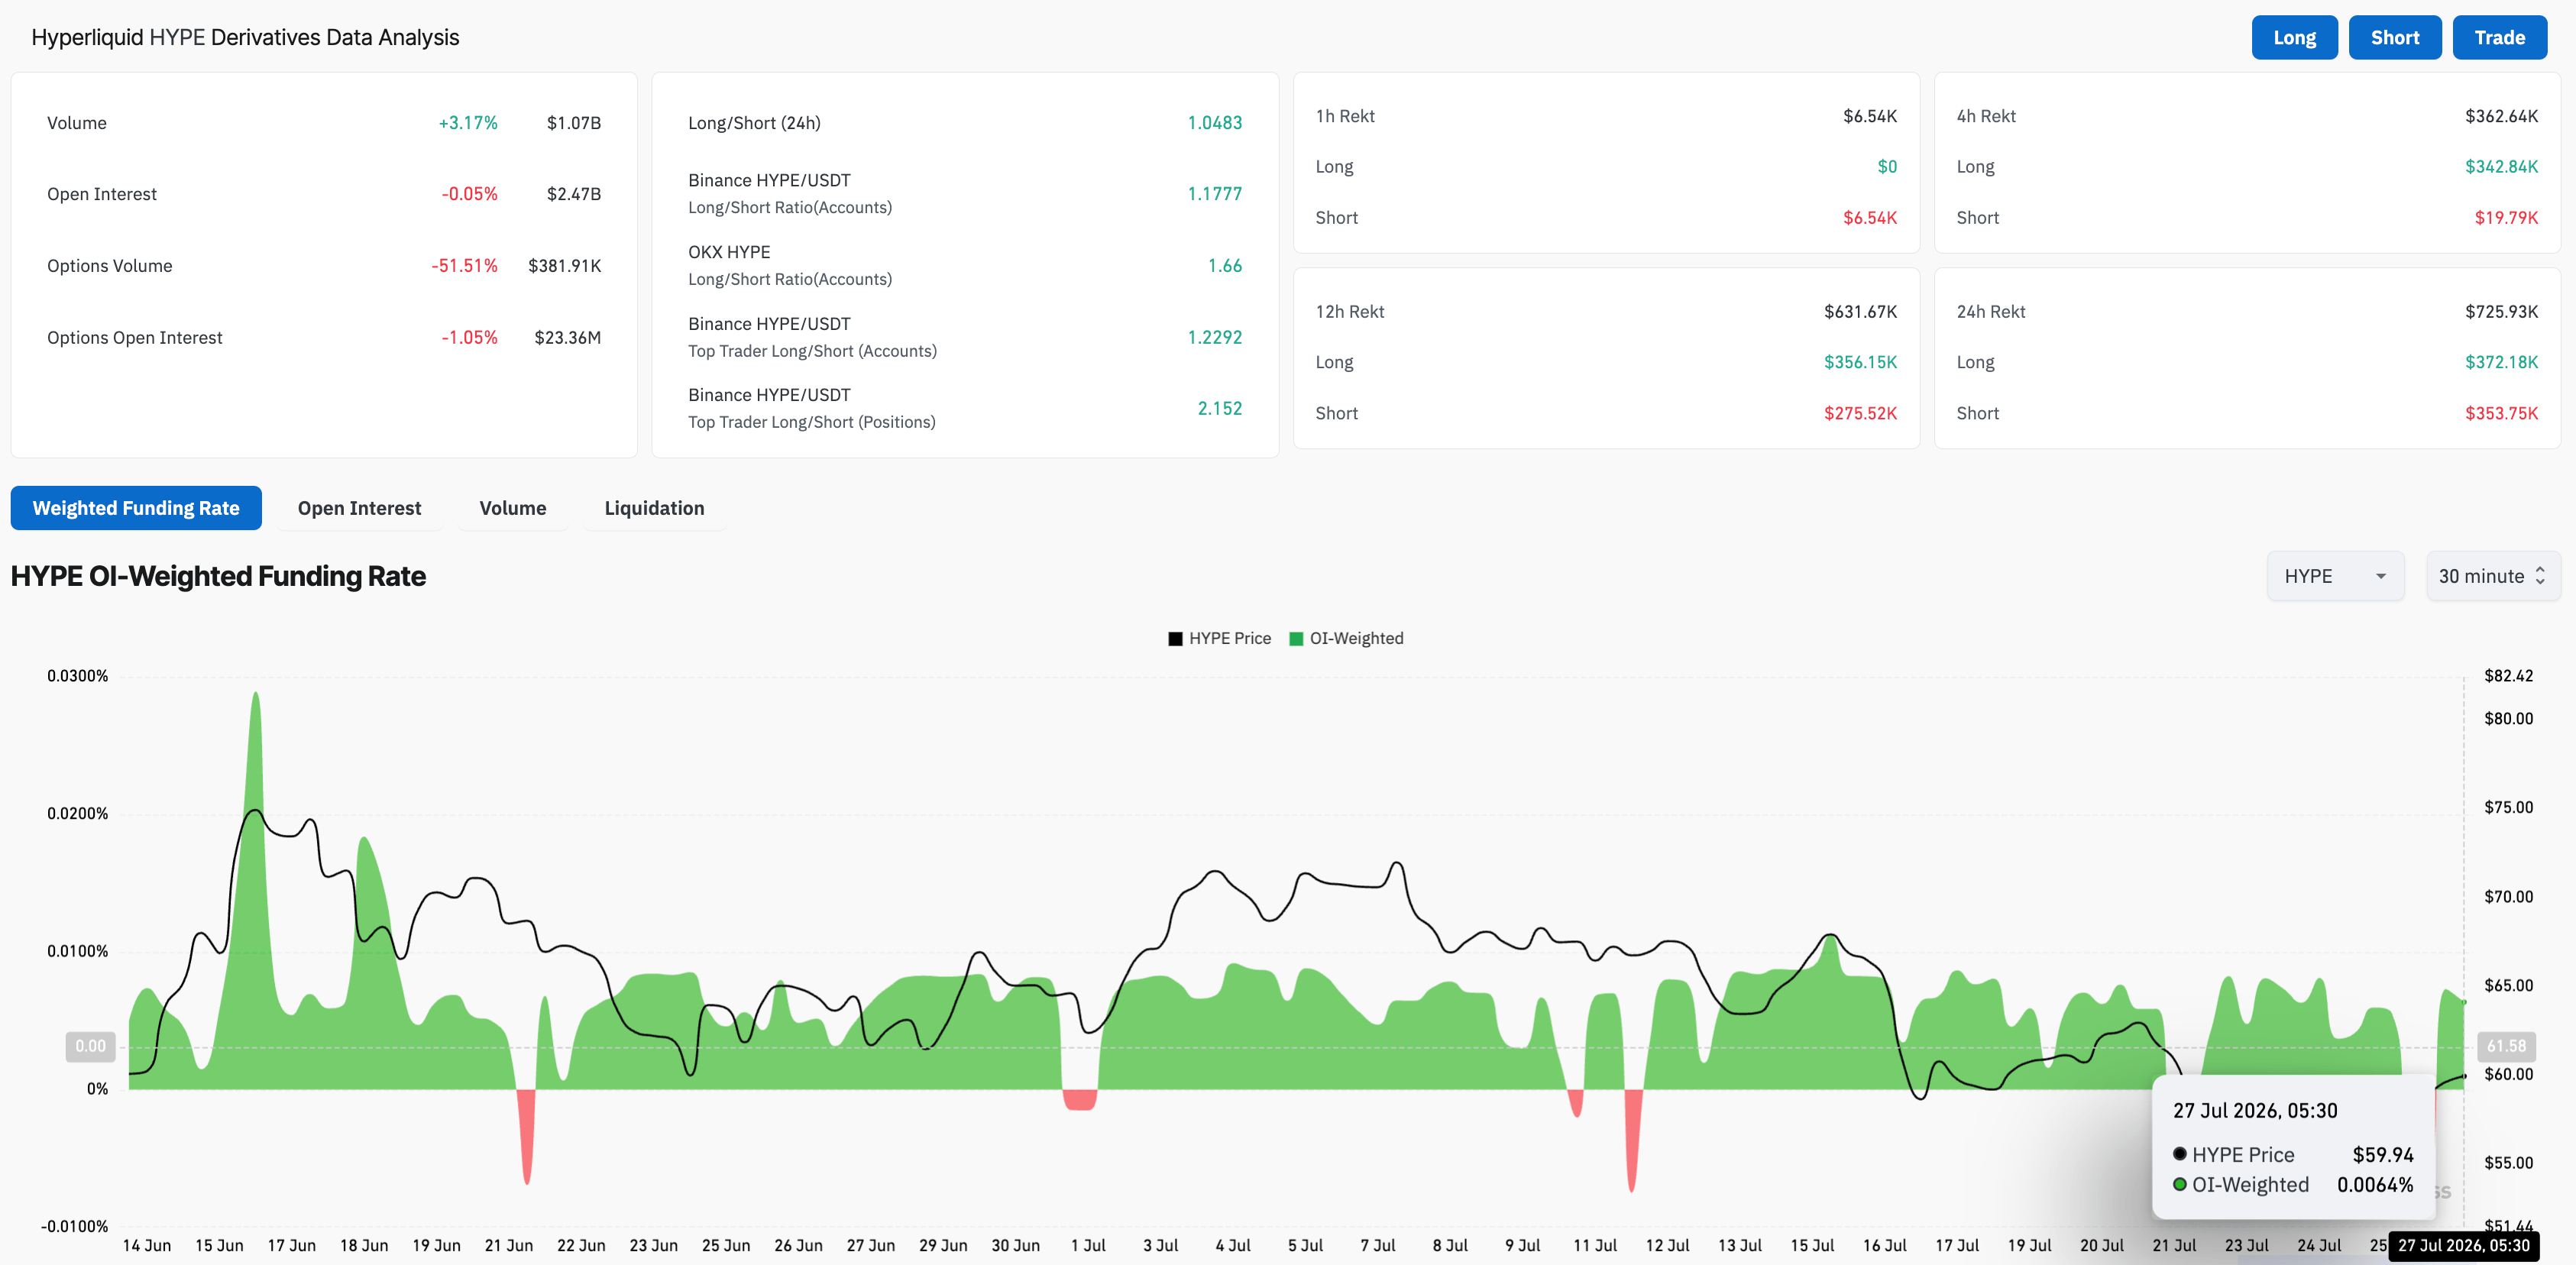
- Retail demand remains mixed as Open Interest holds steady around $2.47 billion with positive but fluctuating funding rates.
Hyperliquid (HYPE) edges higher toward $60 at press time on Monday, extending the mild recovery seen over the last two days. HYPE-focused Exchange Traded Funds (ETFs) witness a second consecutive weekly outflow reflecting weak institutional demand, while retail demand remains mixed. The technical outlook for HYPE is mixed as the mild recovery lacks firm bullish momentum.
HYPE lacks institutional and retail support
Hyperliquid is at risk of losing its retail strength as institutional demand wanes. SoSoValue data shows the HYPE ETFs recorded $8.61 million in outflows last week, following $7.26 million in outflows the previous week. Typically, consistent outflows weigh down on spot price and retail demand.
CoinGlass data shows that HYPE futures Open Interest (OI) has held steady at $2.47 billion over the last 24 hours, reflecting a stable buildup in positions as traders adopt a wait-and-see approach. At the same time, the long-to-short ratio of 1.04 indicates roughly equal active contracts on either side.
Still, the funding rate has dropped to 0.0038% from 0.0073% the previous day, reflecting an easing in bullish sentiment among traders.
Will HYPE extend gains above $60?
HYPE trades around $60.00 at press time on Monday, holding below the 50-day Exponential Moving Average (EMA) at $61.92 while remaining above the longer-term 200-day EMA near $50.78. From a technical perspective, HYPE maintains the near-term bearish bias within a broader constructive backdrop.
If price clears the 50-day EMA at $61.92, it could target the 78.6% Fibonacci retracement level, measured over the upswing from $38.17 to $76.93, at $68.64.
Momentum readings are subdued, with the Relative Strength Index (RSI) hovering around 44 below the midline as buyers lack strength. Meanwhile, the Moving Average Convergence Divergence (MACD) remains below its signal line in negative territory, but the contracting average lines hint at a potential bullish crossover.
On the downside, first support emerges at the 50% retracement at $57.55, ahead of the 200-day EMA at $50.78, where buyers would be expected to show more conviction if the correction extends.
(The technical analysis of this story was written with the help of an AI tool. Know more.)
Recommended Articles


