

Shiba Inu Price Forecast: Extends gains as on-chain and derivatives metrics confirm bullish bias

Source Fxstreet
  • Shiba Inu price extends gains on Tuesday after breaking above the descending trendline the previous day.
  • On-chain data shows holders are withdrawing SHIB tokens from exchanges, signaling reduced selling pressure.
  • Derivatives data supports a bullish bias as funding rates stay positive and long positions continue to rise.

Shiba Inu (SHIB) extends gains, trading above $0.0000042 on Tuesday after breaking above the descending trendline the previous day. Strengthening on-chain data and improving derivatives metrics support further gains for the meme coin. 

Exchange outflows signal declining selling pressure

CryptoQuant’s exchange netflow chart below shows five consecutive days of net outflows (red bar) since July 17. This indicates that traders are withdrawing SHIB from exchanges to their wallets, signaling reduced selling pressure, supporting a bullish outlook.

SHIB exchange netflow chart. Source: CryptoQuant

Derivatives metrics support a bullish bias

Derivatives data also supports a positive outlook for the meme coin. CoinGlass’ long-to-short ratio reads 1.02 on Tuesday. A ratio below 1 indicates bullish sentiment, as traders bet that asset prices will rise.
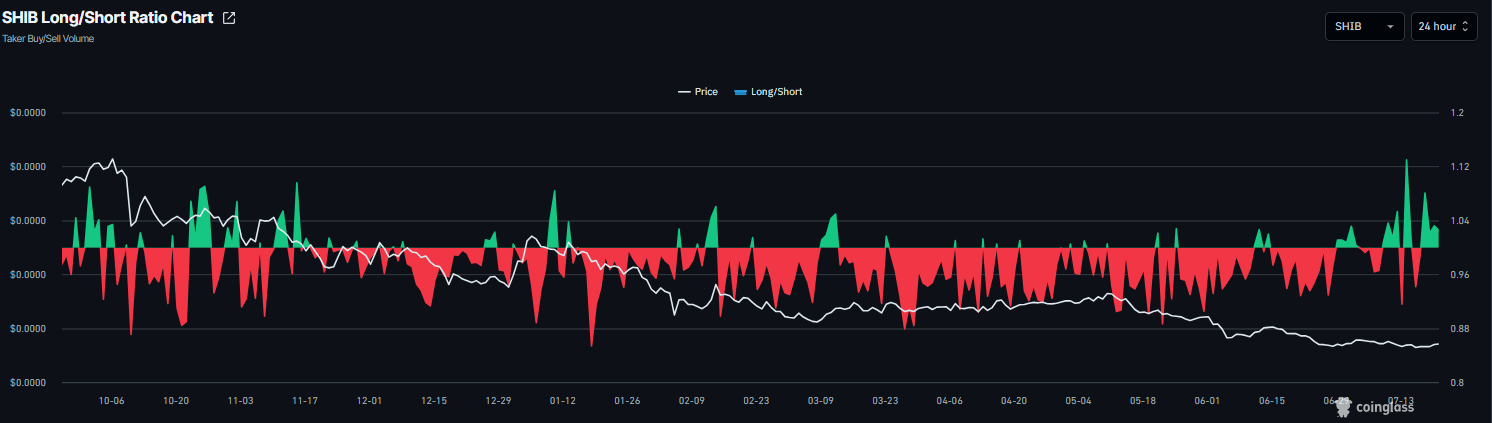
SHIB long-to-short ratio chart. Source: Coinglass

In addition, SHIB’s funding rates flipped positive on July 17 and have remained in bullish territory, with a reading of 0.0103% on Tuesday, indicating that longs are paying shorts and projecting bullish sentiment.
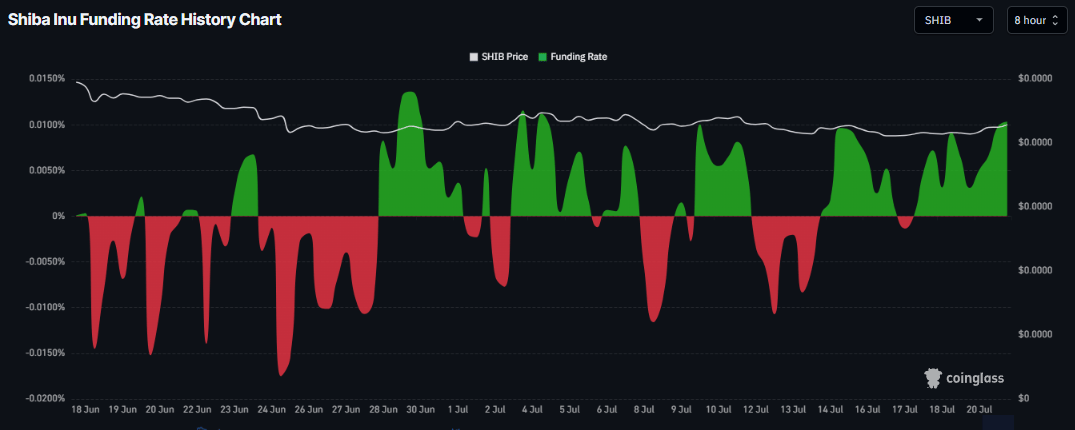
SHIB funding rates chart. Source: Coinglass

Shiba Inu Price Forecast: Breaks above the descending trendline

Shiba Inu price extends its gains, trading above $0.0000042 on Tuesday after breaking out of the descending trendline (drawn by connecting multiple highs since mid-May) the previous day.

If SHIB continues its recovery, it could extend the rally toward the next daily resistance at $0.0000045. A close above this could extend gains toward the 50-day Exponential Moving Average (EMA) at $0.0000045.

The Relative Strength Index (RSI) on the daily chart reads 45, trending toward the neutral 50 level and indicating fading bearish momentum. The Moving Average Convergence Divergence (MACD) indicator showed a bullish crossover, with rising green histogram bars, further supporting the positive outlook.
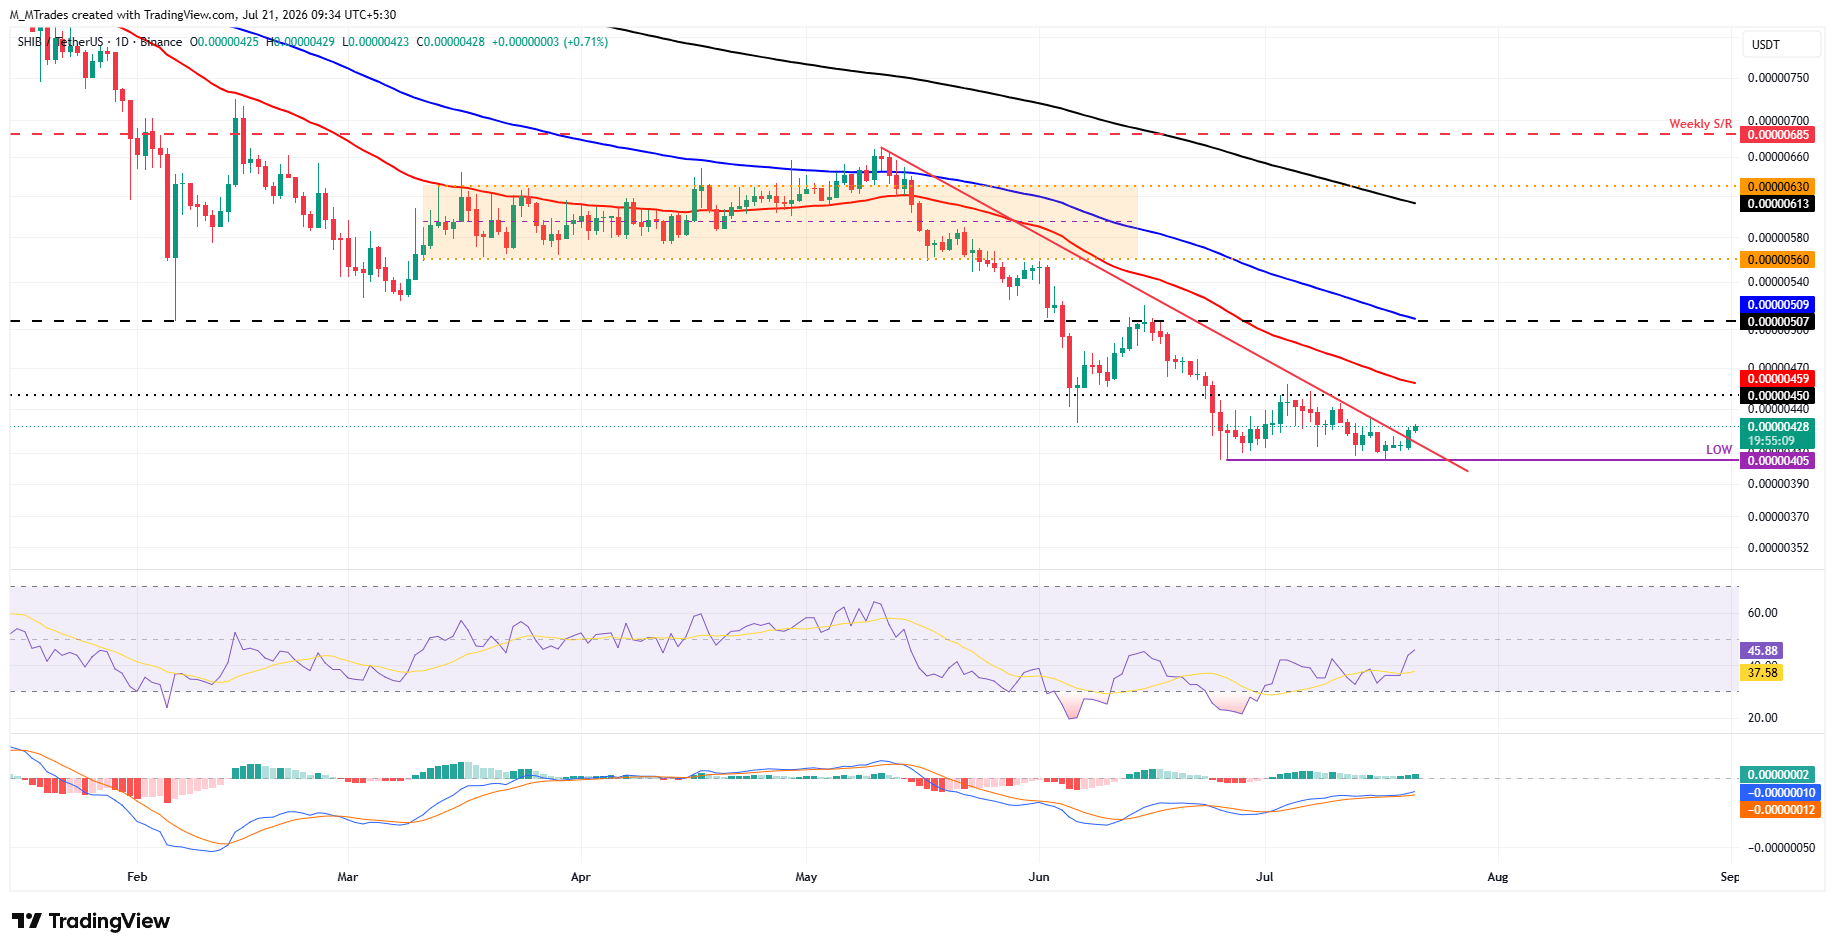
SHIB/USDT daily chart

However, if SHIB continues its correction, it could extend the decline toward the yearly low at $0.0000040.

Disclaimer: For information purposes only. Past performance is not indicative of future results.
placeholder
Pinduoduo Earnings Incoming: Morgan Stanley Sees Long-Term Profit Potential​Insights – On November 21, Chinese e-commerce giant Pinduoduo (PDD) will release its Q3 2024 earnings.
Author  Mitrade
Nov 20, 2024
​Insights – On November 21, Chinese e-commerce giant Pinduoduo (PDD) will release its Q3 2024 earnings.
placeholder
ECB Policy Outlook for 2026: What It Could Mean for the Euro’s Next MoveWith the ECB likely holding rates steady at 2.15% and the Fed potentially extending cuts into 2026, EUR/USD may test 1.20 if Eurozone growth proves resilient, but weaker growth and an ECB pivot could pull the pair back toward 1.13 and potentially 1.10.
Author  Mitrade
Dec 26, 2025
With the ECB likely holding rates steady at 2.15% and the Fed potentially extending cuts into 2026, EUR/USD may test 1.20 if Eurozone growth proves resilient, but weaker growth and an ECB pivot could pull the pair back toward 1.13 and potentially 1.10.
placeholder
Finding The Best Japan Stocks to Buy? These are Top Japanese Companies to Watch Discover the best Japanese stocks to buy, including AI semiconductor leaders, Buffett-backed trading houses, and undervalued Japan stocks benefiting from corporate reforms and yen trends.
Author  Mitrade
May 29, Fri
Discover the best Japanese stocks to buy, including AI semiconductor leaders, Buffett-backed trading houses, and undervalued Japan stocks benefiting from corporate reforms and yen trends.
placeholder
Gold slides back closer to $4,050 as Iran risks and Fed hike bets boost USDGold (XAU/USD) opens with a modest bearish gap at the start of a new week and slides back closer to the $4,050 level during the Asian session.
Author  FXStreet
Jul 13, Mon
Gold (XAU/USD) opens with a modest bearish gap at the start of a new week and slides back closer to the $4,050 level during the Asian session.
placeholder
WTI surges above $83.00 amid escalating US-Iran conflictWest Texas Intermediate (WTI) oil price opened at a bullish gap, trading around $83.50 per barrel during the Asian hours on Monday.
Author  FXStreet
Yesterday 01: 34
West Texas Intermediate (WTI) oil price opened at a bullish gap, trading around $83.50 per barrel during the Asian hours on Monday.
goTop
quote