


Crypto Today: Bitcoin, Ethereum, XRP slip as US-Iran escalating hostilities pressure risk assets
- Bitcoin declines toward $64,000 amid escalating US-Iran strikes in the Middle East.
- Ethereum remains range-bound between the 50-day and 100-day EMAs.
- XRP struggles to gain momentum, with the upside capped below $1.10 and a deteriorating technical structure.
Cryptocurrency prices remain under pressure on Monday, as Bitcoin (BTC) falls toward $64,000. Altcoins, including Ethereum (ETH) and Ripple (XRP), uphold a weakening technical structure. ETH is trading sideways between support at $1,826 and resistance at $1,937. Meanwhile, XRP hovers below the pivotal $1.10 level, edging lower toward the primary $1.00 support.
US-Iran war persists weighing on risk assets
The United States (US) and Iran escalated hostilities over the weekend, intensifying military tensions across the region. The US military confirmed a ninth consecutive night of strikes targeting Iranian command centers, defense installations, communication hubs, and missile sites.
Iran retaliated by striking US military assets in Kuwait and Bahrain, while the Islamic Revolutionary Guard Corps reported two oil tankers attempting an unsafe passage through the Strait of Hormuz were disabled following explosions.
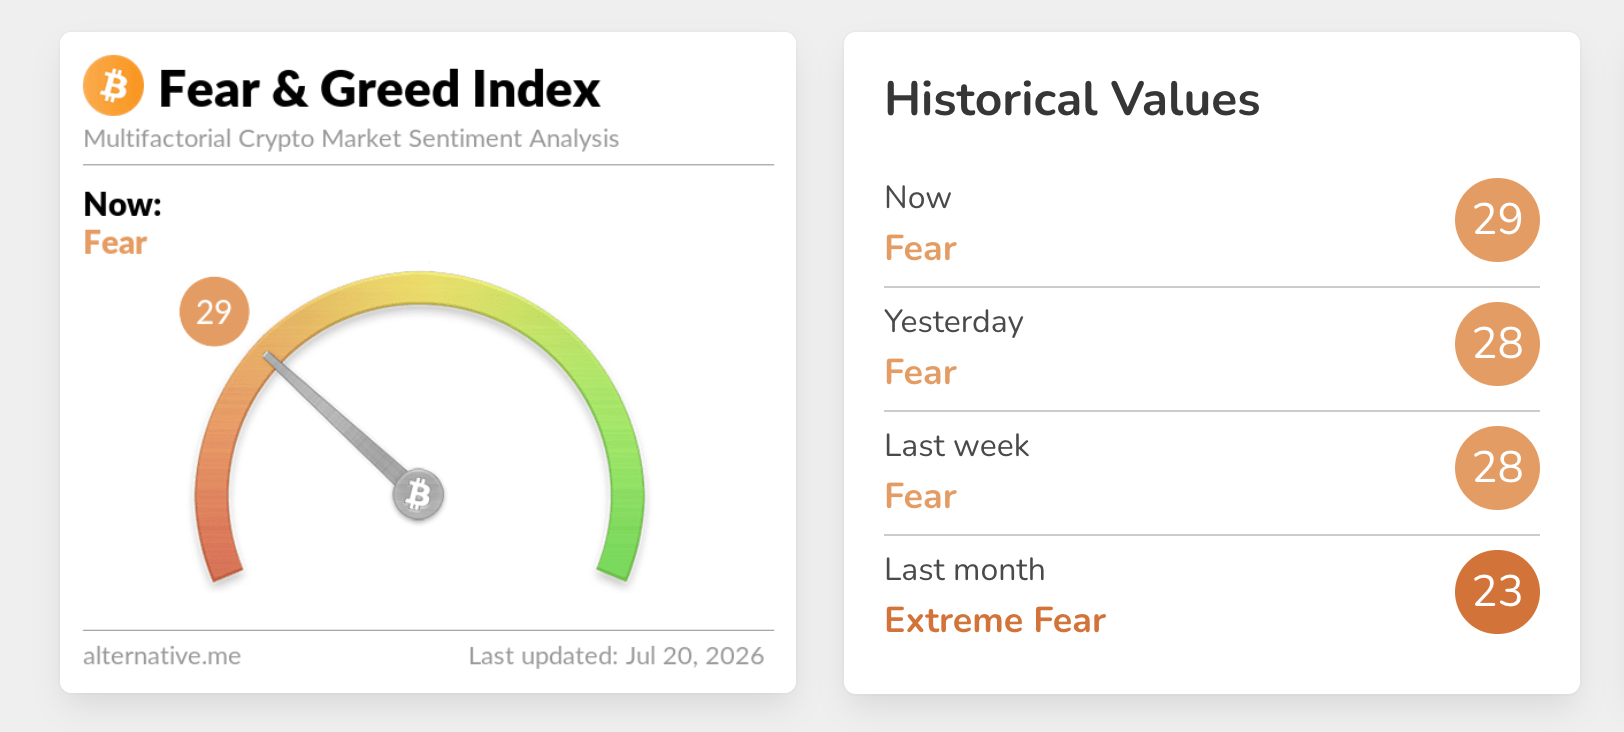
The Crypto Fear & Greed Index edged up to 29 on Friday, shifting out of Extreme Fear and signaling a cautious uptick in market sentiment. This gradual improvement in risk appetite underscores the persistent US-Iran attacks.
Price analysis: Bitcoin's short-term outlook stays bearish
Bitcoin trades above 64,000, retaining a capped bias as it holds below the key moving averages. The 50-day Exponential Moving Average (EMA) at $65,002 and the Parabolic SAR at $65,420 sit just overhead, reinforcing near-term upside friction, while the 100-day and 200-day EMAs at $68,127 and $74,008 respectively outline a broader bearish structure.
Meanwhile, momentum is more constructive, with the Moving Average Convergence Divergence (MACD) remaining in positive territory and the Relative Strength Index (RSI) hovering slightly above the midline, hinting at mild buying pressure that has yet to overcome the stacked resistance band.
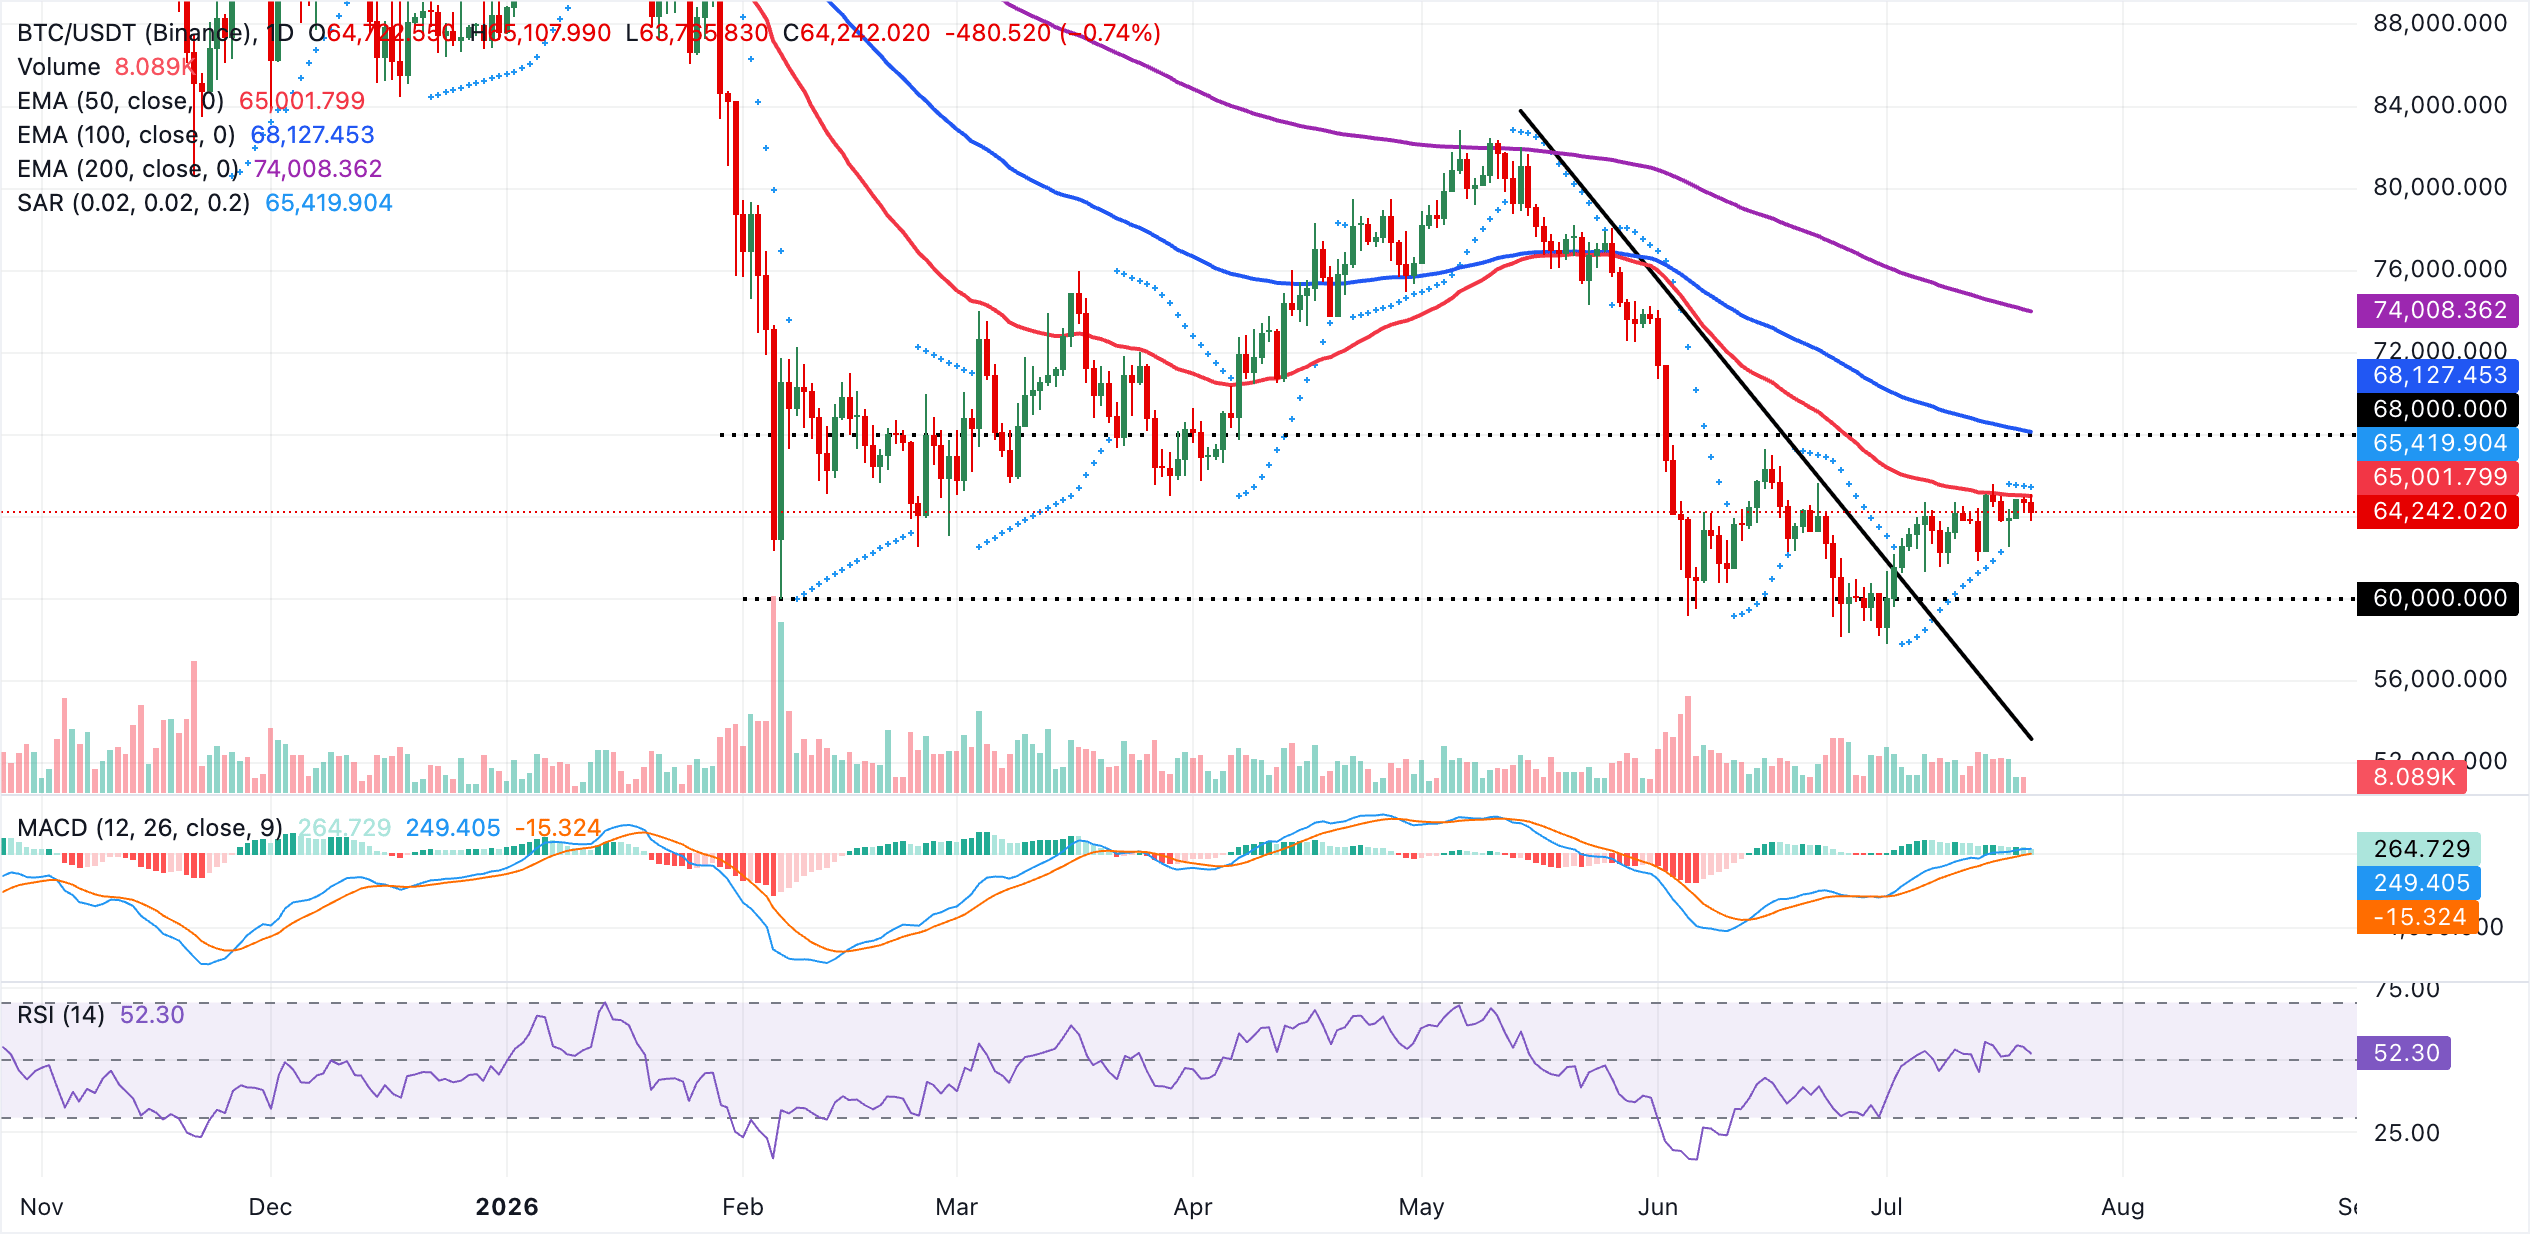
On the topside, immediate resistance is clustered between the 50-day EMA at $65,002 and the Parabolic SAR at $65,420, and a daily close above this band would be needed to open the way toward the 100-day EMA at $68,127 and then the 200-day EMA near $74,008. On the downside, structural support is traced back to the broken descending trendline region around $52,994, where a deeper correction could look for buying interest if the current consolidation resolves lower, though that zone remains distant from present price action.
Altcoins outlook: Ethereum and XRP extend consolidation
Ethereum trades at $1,865, holding above the 50-day EMA at around $1,817 while still capped below the 100-day EMA near $1,937. This configuration, alongside a Parabolic SAR reading at roughly $1,826, suggests the pair retains a cautious constructive tone as it respects nearby trend-following support but has yet to retake its broader medium-term moving-average barrier.
The RSI hovers around 59, hinting at mildly positive momentum without entering overbought territory, while the MACD histogram remains positive, reinforcing a modest bullish bias so long as price sustains above the nearest support band.
-1784537307461.png)
On the topside, initial resistance appears at the 100-day EMA around $1,937, and a sustained break above this level would expose the more distant 200-day EMA near $2,178 as the next significant hurdle for buyers. On the downside, immediate support is seen around the current pivot area near $1,865, with additional demand emerging from the Parabolic SAR zone at about $1,826 and the 50-day EMA clustered close by near $1,818. A daily close below this confluence would weaken the current constructive bias and open the door to a deeper corrective phase.
XRP holds below the key moving averages , with the 50-day EMA around $1.15, the 100-day EMA near $1.24 and the 200-day EMA closer to $1.45, keeping the broader tone bearish despite the recent rebound. The Parabolic SAR at roughly $1.06 now trails price on the downside, suggesting that while downside pressure dominates, the immediate trend has stabilised, a view mildly reinforced by a slightly positive MACD reading and a RSI hovering just below the midline.
-1784537431713.png)
Initial resistance lies at the 50-day EMA near $1.15, and a break above this level would expose the 100-day EMA around $1.24, with the 200-day EMA near $1.45 acting as a more distant cap. On the downside, the Parabolic SAR offers initial support around $1.06. A decisive drop below this trailing level would reopen the path toward lower lows, while holding above it would keep XRP consolidating beneath the EMA cluster.
(The technical analysis of this story was written with the help of an AI tool. Know more.)
Bitcoin, altcoins, stablecoins FAQs
Bitcoin is the largest cryptocurrency by market capitalization, a virtual currency designed to serve as money. This form of payment cannot be controlled by any one person, group, or entity, which eliminates the need for third-party participation during financial transactions.
Altcoins are any cryptocurrency apart from Bitcoin, but some also regard Ethereum as a non-altcoin because it is from these two cryptocurrencies that forking happens. If this is true, then Litecoin is the first altcoin, forked from the Bitcoin protocol and, therefore, an “improved” version of it.
Stablecoins are cryptocurrencies designed to have a stable price, with their value backed by a reserve of the asset it represents. To achieve this, the value of any one stablecoin is pegged to a commodity or financial instrument, such as the US Dollar (USD), with its supply regulated by an algorithm or demand. The main goal of stablecoins is to provide an on/off-ramp for investors willing to trade and invest in cryptocurrencies. Stablecoins also allow investors to store value since cryptocurrencies, in general, are subject to volatility.
Bitcoin dominance is the ratio of Bitcoin's market capitalization to the total market capitalization of all cryptocurrencies combined. It provides a clear picture of Bitcoin’s interest among investors. A high BTC dominance typically happens before and during a bull run, in which investors resort to investing in relatively stable and high market capitalization cryptocurrency like Bitcoin. A drop in BTC dominance usually means that investors are moving their capital and/or profits to altcoins in a quest for higher returns, which usually triggers an explosion of altcoin rallies.
Recommended Articles


