


Tron Price Forecast: Institutional accumulation fails to lift TRX
- Tron price extends its correction on Tuesday, approaching the key technical support around $0.317.
- Tron Inc. continues accumulating TRX tokens, lifting its total treasury holdings to over 702.9 million TRX.
- Weakening derivatives metrics, with falling open interest and rising short positions, cap TRX's upside.
Tron (TRX) extends its decline, trading below $0.330 on Tuesday, drifting toward the key technical support zone. Despite the recent price dip, Tron Inc. (TRON) continued to accumulate, expanding its treasury to more than 702.9 million TRX. However, weakening derivatives metrics suggest traders remain cautious, capping the potential upside move for TRX.
Tron Inc. buys the dips
Tron Inc. announced in its X post that the firm acquired 152,867 TRX tokens on Monday, bringing the total reserve to 702.9 million TRX. The firm has been steadily accumulating TRX since last week.
“The company aims to further grow its Tron Digital Asset Treasury (DAT) holdings to enhance long-term shareholder value,” said TRON in its X post.
If these accumulations continue and grow, they could support the native token TRX in the long term by enhancing adoption and reducing circulating supply, thereby increasing its price. However, in the short term, they failed to lift traders' sentiment and TRX prices.
Derivatives metrics cap TRX recovery
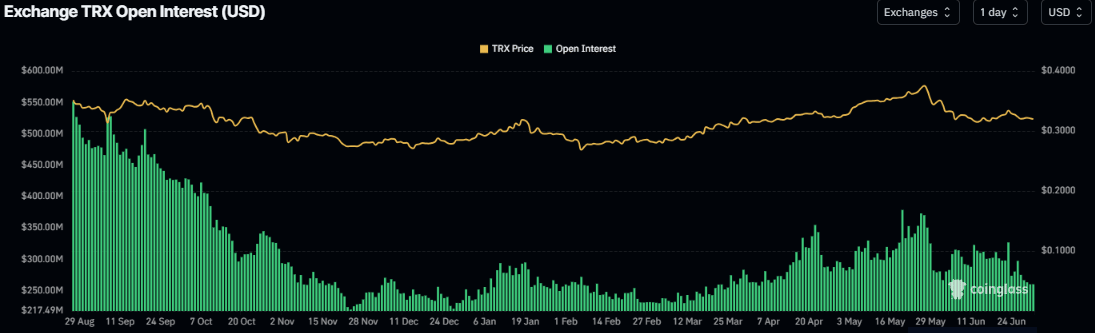
On the derivatives side, metrics support a bearish bias. Tron’s futures Open Interest (OI) dropped to $260 million on Tuesday and has been continuously falling since the end of May. This drop in OI reflects waning investor participation and projects a bearish outlook.
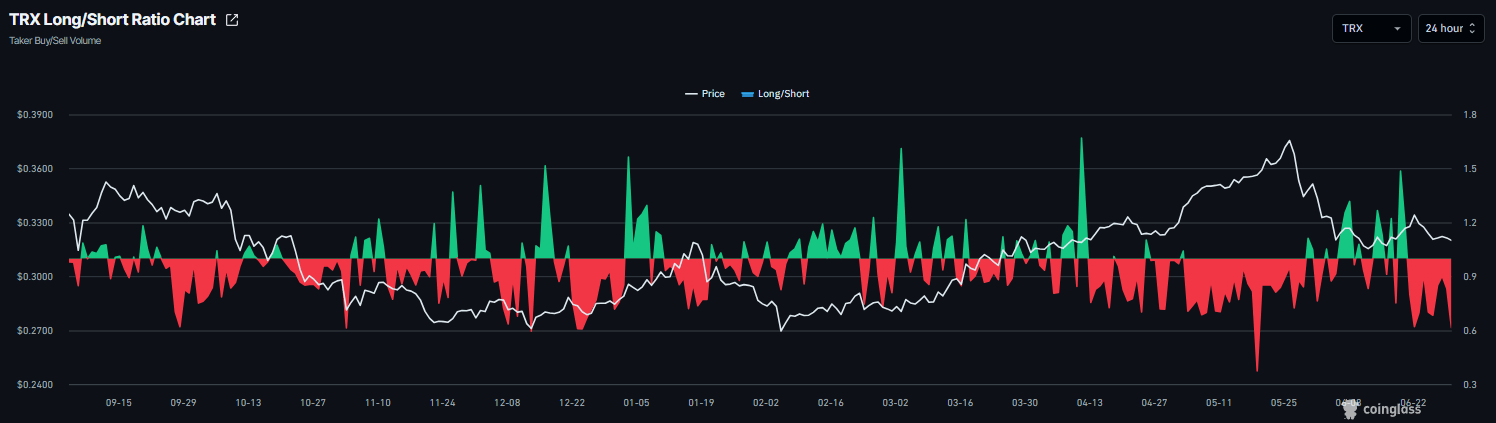
In addition, CoinGlass’ long-to-short ratio for TRX read 0.61 on Tuesday, nearing the lowest level over a month. The ratio below one suggested that traders are betting on the asset price to fall.
Tron Price Forecast: Nears key support zone
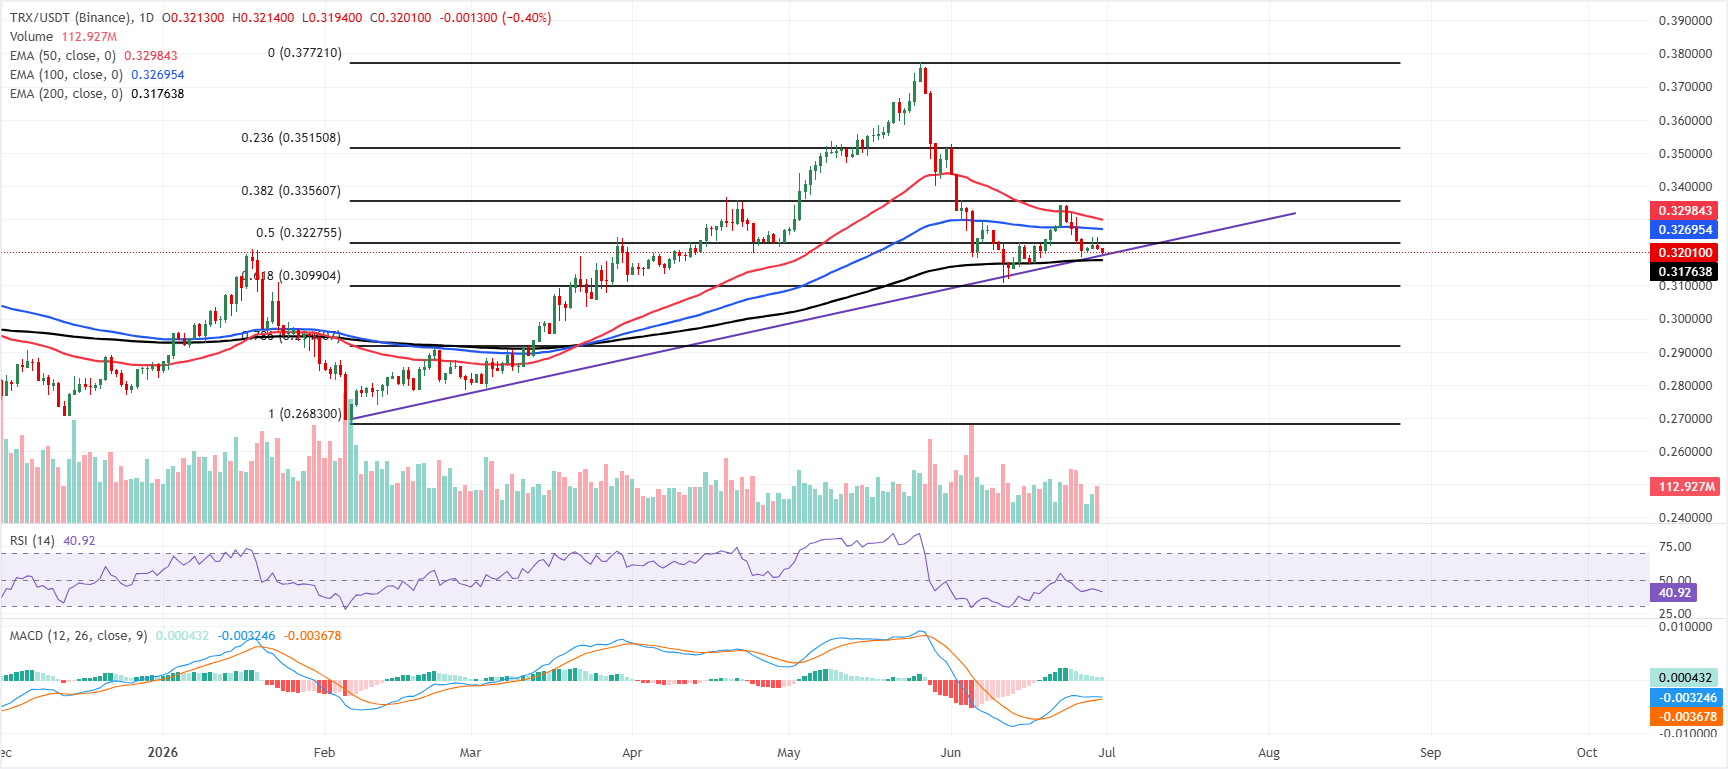
Tron price extends its correction, trading below $0.330 on Tuesday after a mild correction the previous day. TRX maintains a mildly bearish near-term bias, holding just above the broken upward trendline support around $0.319 and the 200-day Exponential Moving Average (EMA) at $0.317, while remaining capped by the 50% retracement at $0.322.
The Relative Strength Index (RSI) near 40 suggests subdued bullish momentum, and the Moving Average Convergence Divergence (MACD) hovers slightly above zero with a modest positive line reading, hinting at fading upside pressure rather than a decisive recovery.
On the downside, immediate support is seen at the trendline break near $0.319, followed by the 200-day EMA at $0.317, with a deeper floor at the 61.8% Fibonacci retracement at $0.309.
On the topside, initial resistance comes at the 50% retracement at $0.322, ahead of a confluence of the 100-day EMA at $0.327 and the 50-day EMA at $0.329. In comparison, stronger supply is located at the 38.2% Fibonacci retracement near $0.335 and the 23.6% Fibonacci retracement level around $0.351, which would need to be reclaimed to negate the current capped tone.
(The technical analysis of this story was written with the help of an AI tool.)
Recommended Articles


