


VanEck BNB spot ETF goes live but fails to lift BNB as broader risk-off sentiment dominates
- VanEck has launched the VanEck BNB ETF, offering regulated exposure to the spot BNB price.
- The ETF, trading under the ticker VBNB on NASDAQ, does not offer staking rewards.
- BNB sustains losses, declining for a third consecutive day amid growing risk-off sentiment in the broader crypto market.
VanEck launched the VanEck BNB ETF on Thursday, providing access to Binance’s native token BNB. The spot Exchange-Traded Fund (ETF) has been listed on NASDAQ under the ticker VBNB.
VanEck BNB ETF taps US regulated traditional finance market
The VanEck BNB ETF is the first ever to offer regulated exposure to the spot BNB price via a United States (US)-based stock exchange. VanEck stated that the “Trust’s investment objective is to reflect the performance of the price of BNB.”
VanEck ETF will hold BNB but will not stake the tokens immediately to earn rewards. However, the company has the mandate to decide at a later date to stake all or a portion of the holdings through third-party players.
Therefore, investors seeking exposure to BNB through VanEck will forego staking rewards until the asset management company issues an official communication indicating it will commence staking activities.
Price analysis: BNB remains pressured amid low retail interest
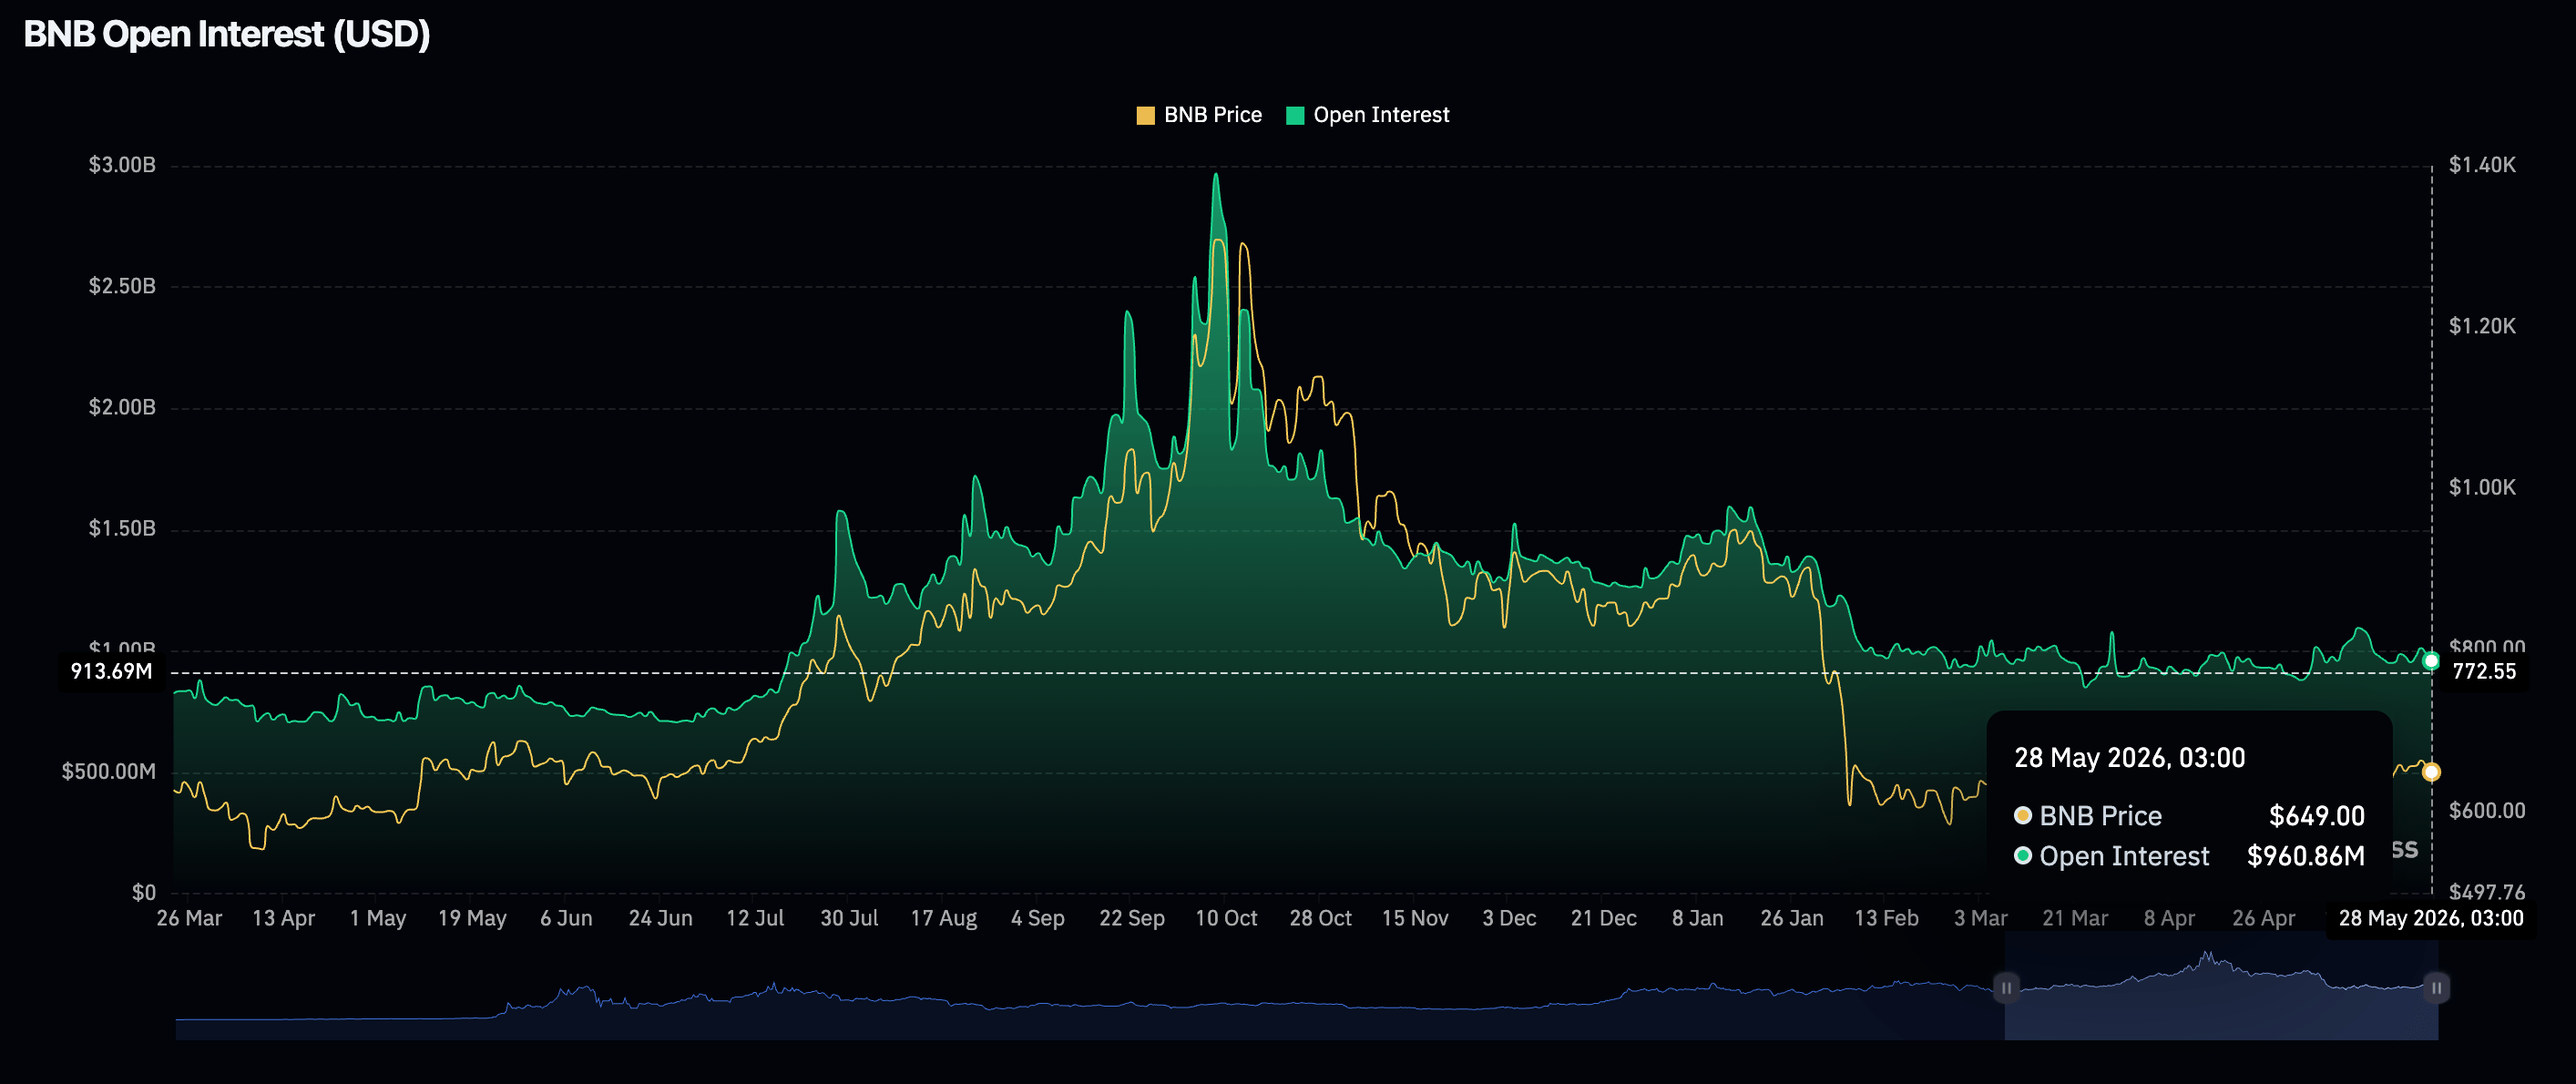
Risk appetite for BNB remains significantly subdued despite the VanEck BNB ETF going live on NASDAQ. The perpetual futures Open Interest (OI), which has cooled to roughly $961 million on Thursday from nearly $1 billion the day before, aligns with the broader crypto market's risk-averse sentiment. Investors are increasingly closing their positions while avoiding opening new ones, raising the odds of a persistent sell-off.
Meanwhile, BNB trades near $635, keeping a bearish near-term tone as it sits below a dense band of moving average resistance. The 50-period Exponential Moving Average (EMA) at $645, the Bollinger middle band near $657 and the 100-period EMA around $663 all hover above spot, suggesting rallies are likely to be capped for now.
Momentum has faded, with the Moving Average Convergence Divergence (MACD) histogram below its zero line and the Relative Strength Index (RSI) hovering just below the 50 mark, hinting that downside pressure remains dominant despite recent volatility compression inside the Bollinger envelope.
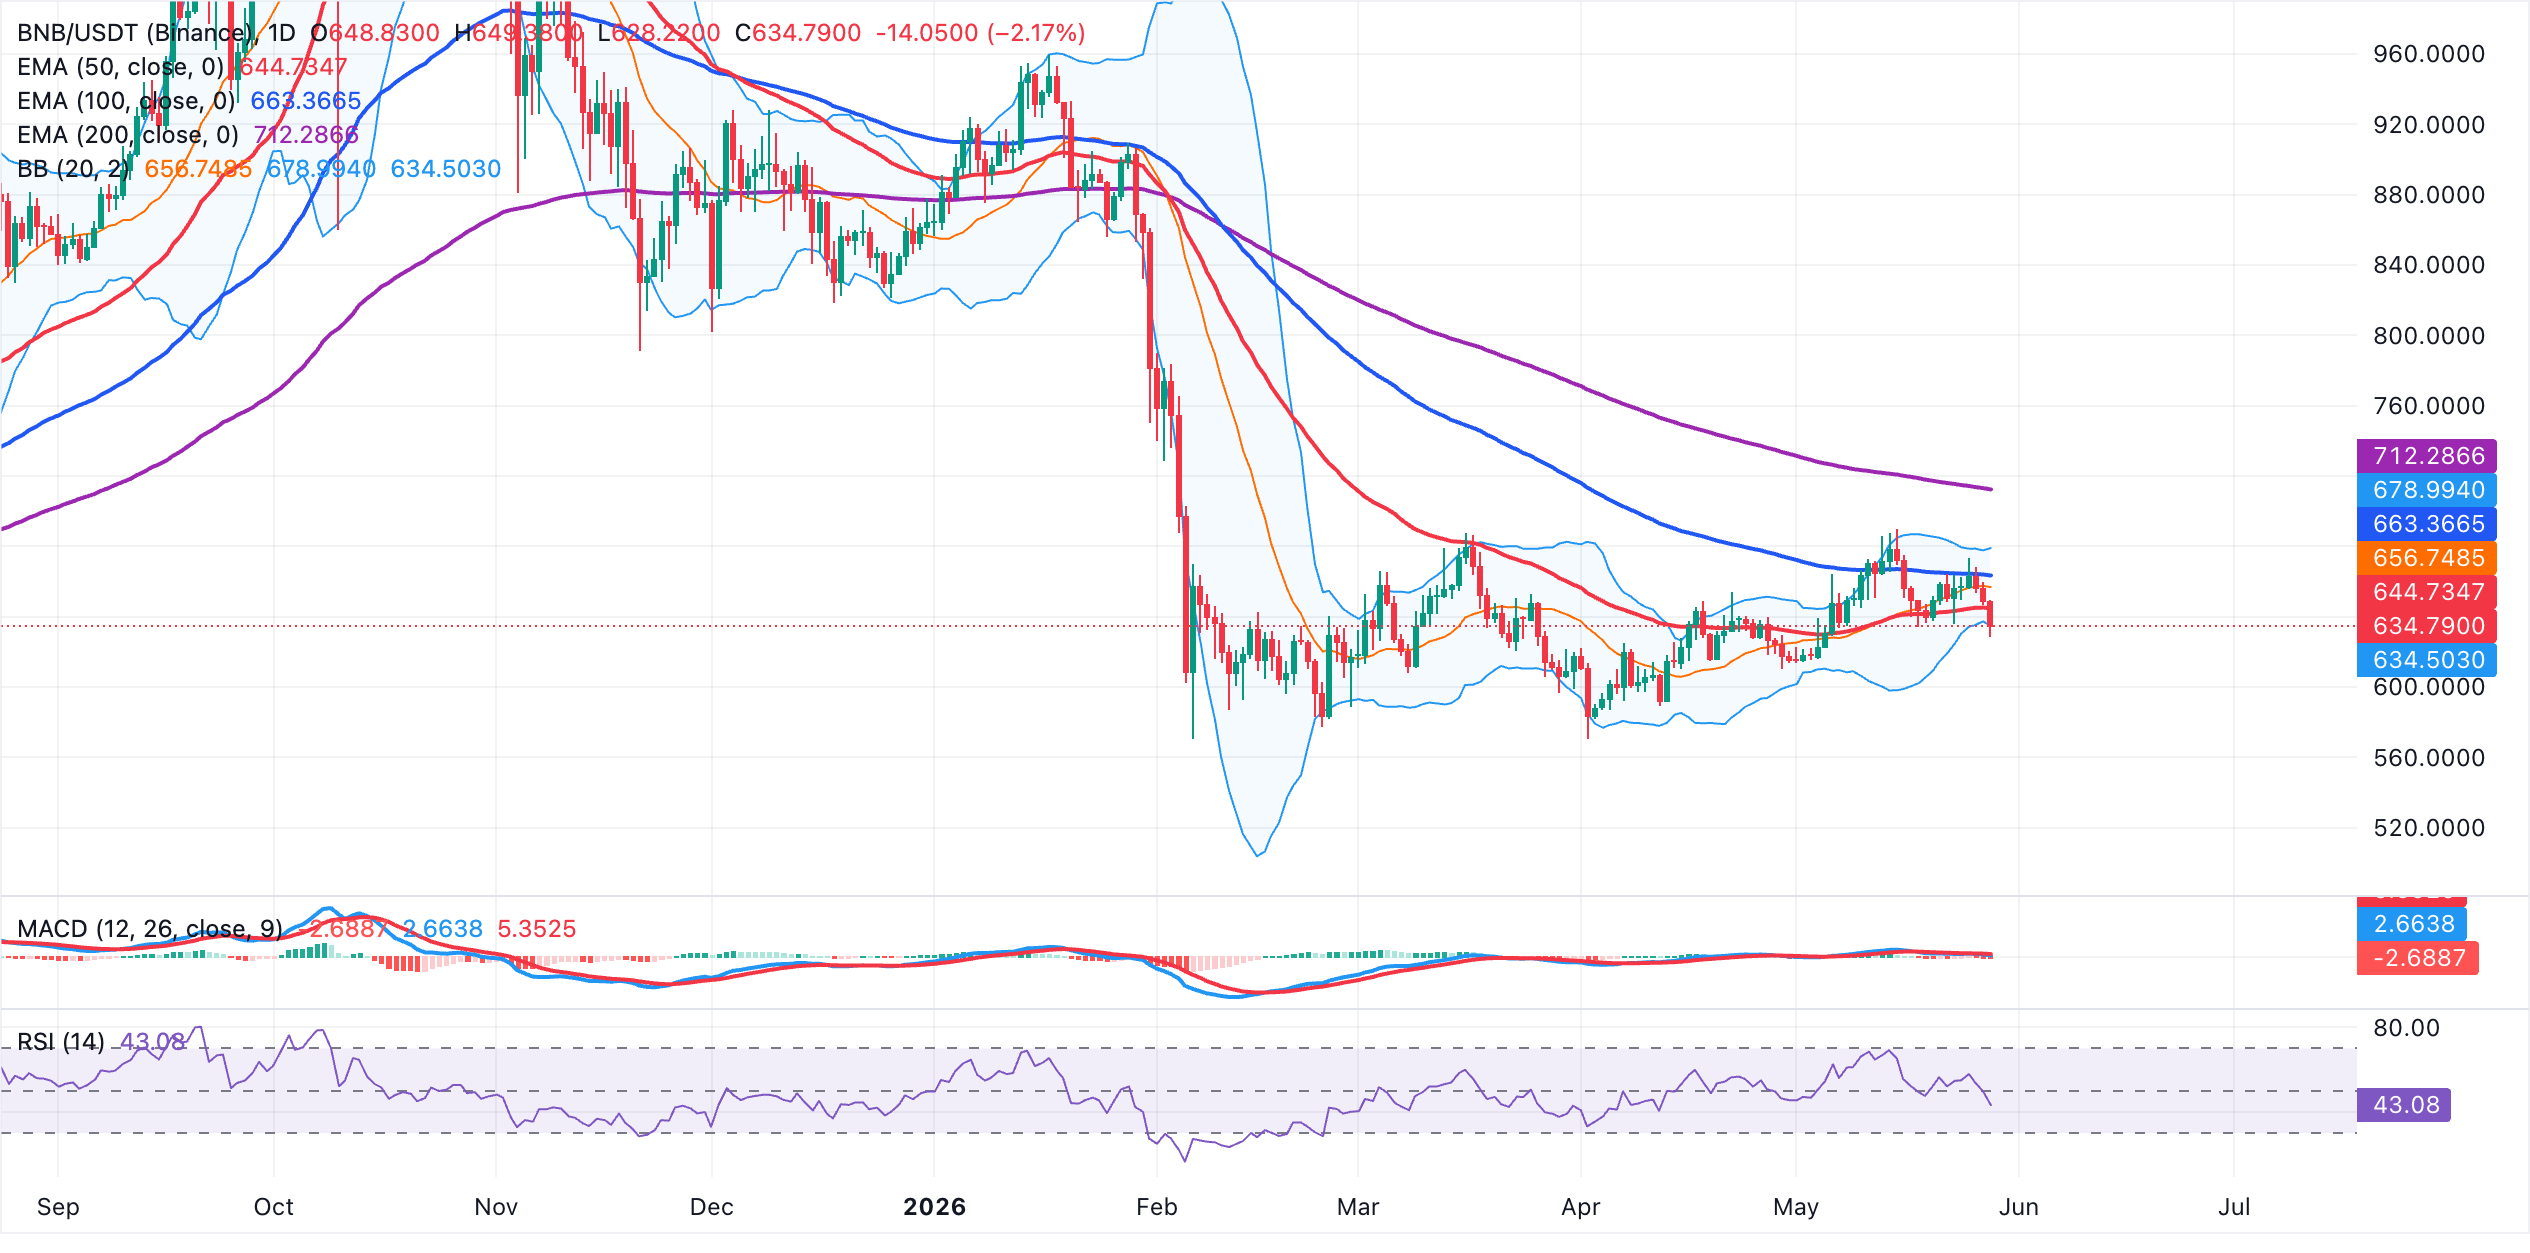
On the downside, initial support aligns with the Bollinger lower band at roughly $634, just under the current price, where a daily close below would open the door toward lower levels. On the topside, immediate resistance is seen at the 50-period EMA around $645, followed by the Bollinger middle band near $657 and the 100-period EMA at about $663. A sustained break above these successively higher hurdles would ease the current bearish bias and allow BNB to challenge the upper Bollinger band near $679 and eventually the longer-term 200-day EMA around $712
(The technical analysis of this story was written with the help of an AI tool.)
Open Interest, funding rate FAQs
Higher Open Interest is associated with higher liquidity and new capital inflow to the market. This is considered the equivalent of increase in efficiency and the ongoing trend continues. When Open Interest decreases, it is considered a sign of liquidation in the market, investors are leaving and the overall demand for an asset is on a decline, fueling a bearish sentiment among investors.
Funding fees bridge the difference between spot prices and prices of futures contracts of an asset by increasing liquidation risks faced by traders. A consistently high and positive funding rate implies there is a bullish sentiment among market participants and there is an expectation of a price hike. A consistently negative funding rate for an asset implies a bearish sentiment, indicating that traders expect the cryptocurrency’s price to fall and a bearish trend reversal is likely to occur.
Recommended Articles


