


Dogecoin flashes early reversal signal as short sellers capitulate
- Dogecoin extends gains on Wednesday, holding above its 100-day EMA at $0.1064.
- Derivatives data flashes early signals of a bullish reversal, as short liquidations have risen over the last 4 hours.
- The technical outlook for DOGE is cautiously optimistic, targeting the 200-day EMA at $0.1224 to extend the rally.
Dogecoin (DOGE) edges higher on Wednesday after two consecutive days of losses earlier this week. The recovery aligns with the rise in short liquidations over the last 4 hours across the crypto market, signaling a potential upside shift. Dogecoin should clear above its 200-day Exponential Moving Average (EMA) at $0.1224 for further gains.
Dogecoin regains strength amid early signals of a bullish flip
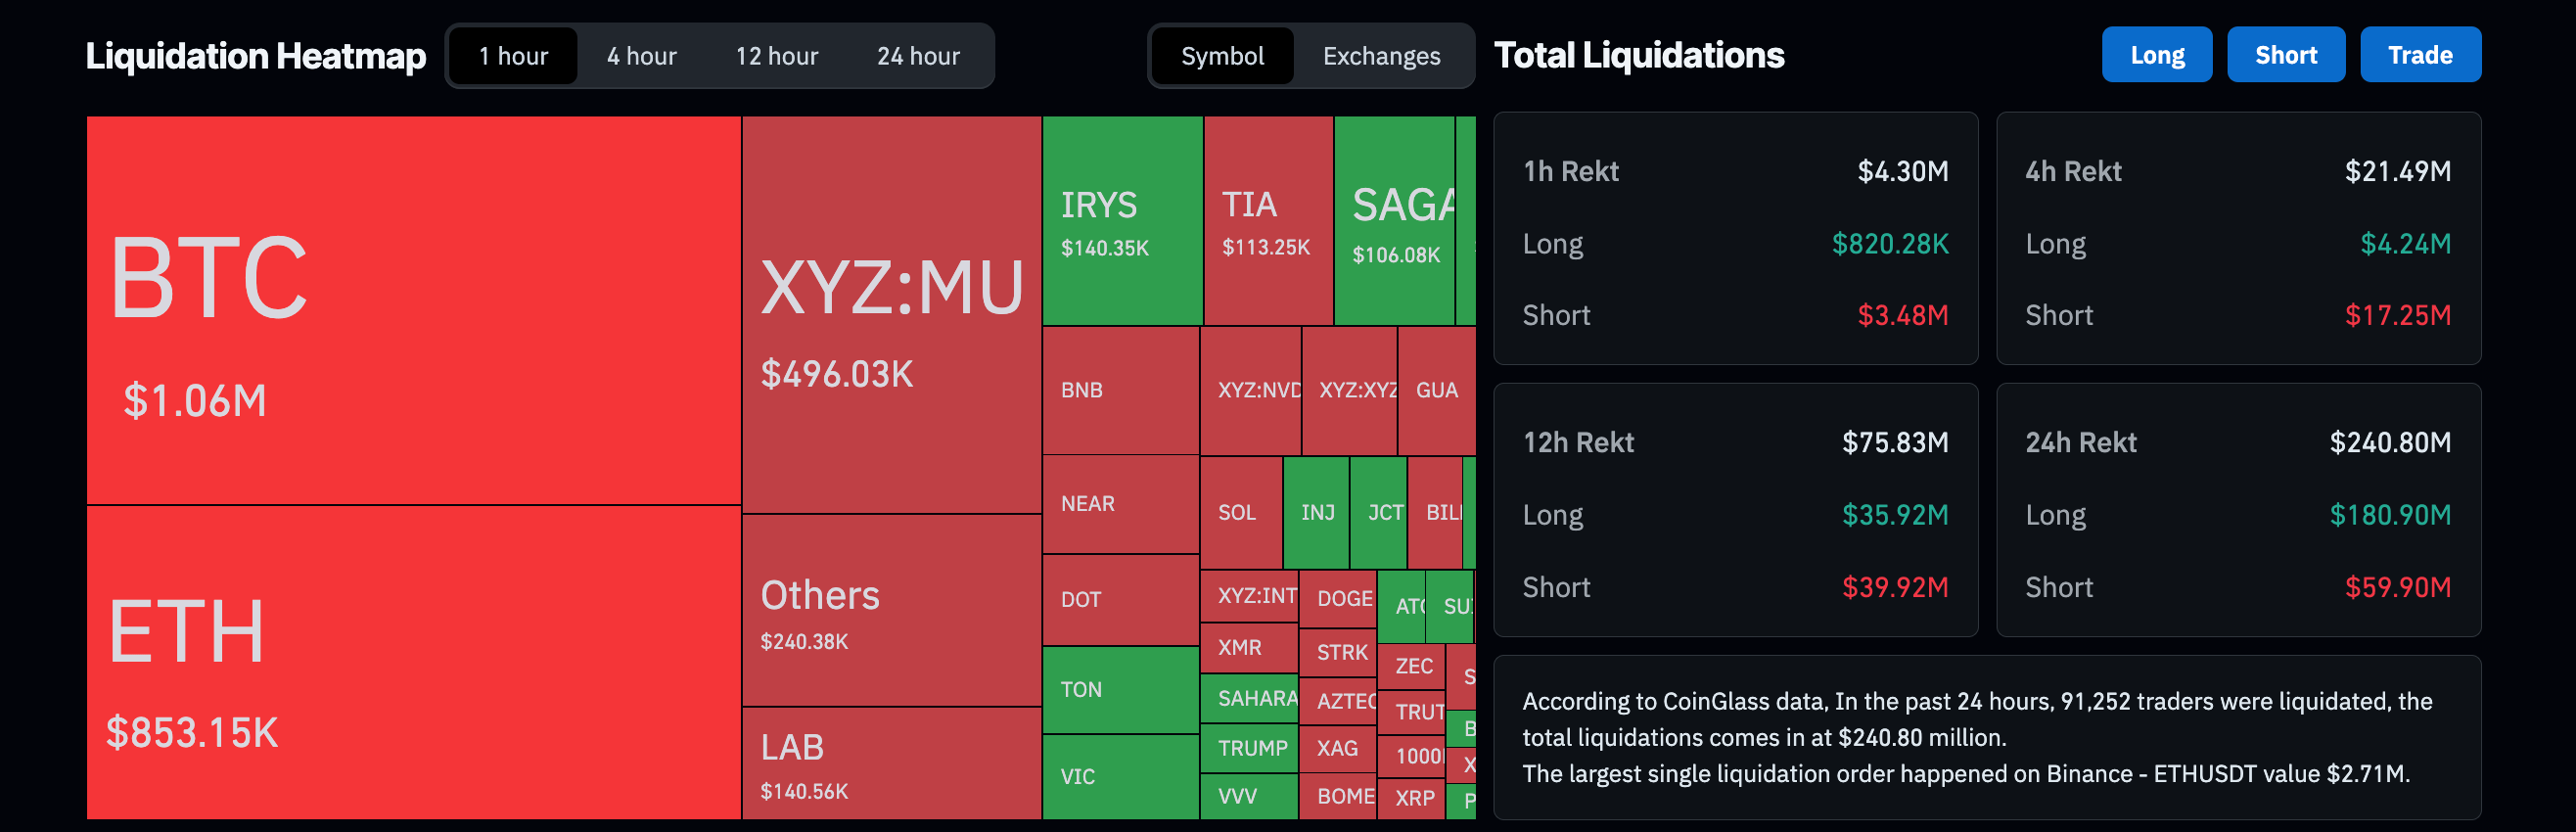
The crypto market's risk-on sentiment improved on Wednesday as short-term bulls began to dominate derivatives markets. CoinGlass data shows that total liquidations of $240 million over 24 hours are driven by $180 million in long liquidations, consistent with Tuesday’s decline.
However, the last 4 hours of liquidations of $21 million were led by $17 million of short liquidations, suggesting a short-term rebound. Typically, these shorter-term recoveries are a cool-off period after overselling. Still, the broader market recovery, with Bitcoin holding above $80,000 amid Trump’s visit to China, could lead to an extended recovery.
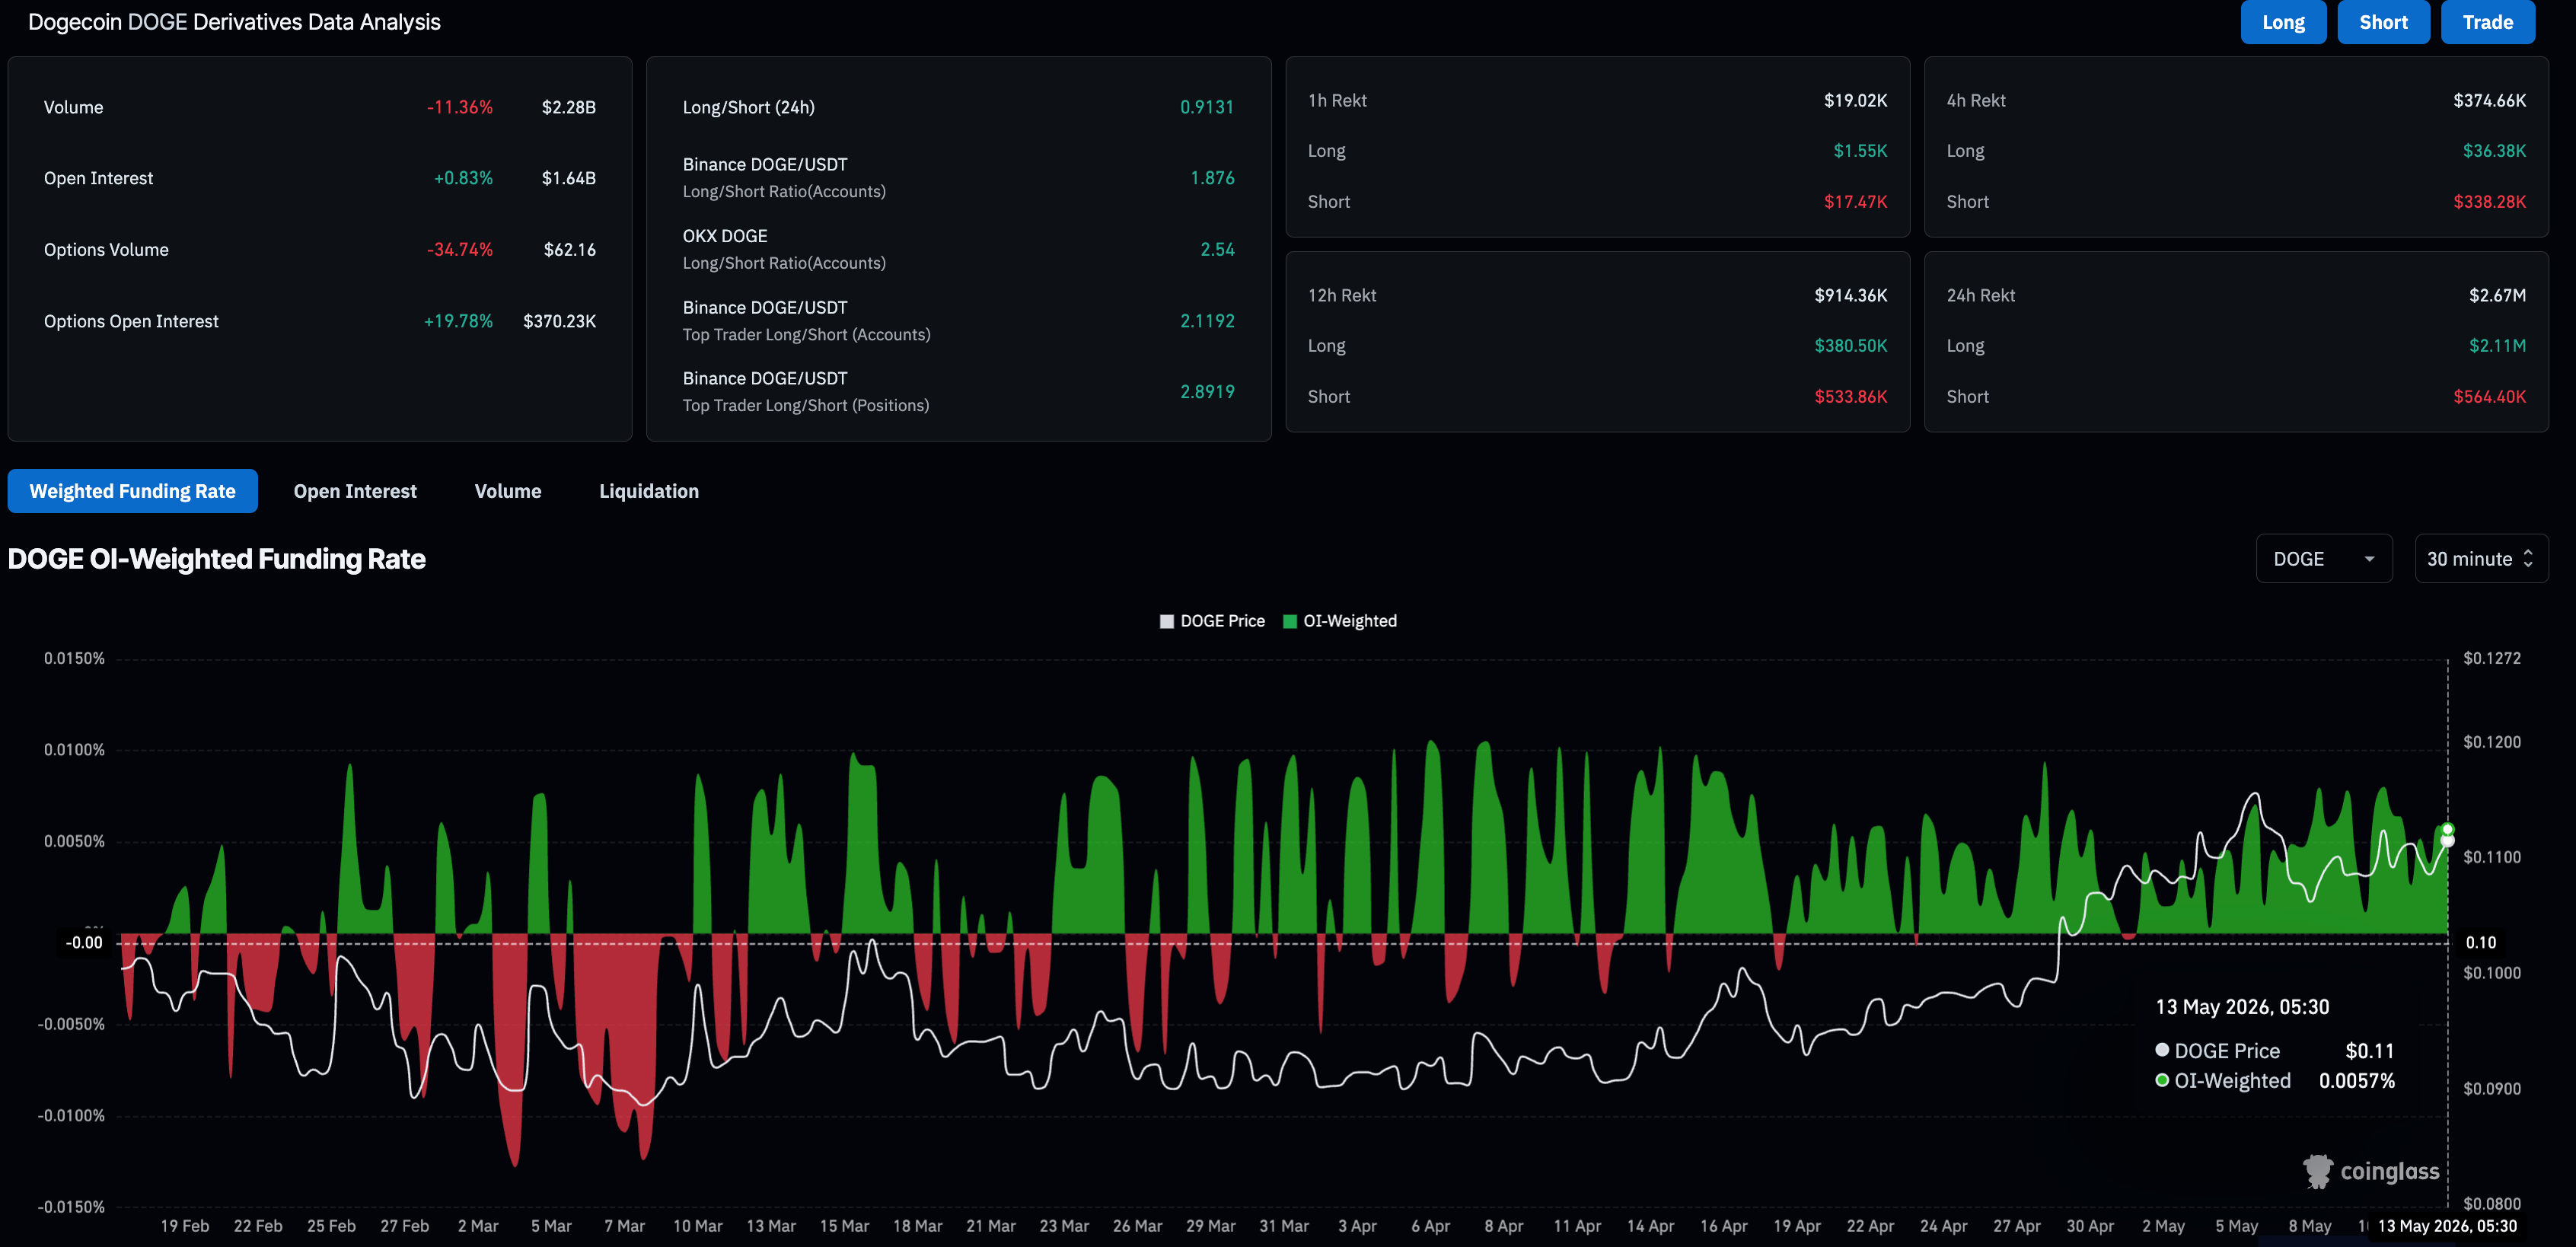
In the case of Dogecoin, the DOGE futures Open Interest (OI) shows minor recovery to $1.64 billion, indicating that buyers retain demand despite the previous day’s wipeout. At the same time, the positive funding rate of 0.0057% confirms the bullish sentiment among buyers, who are building long positions at a premium, anticipating further gains.
Dogecoin defends the 100-day EMA support with a rebound
Dogecoin continues to hover above its 50-day and 100-day Exponential Moving Averages (EMAs) at $0.1024 and $0.1064, respectively, suggesting a mildly constructive bias. These short-term moving averages are still in a mild uptrend, hinting at a potential bullish crossover, while the price remains capped below the 200-day EMA at $0.1248.
The Relative Strength Index (RSI) hovers above the midline around 62, hinting at lingering upside pressure, although the Moving Average Convergence Divergence (MACD) has just slipped marginally below zero, suggesting momentum is losing some traction after the recent advance.
On the topside, initial resistance lies at the $0.1161 supply zone and the 200-day EMA at $0.1248. A daily close above this level would be needed to unlock a stronger bullish extension, targeting the $0.1500 round figure.
On the downside, immediate support is seen at the 100-day EMA near $0.1064, with the 50-day EMA at $0.1024 providing a secondary floor; a break below this zone would weaken the near-term constructive tone and expose a deeper corrective pullback.
(The technical analysis of this story was written with the help of an AI tool.)
Recommended Articles


