

Solana Whales Might Just Have Fueled an $80 Million Short Squeeze
Solana is tracing a broadening bottom pattern, a technical formation that historically signals recovery ahead. The structure suggests accumulation is underway at current price levels.
Whale activity reinforces the bullish case, but derivatives traders are positioning against the move, creating a high-stakes standoff with significant liquidation consequences on both sides.
The Positives and the Negatives Ahead of Solana
Relative Supply Distribution data reveals that addresses holding between 10,000 and 100,000 SOL have been steadily accumulating over the past two weeks. Their collective share of total SOL supply rose from 21.9% to 22.2% during this period. This 0.3% increase represents approximately 1.71 million SOL, currently valued at $144 million.
Whale-tier accumulation of this magnitude carries meaningful price implications. Large holders historically exert disproportionate influence over market direction, particularly during periods of low liquidity. Their sustained buying at current levels signals confidence in a near-term recovery, providing a credible demand-side foundation for Solana’s next directional move.
Want more token insights like this? Sign up for Editor Harsh Notariya’s Daily Crypto Newsletter here.
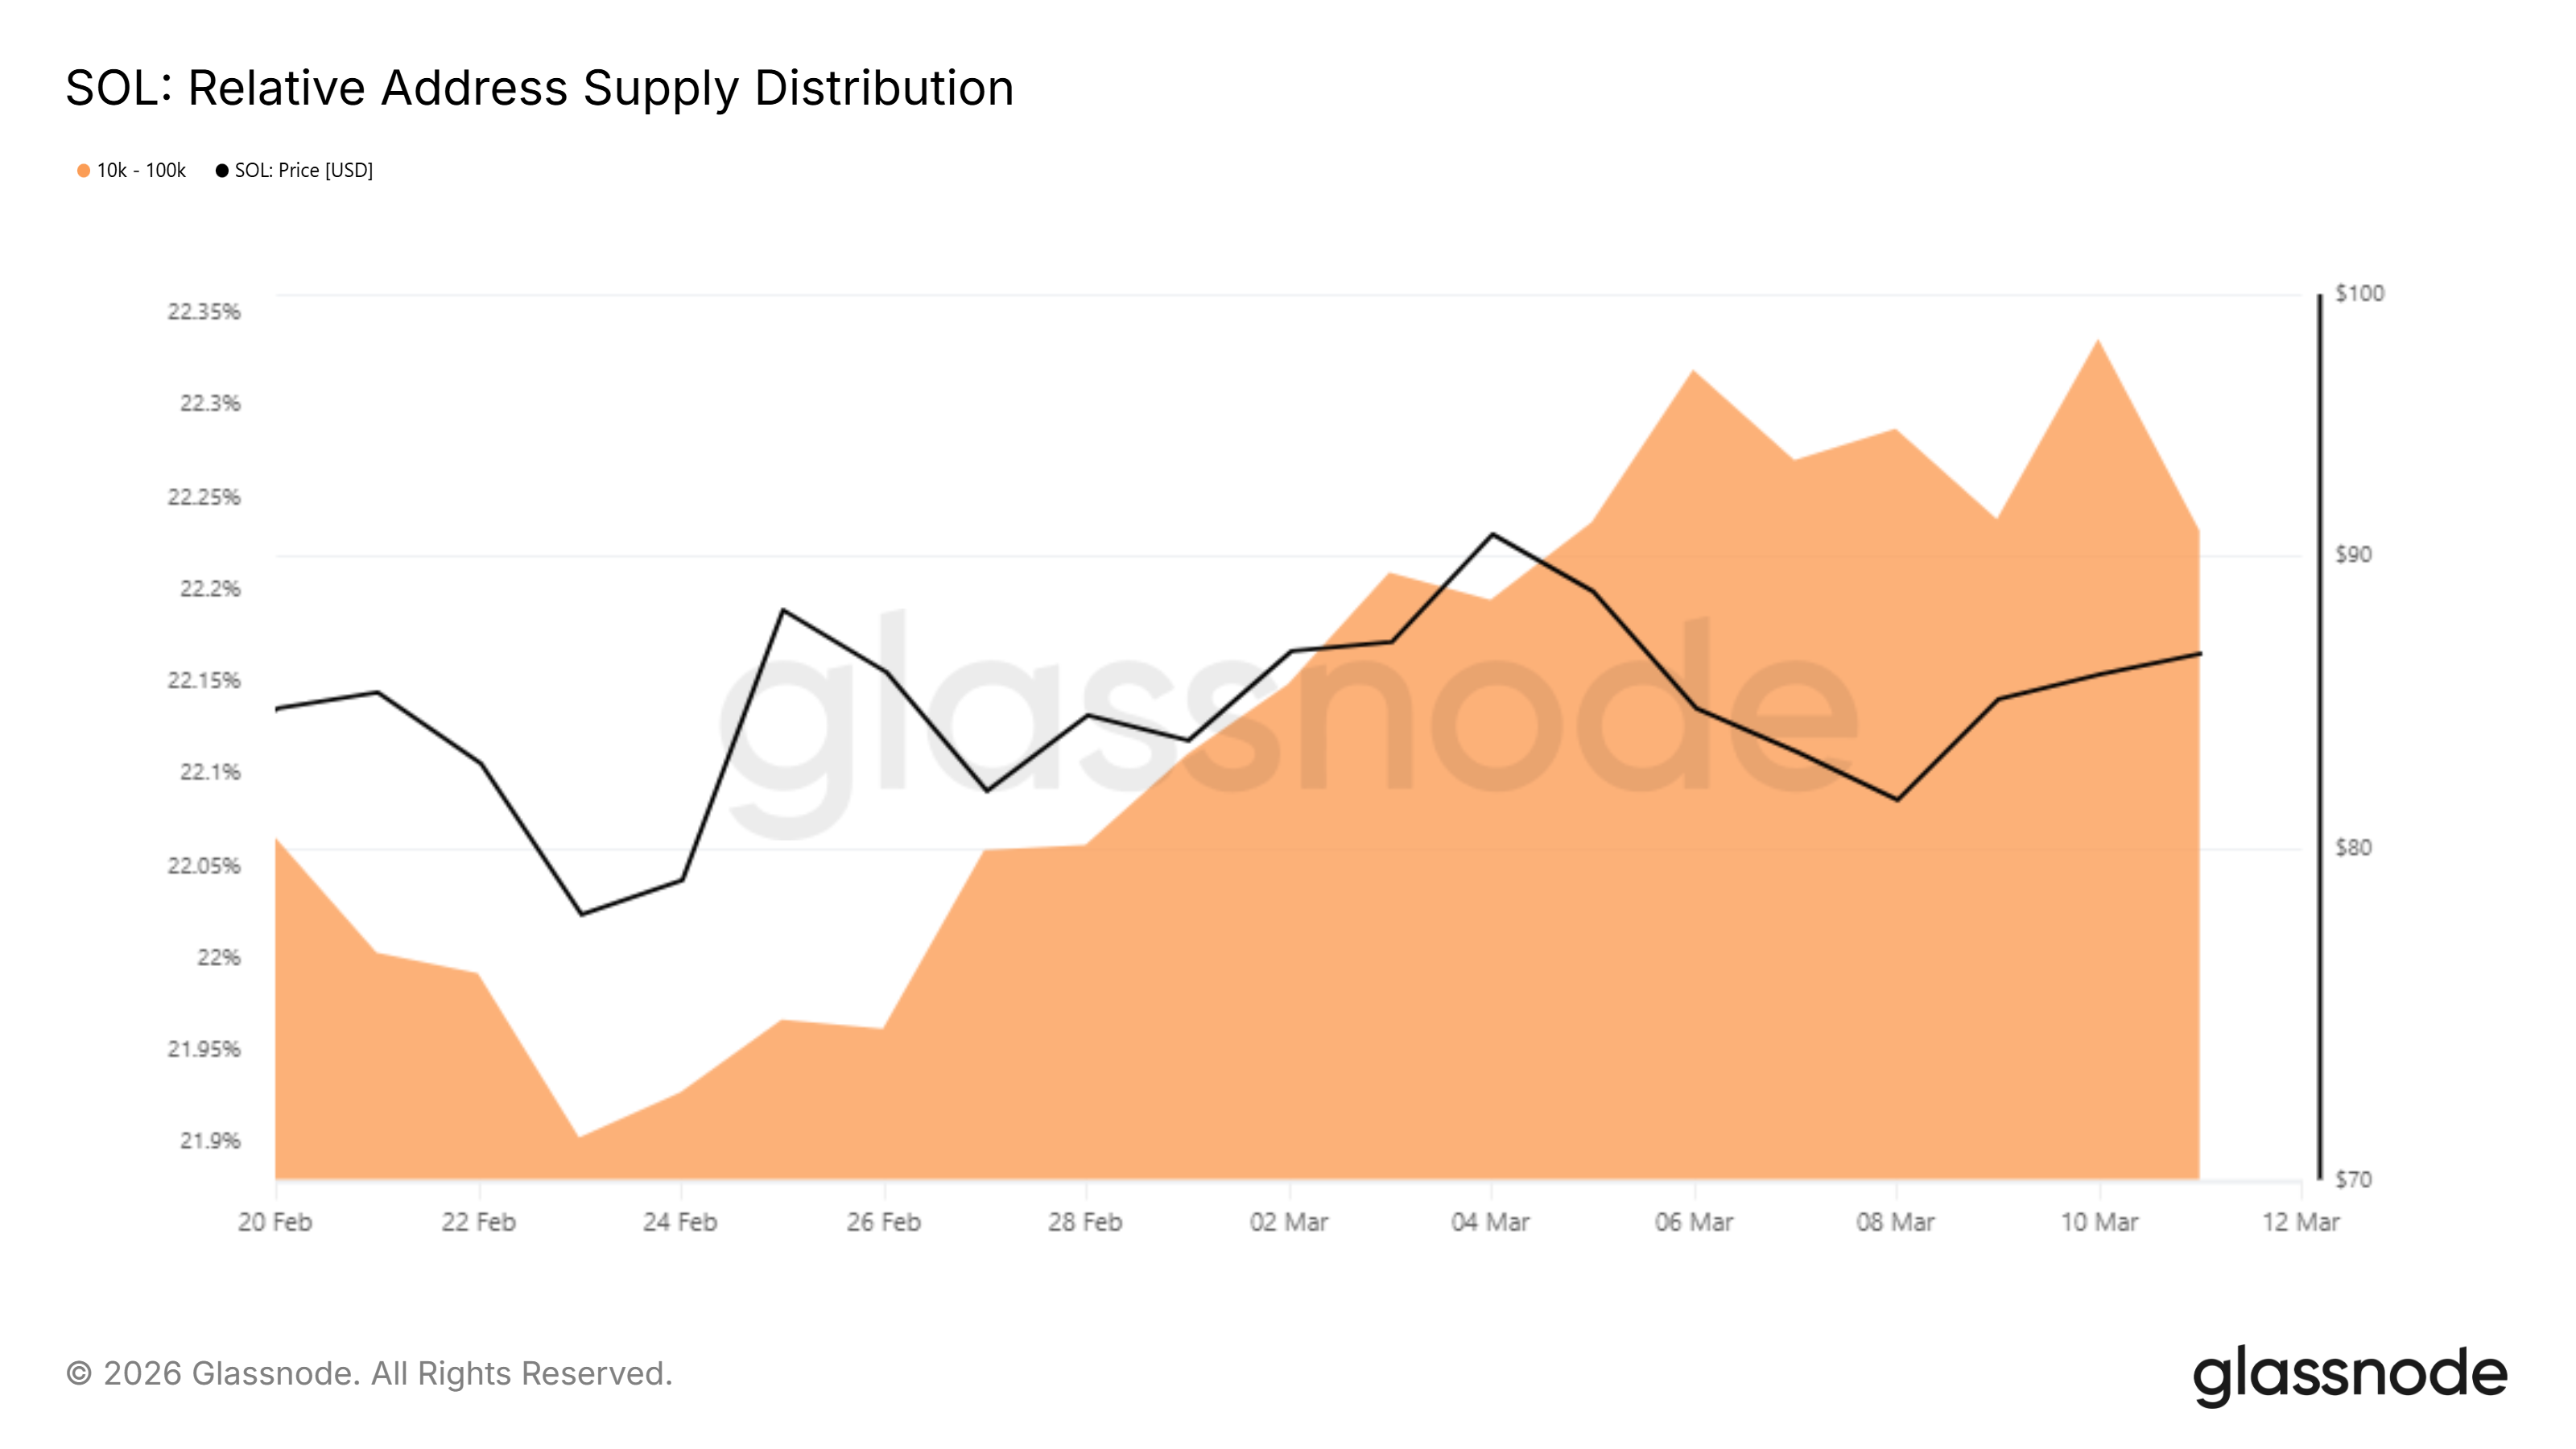 Solana Supply Distribution. Source: Glassnode
The liquidation heatmap confirms that SOL is trapped in a range-bound zone between $83 and $89. This tight range reflects a market in equilibrium, with significant leveraged positions clustered on both sides. Thus, a decisive move in either direction would trigger cascading liquidations and amplify price momentum substantially.
The asymmetry between the two liquidation clusters is notable. The $41 million in long liquidations at $83 is dwarfed by the $80 million in short liquidations sitting above $89. Should whale buying combine with positive broader market conditions, SOL could breach $89 and ignite a short squeeze, accelerating gains well beyond that threshold.
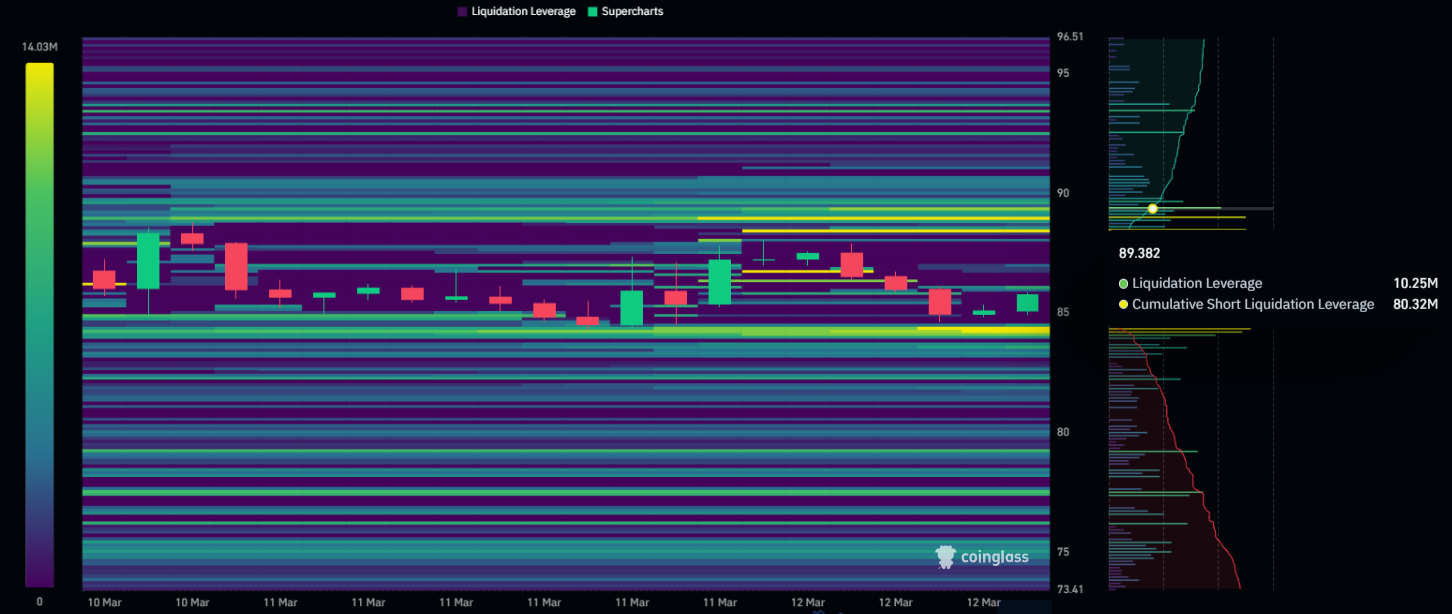 Solana Liquidation Heatmap. Source: Coinglass
SOL Price Awaits Breakout
Solana price is trading at $85, moving within a broadening bottom pattern that projects a near 12% rally. The technical breakout level sits at $92, above which the pattern’s full upside target of $100 comes into play. Current price positioning places SOL in a favorable zone for this setup to develop.
A push above $88 would serve as the short squeeze trigger, forcing leveraged short positions to close quickly. Thus, with $80 million in shorts exposed above that level, the resulting buying pressure could carry SOL swiftly through $92. Barring significant profit-taking, no major resistance stands between the breakout level and the $100 milestone.
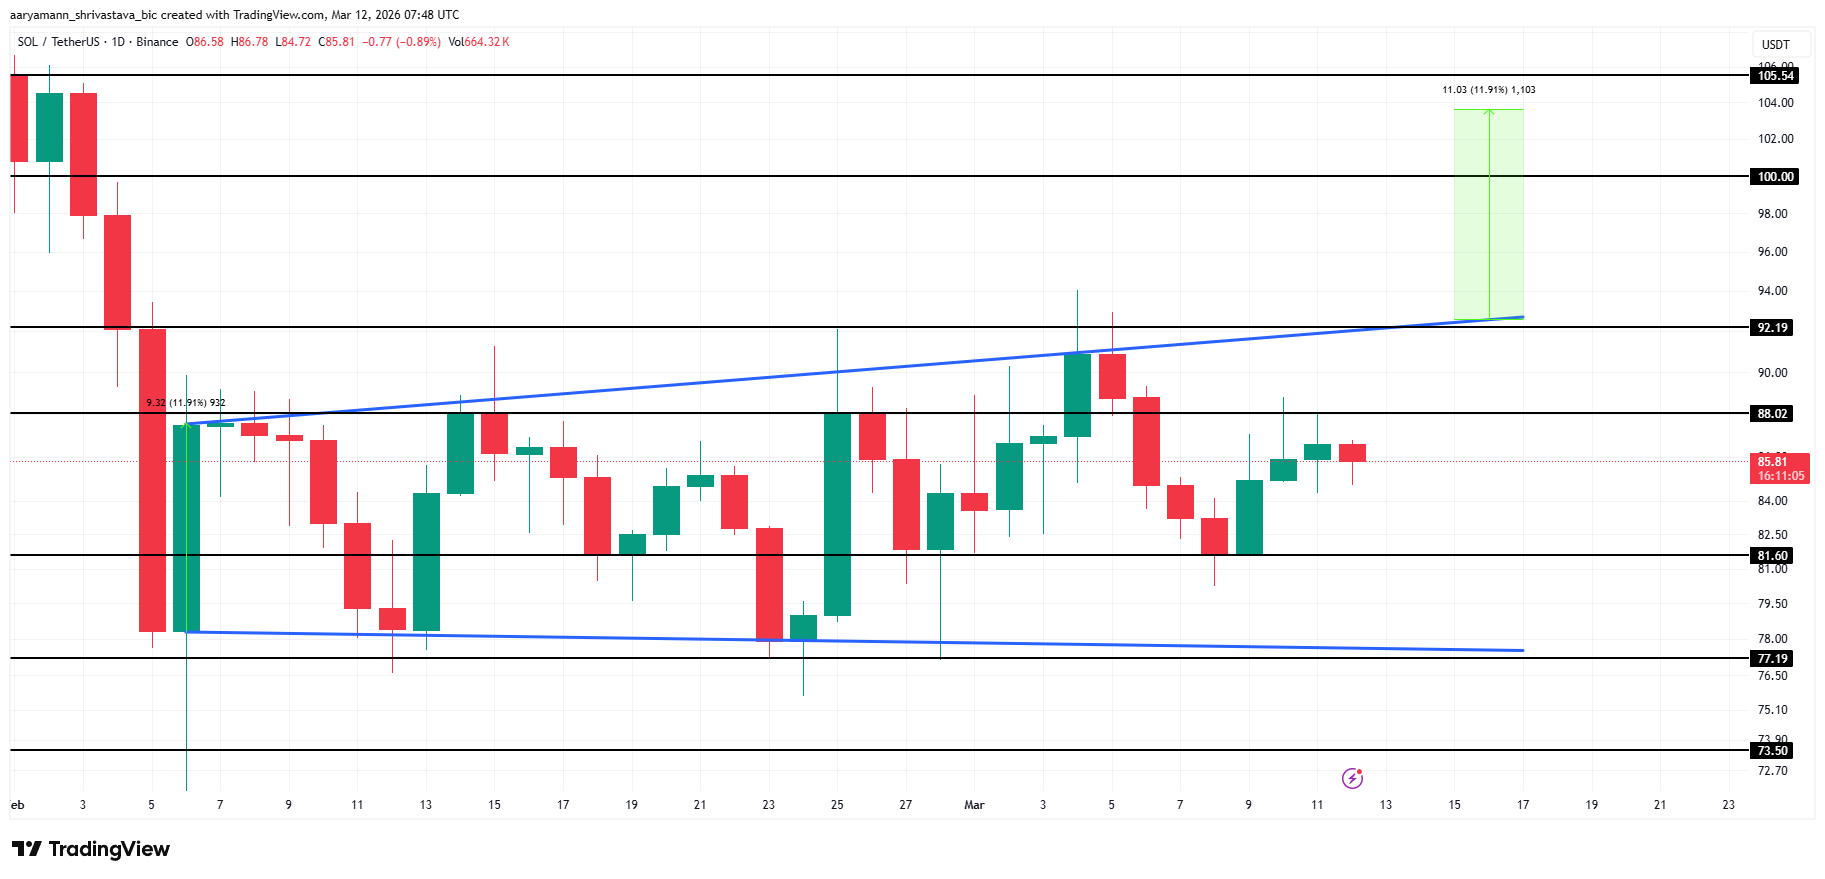 Solana Price Analysis. Source: TradingView
However, deteriorating geopolitical conditions present the primary downside risk. A decline to $81 support would activate approximately $40 million in long liquidations, creating a self-reinforcing wave of selling pressure. Thus, that cascade could push Solana toward $77, where the lower trendline of the broadening bottom pattern would serve as the next critical support test.
Recommended Articles


