


Smart Money Exit Solana’s Seeker Token after 200% Rally
Seeker price has entered a pullback phase. After delivering a sharp 200% post-launch rally earlier this week, SKR is now down nearly 25% over the past 24 hours. That shift becomes all the more important as the buyers driving the move have changed.
In our earlier analysis, we showed how smart money absorbed airdrop selling and helped stabilize the price. That setup is no longer intact. Smart money has started cutting exposure, exchange balances are rising, and yet whales are quietly adding. The result is a market pulled in opposite directions, with a 5% cliff now in focus.
Critical Breakdown Triggered Smart Money Exit
The first crack appeared on January 24.
On the one-hour chart, the Seeker price lost its Volume Weighted Average Price (VWAP) line. VWAP represents the average price traders paid, weighted by volume.
When the price holds above it, buyers are in control. When it breaks, it often signals distribution rather than healthy consolidation.
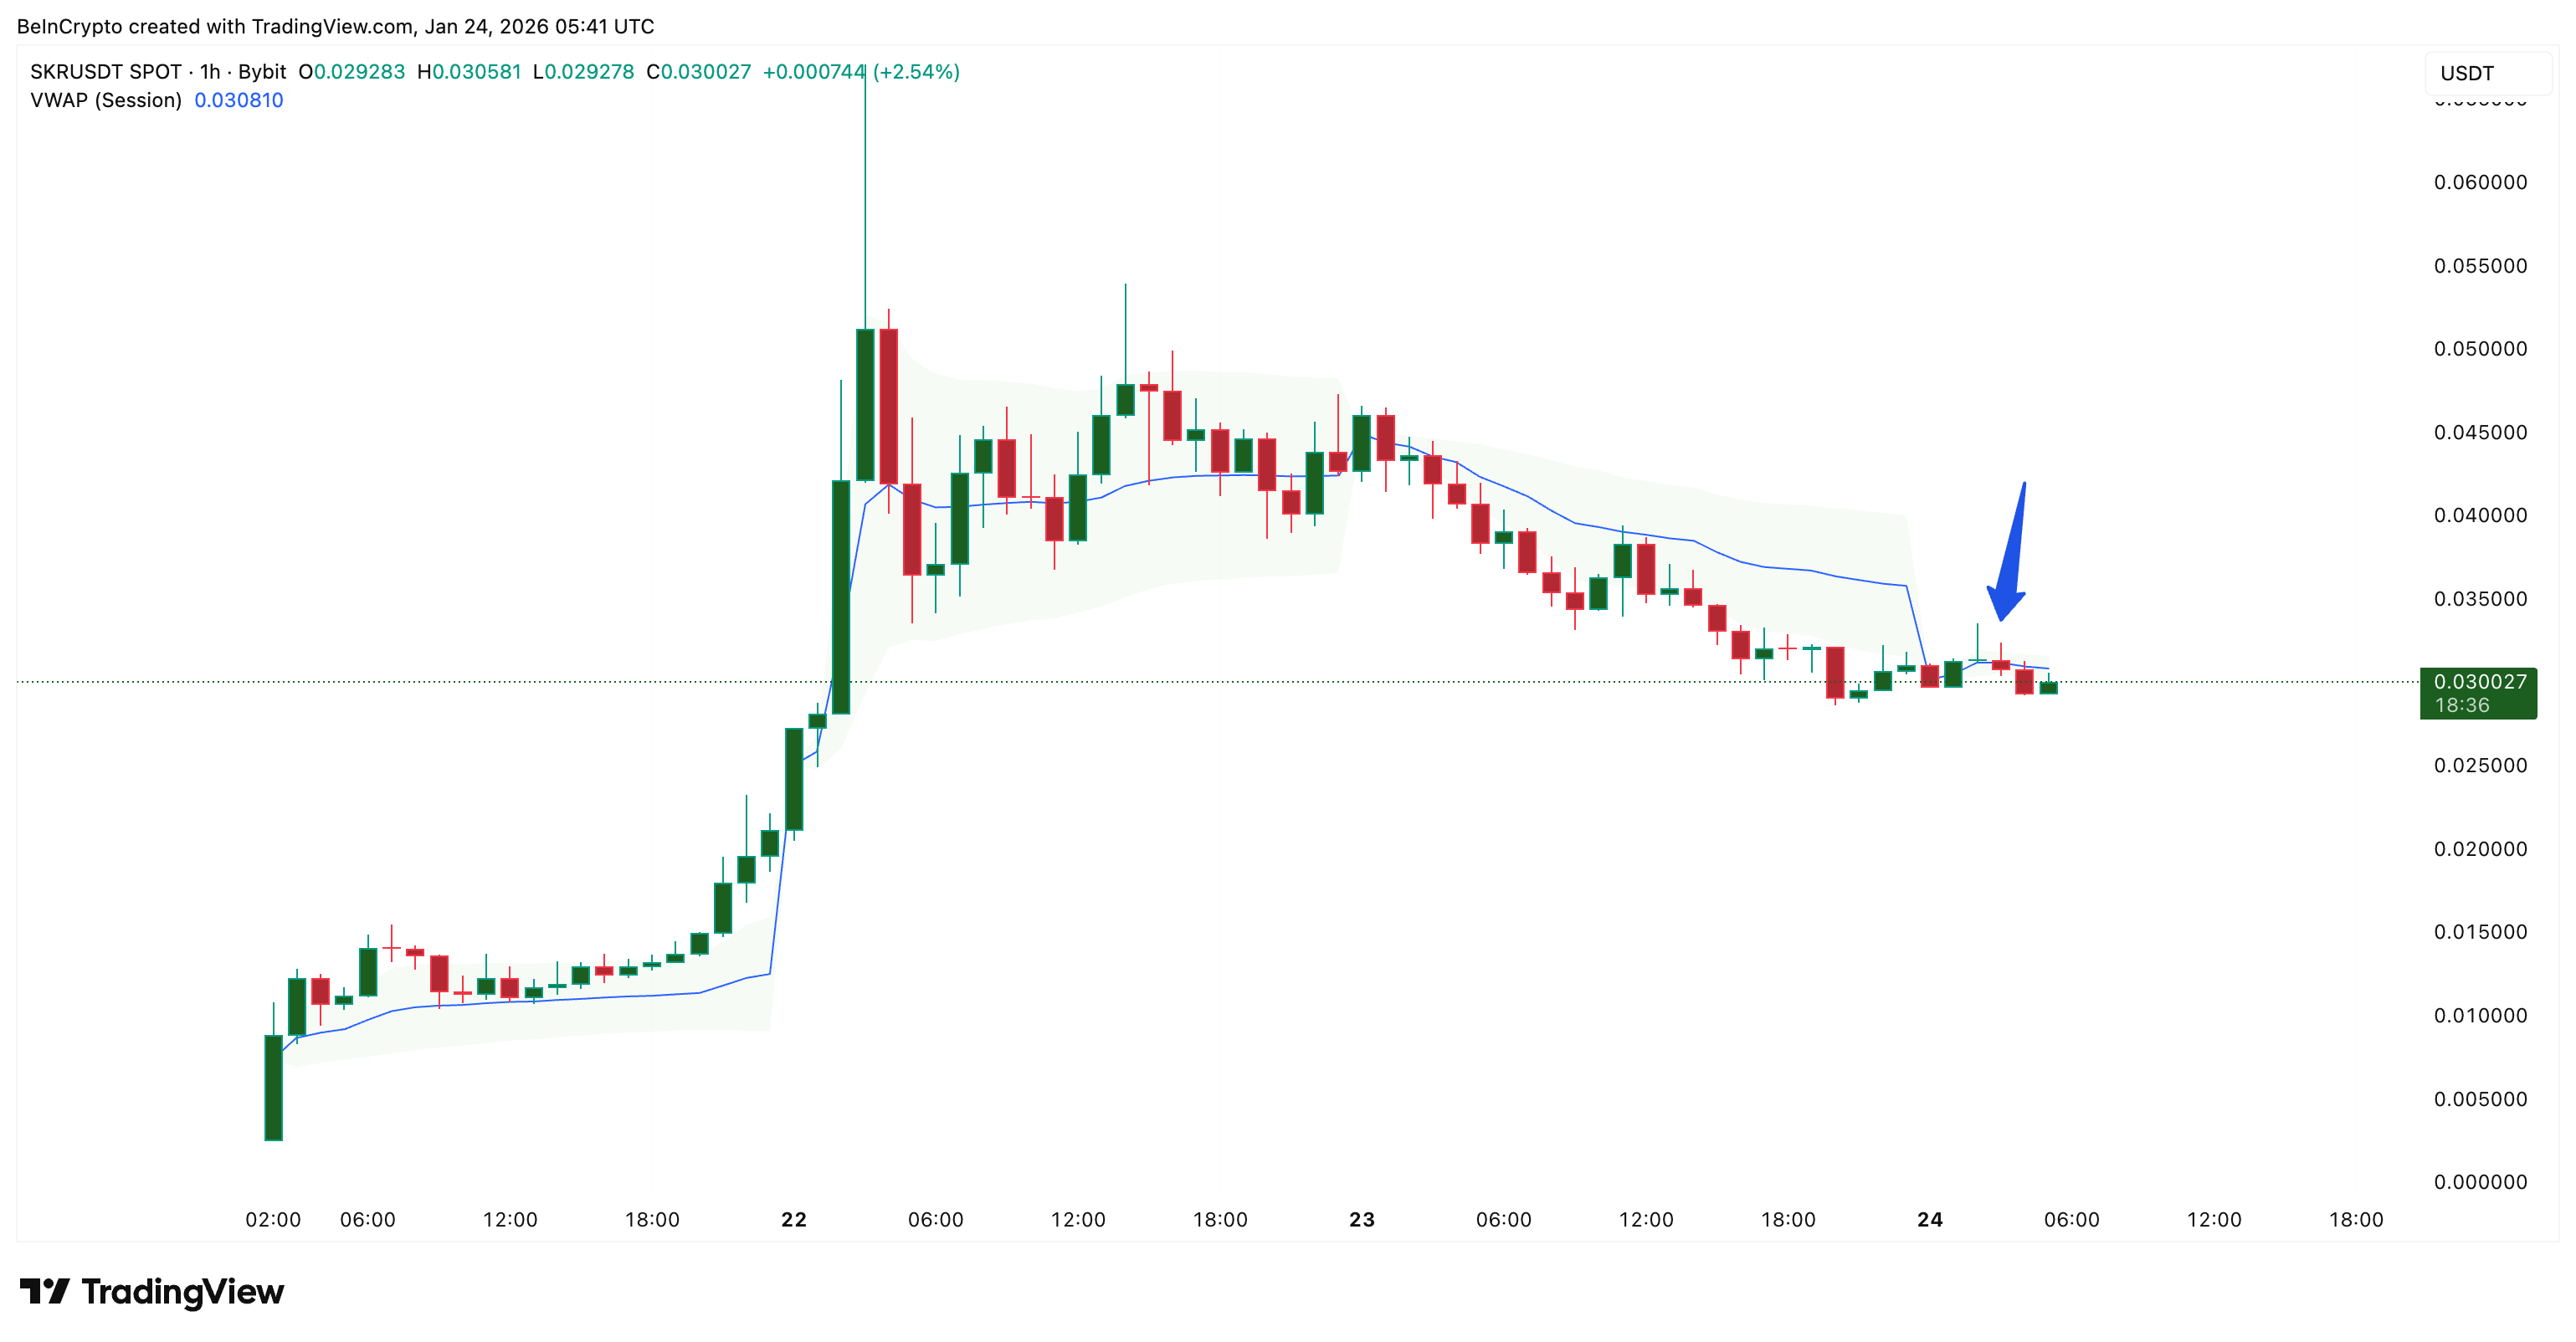 Seeker Loses VWAP: TradingView
Want more token insights like this? Sign up for Editor Harsh Notariya’s Daily Crypto Newsletter here.
That breakdown lined up closely with smart money behavior.
Over the past 24 hours, smart money wallets reduced their SKR holdings by 56.48%. Based on the on-chain data, this cohort cut roughly 8.5 million SKR from their positions in a single day. This was not slow trimming. It was a decisive exit following the loss of short-term structure.
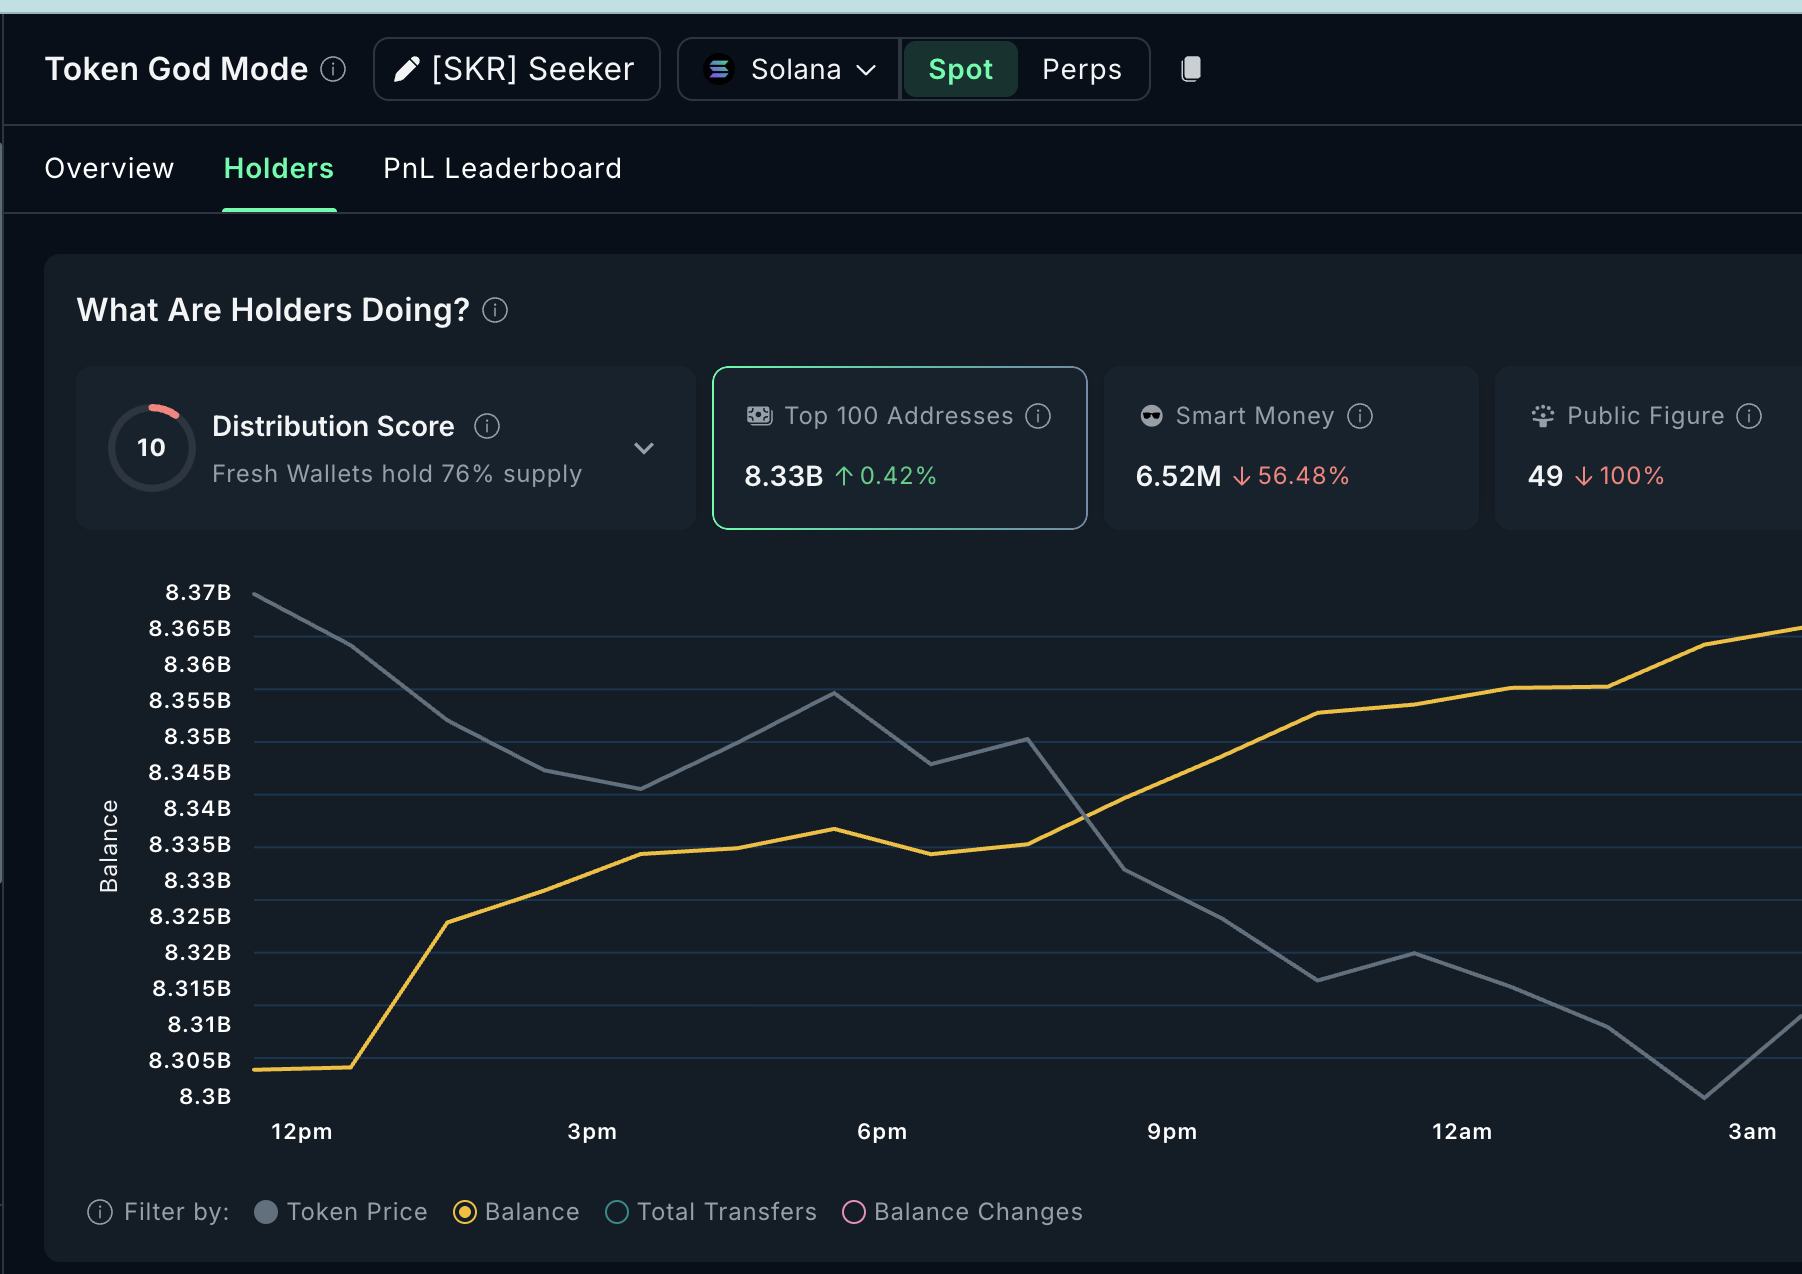 Smart Money Cuts Supply: Nansen
This matters because smart money tends to move first. When they step aside after a VWAP loss, it usually signals that near-term upside no longer offers a favorable risk-reward.
That explains why Seeker’s bounce attempts have been muted, even as price tries to stabilize. But smart money selling is only one side of the equation.
Whales Buy the Dip as One Divergence Signals Accumulation
While informed traders were exiting, whales moved in the opposite direction.
From January 23 to January 24, the Seeker price continued trending lower, but the Money Flow Index (MFI) moved higher over the same period. MFI tracks buying and selling pressure using both price and volume. When price falls while MFI rises, it signals accumulation beneath the surface.
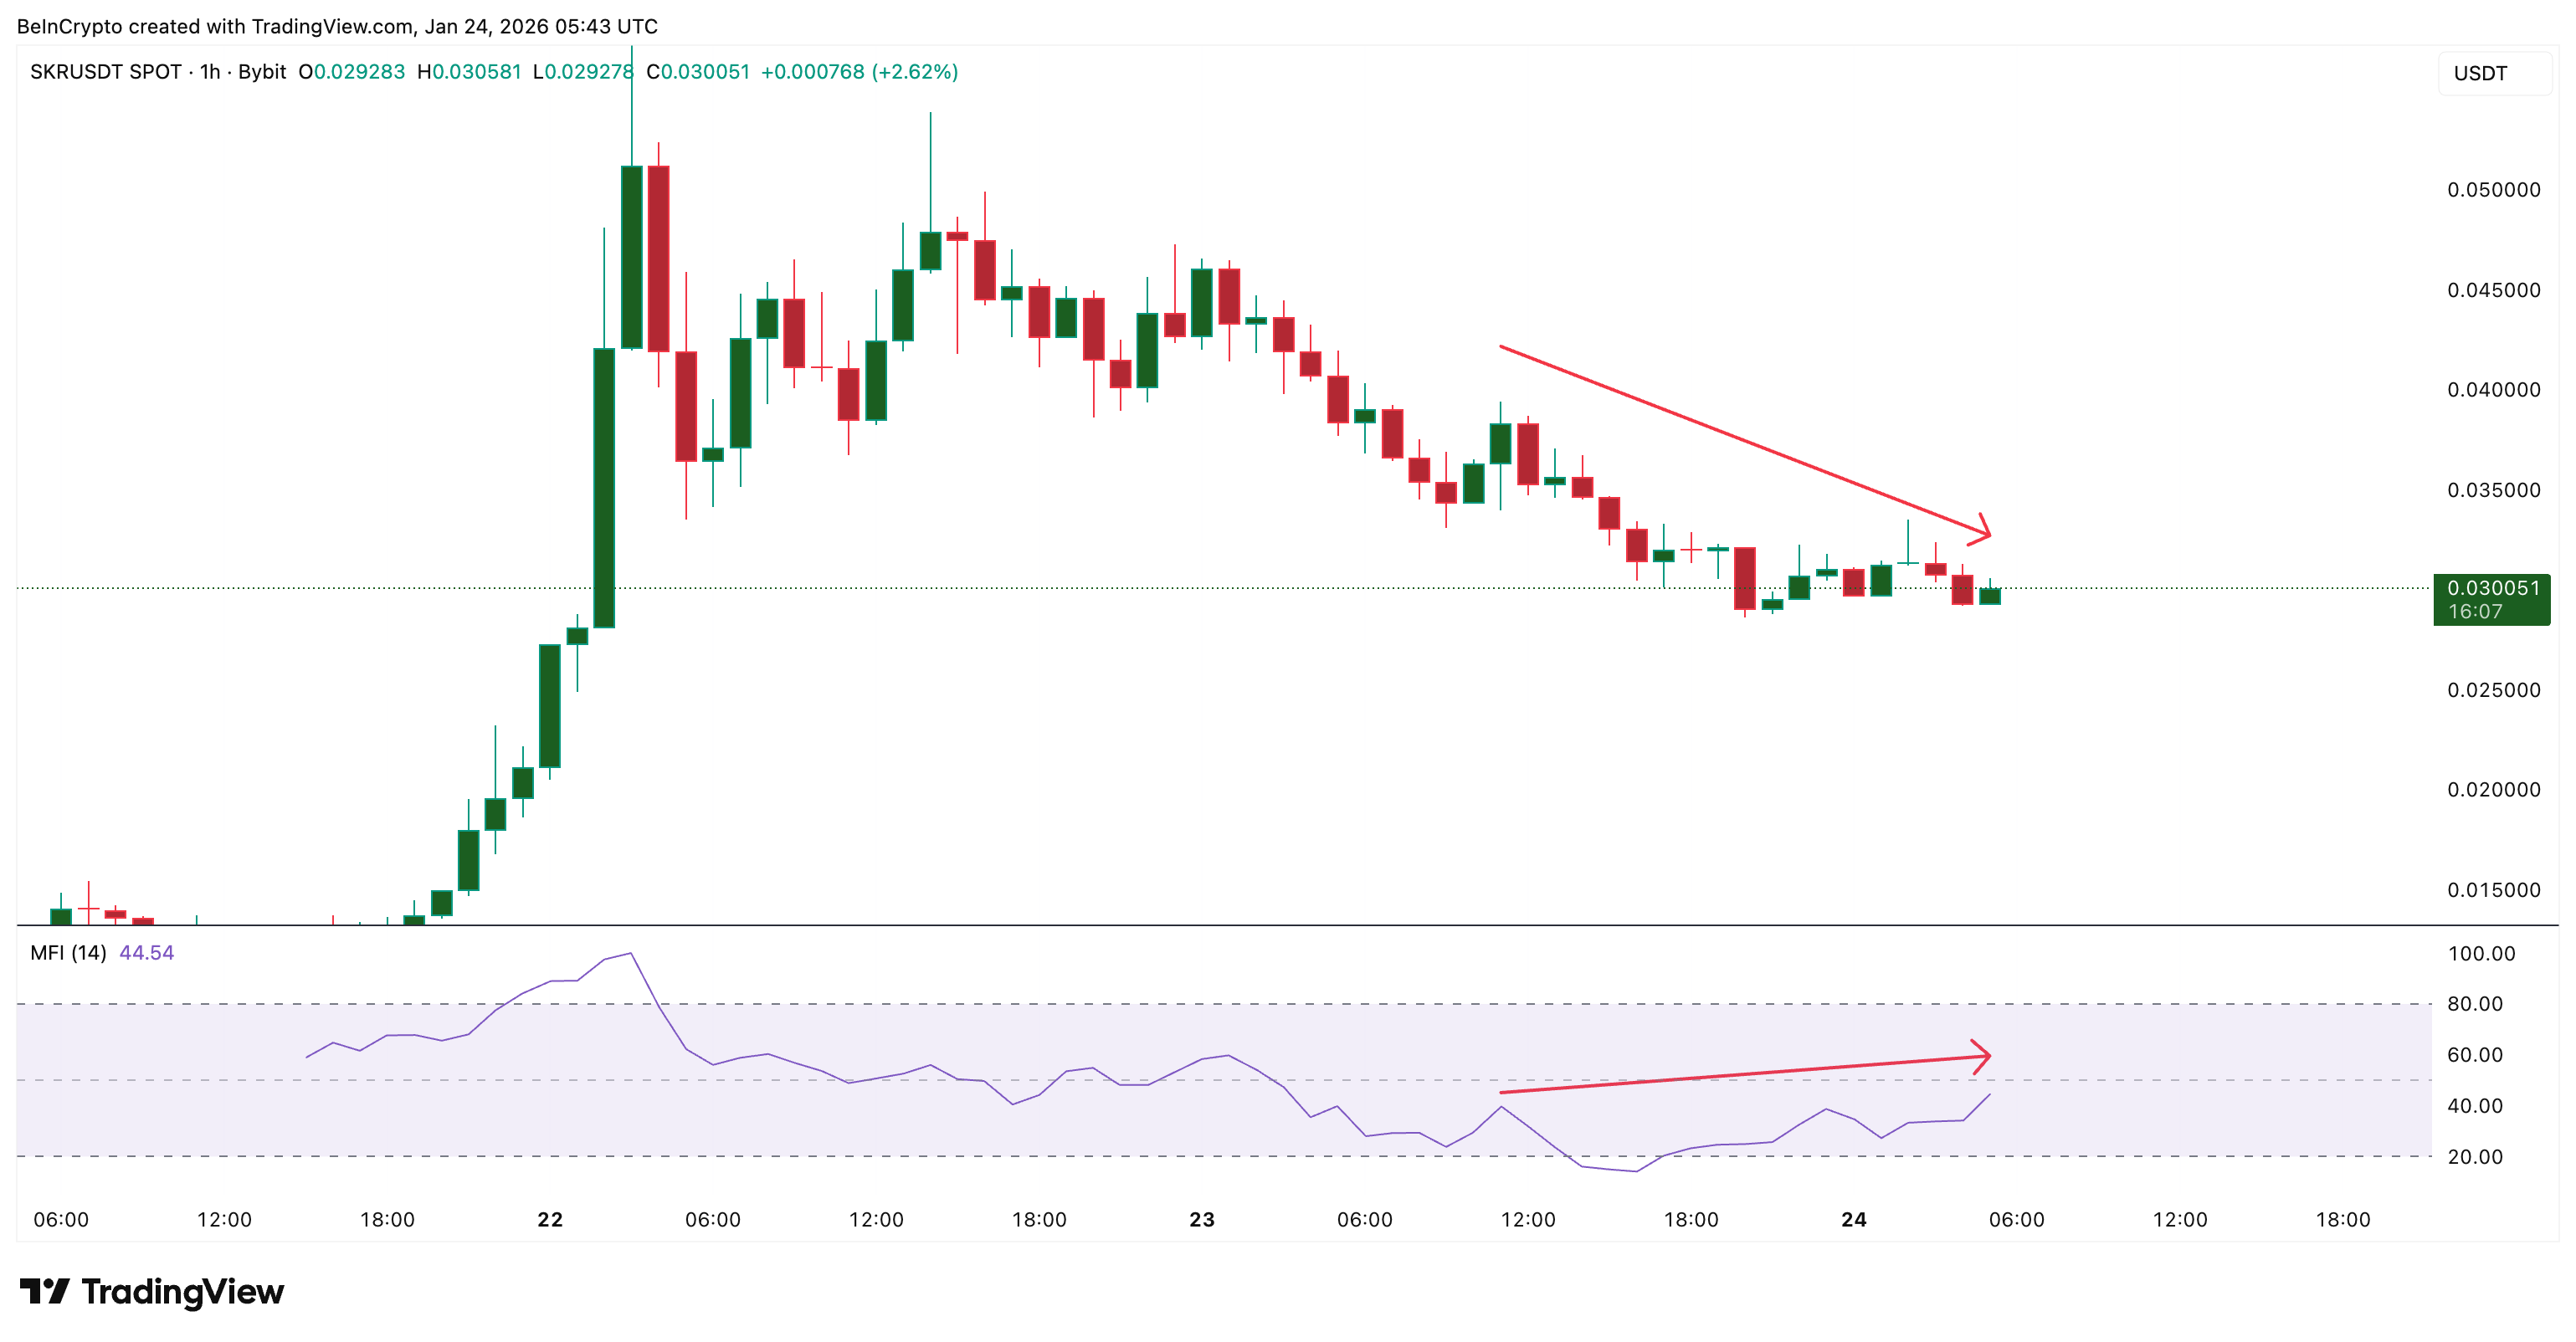 Dip Buyers:TradingView
That divergence helps explain whale behavior.
Over the past 24 hours, whale holdings increased by 40.78%, lifting their total balance to 56.49 million SKR. This means whales added approximately 16.3 million SKR during the pullback.
Unlike smart money, whales are not trading short-term structure. They are positioning into weakness, which lines up perfectly with the MFI dip buying.
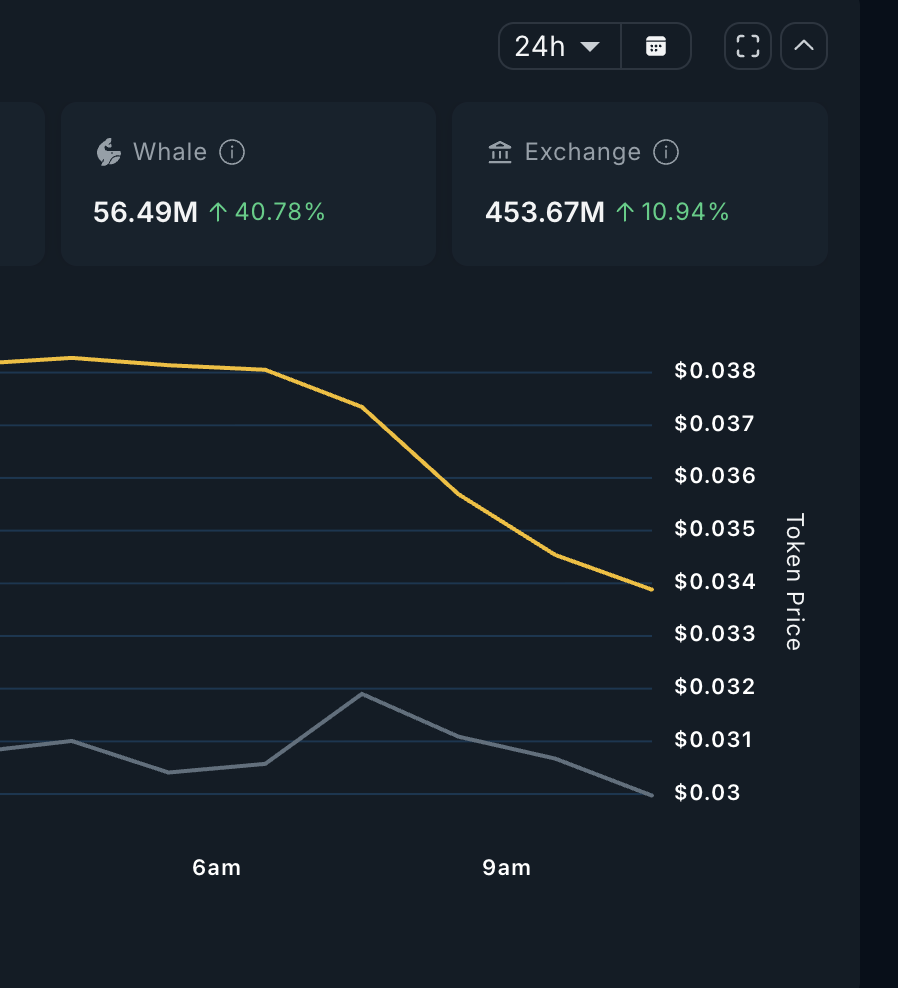 Seeker Whales: Nansen
This creates a clear contrast in intent. Smart money stepped away after VWAP failed. Whales stepped in as momentum cooled and dip-buying signals appeared.
However, whale accumulation does not automatically translate into price strength. Whales can absorb supply, but they cannot stop a decline if selling pressure elsewhere continues to rise. That brings exchange behavior into focus.
Exchange Inflows Keep Seeker Price Breakdown Risk Alive
Despite whale buying, supply pressure remains elevated.
Exchange balances increased sharply over the past 24 hours, rising by 10.94% to 453.67 million SKR. That implies roughly 44.8 million SKR moved onto exchanges during this period. Smart money exits contributed to this flow, and retail profit-taking likely added to the pressure as well.
This supply shift shows up clearly in volume data.
On the four-hour chart, On-Balance Volume (OBV) has trended lower even as price remained elevated between January 21 and January 24. OBV tracks whether volume confirms price moves. When price holds up, but OBV falls, it signals that rallies are being driven by thinning demand rather than strong accumulation.
This is why whale buying has not yet translated into upside follow-through. More so, as the exchange inflow surge easily trumps their accumulation numbers.
The technical risk is now clearly defined. On a four-hour closing basis, $0.028 is the key level, a 5% move from the current level at press time. A clean close below it, accompanied by an OBV trendline breakdown, would signal that selling pressure is overpowering accumulation, opening downside risk toward $0.0120.
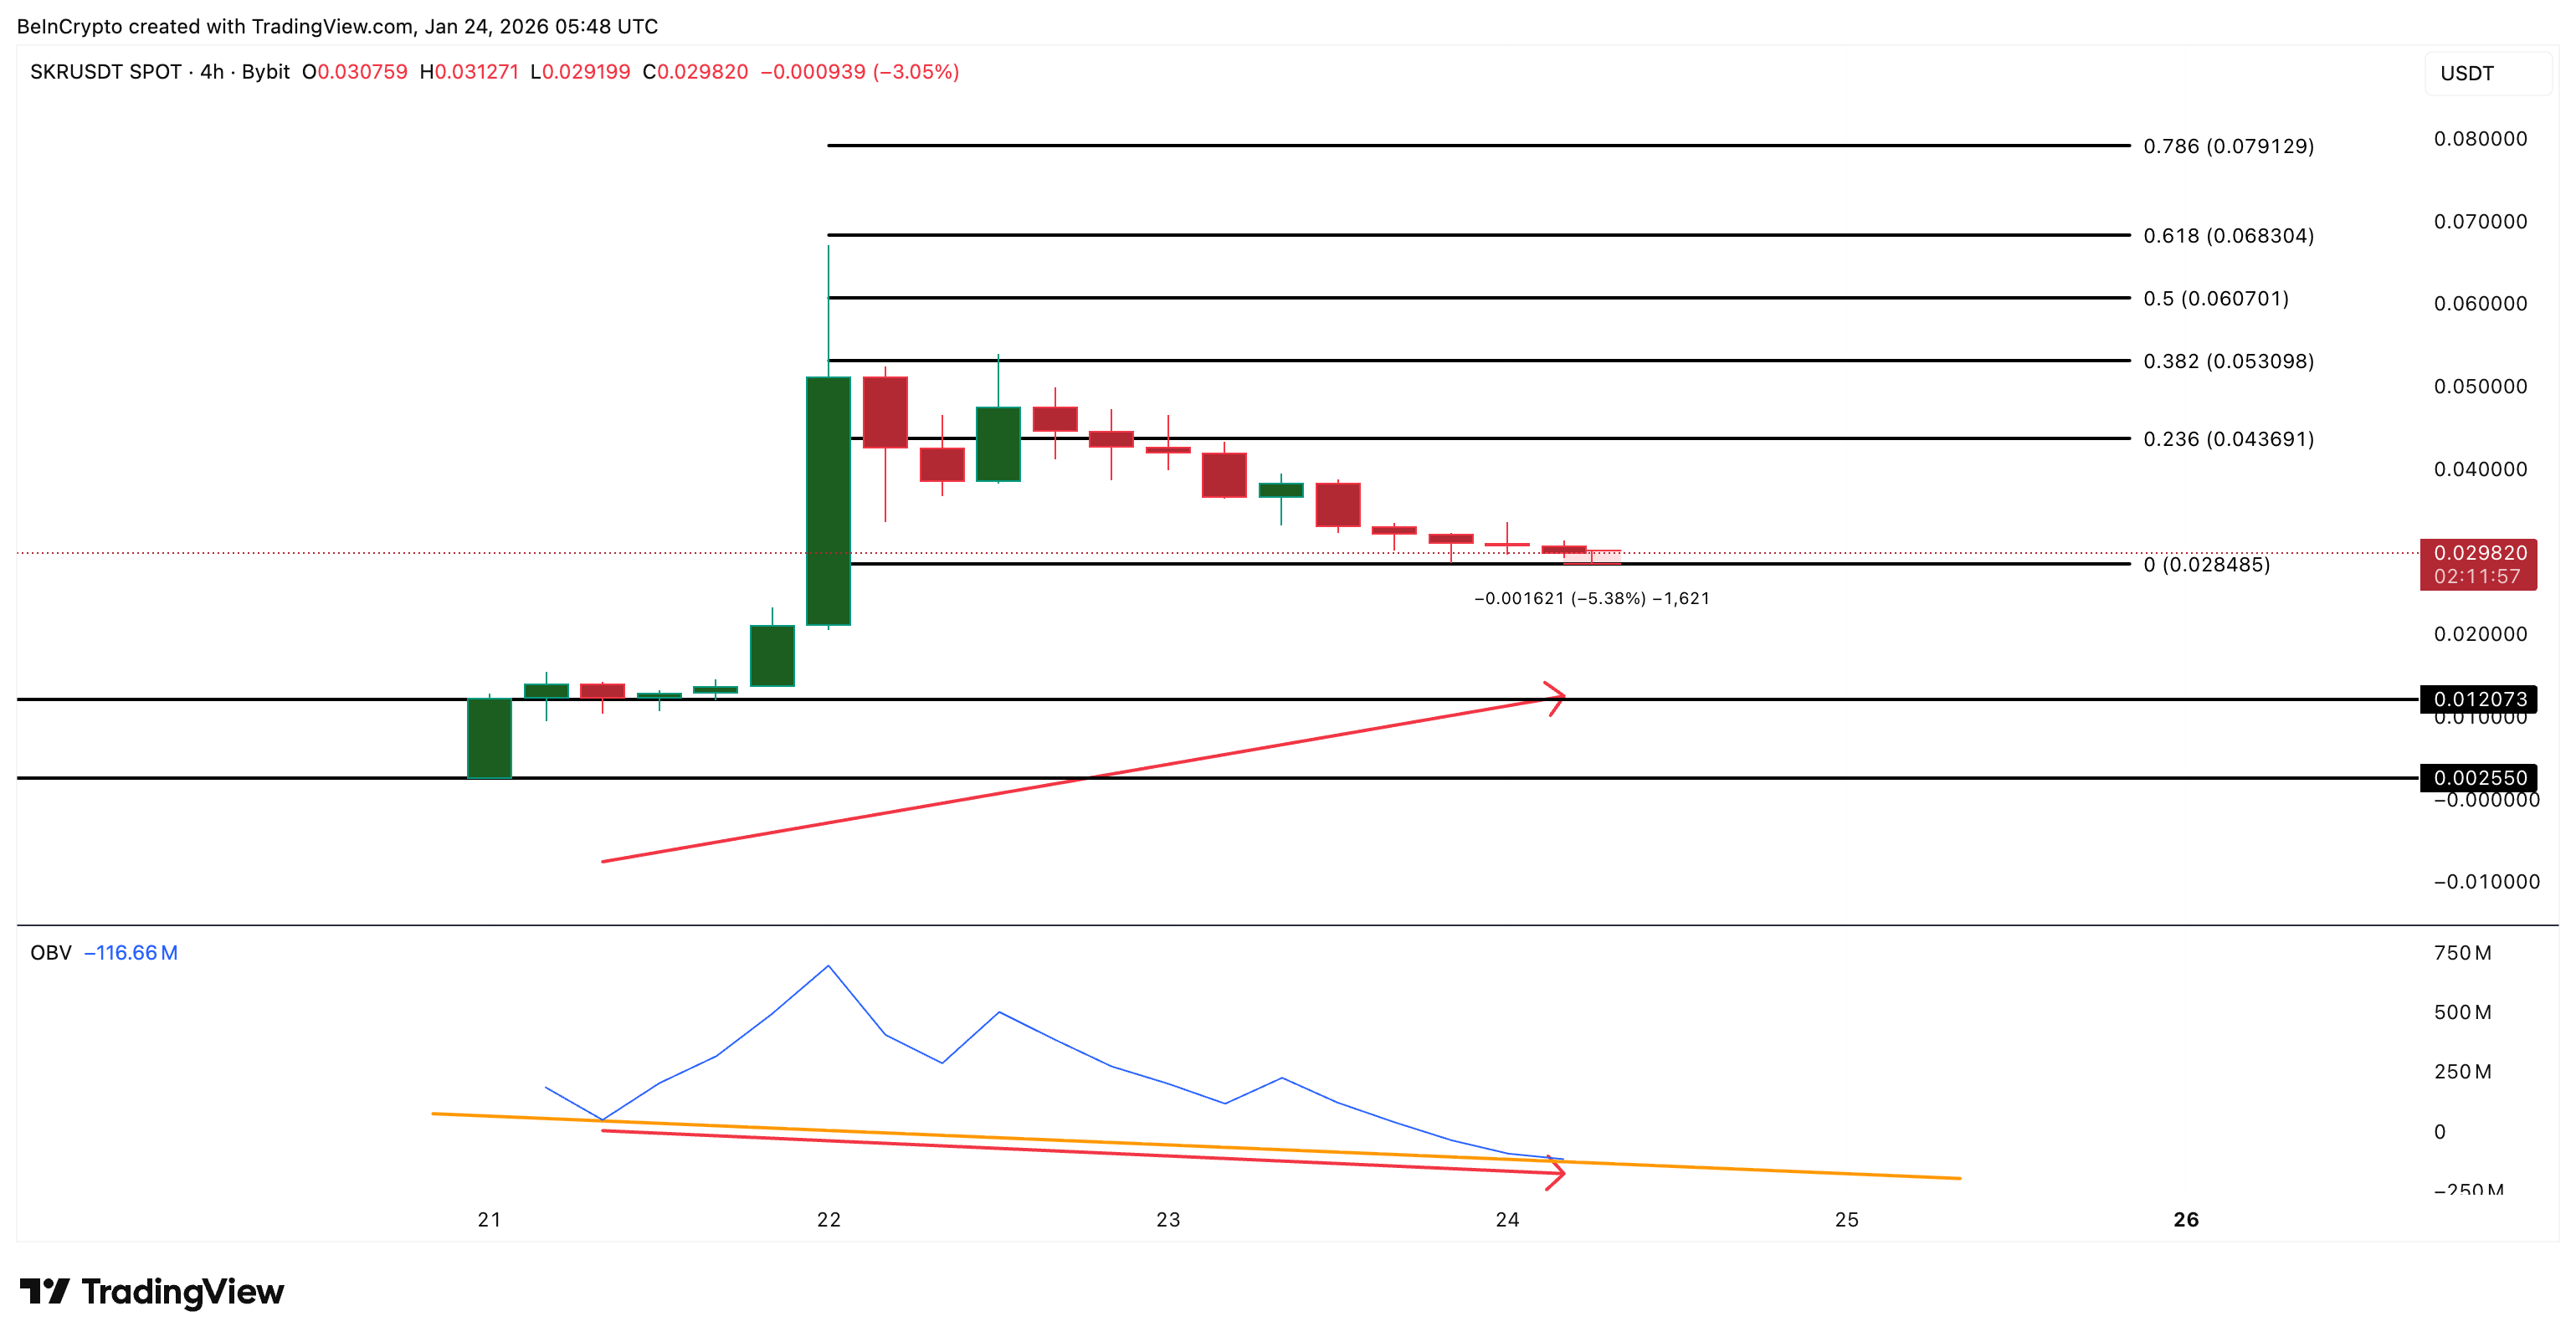 Seeker Price Analysis: TradingView
On the upside, Seeker needs to reclaim $0.043 to restore confidence. Beyond that, $0.053 remains the most important resistance zone, where prior supply has been concentrated. Without a shift in volume behavior, those levels remain difficult to reach.
The structure tells a simple story. Smart money has stepped aside. Whales are accumulating. Exchanges are filling up. As long as this imbalance persists, Seeker price remains vulnerable.
Recommended Articles


