

Top 3 Price Forecast: BTC Shows Early Stabilization; ETH and XRP Still Look Heavy

- Iran Situation Rekindles Threat of War. Bitcoin Price Decline Accelerates, $75,000 Geopolitical Defense Line Faces Test
- WTI declines below $102.00 after Trump says he called off Iran attacks
- Gold falls below $4,500 on rising global rate hike bets
- Gold edges higher to near $4,700 as Trump-Xi summit looms
- Nvidia Earnings Approach: Can It Drive a Nasdaq Rebound? What Should Investors Watch Most?
- Euro softens to near 1.1600 on US–Iran tensions

Bitcoin is extending a rebound on Friday after it held the midpoint of a horizontal parallel channel as support.
Ethereum is steady near $2,964 after it slipped under key daily levels earlier this week and has not reclaimed them.
XRP is trading around $1.91 after failing to secure a close above an important resistance zone, leaving downside risk in place.
Bitcoin (BTC), Ethereum (ETH) and Ripple (XRP) are sending mixed signals on Friday as the broader crypto market tries to steady after this week’s sell-off. BTC is attempting to rebuild momentum from a well-defined support area, while ETH and XRP remain under pressure after recent closes below critical levels.
Bitcoin steadies after defending channel support
Bitcoin began the week on the back foot and finished below two levels traders were watching: the 50-day EMA at $91,942 and the previously broken upper consolidation line at $90,000. On Wednesday, BTC bounced after retesting the midpoint of a horizontal parallel channel at $87,787, and it carried that recovery into Thursday. At the time of writing on Friday, Bitcoin is trading near $89,900.
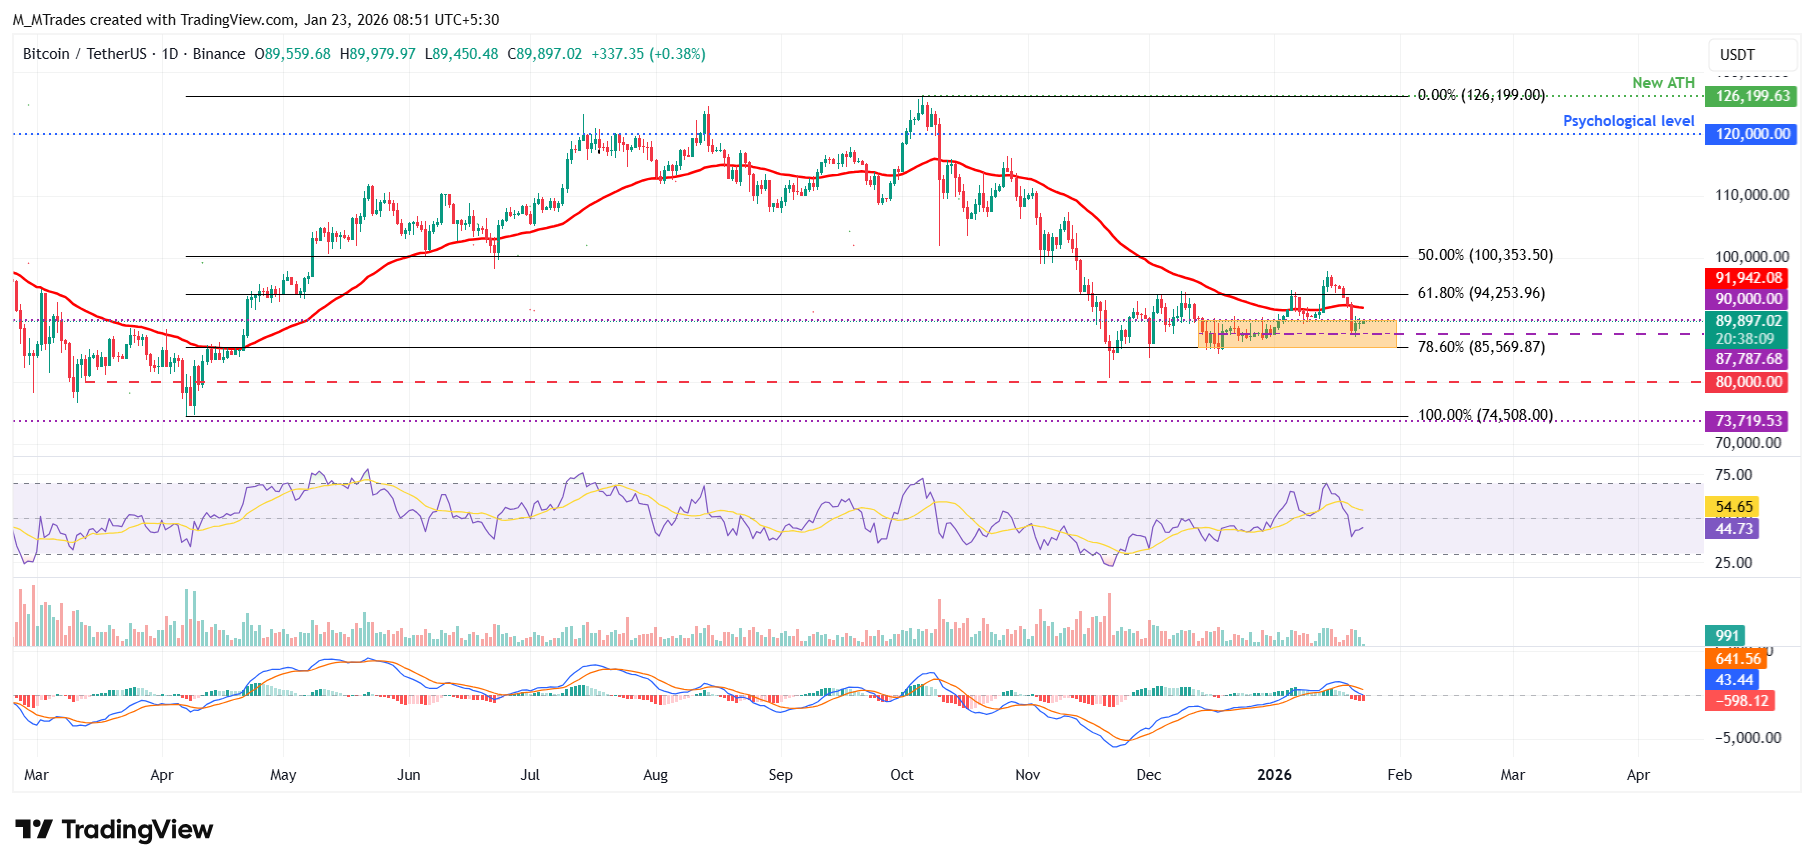
If the rebound continues, the next upside test sits at the 50-day EMA ($91,942).
Momentum signals are improving but not fully flipped. The daily RSI is 44 and rising toward the neutral 50 mark, which points to weakening bearish pressure. For bulls to keep control, RSI would need to push above 50. Still, traders may stay cautious because the MACD printed a bearish crossover on Tuesday, which suggests some lingering downside pressure.
If the recovery fails and BTC posts a daily close below $87,787, the chart opens room for a move toward the lower consolidation boundary at $85,569, which also lines up with the 78.6% Fibonacci retracement level.
Ethereum remains capped below $3,017
Ethereum extended its pullback by more than 10% through Tuesday and closed below two key levels: the 50-day EMA at $3,135 and the daily support at $3,017. ETH tried to rebound on Wednesday but did not manage a close back above $3,017, and it eased again the following day. As of Friday, ETH is hovering around $2,964.
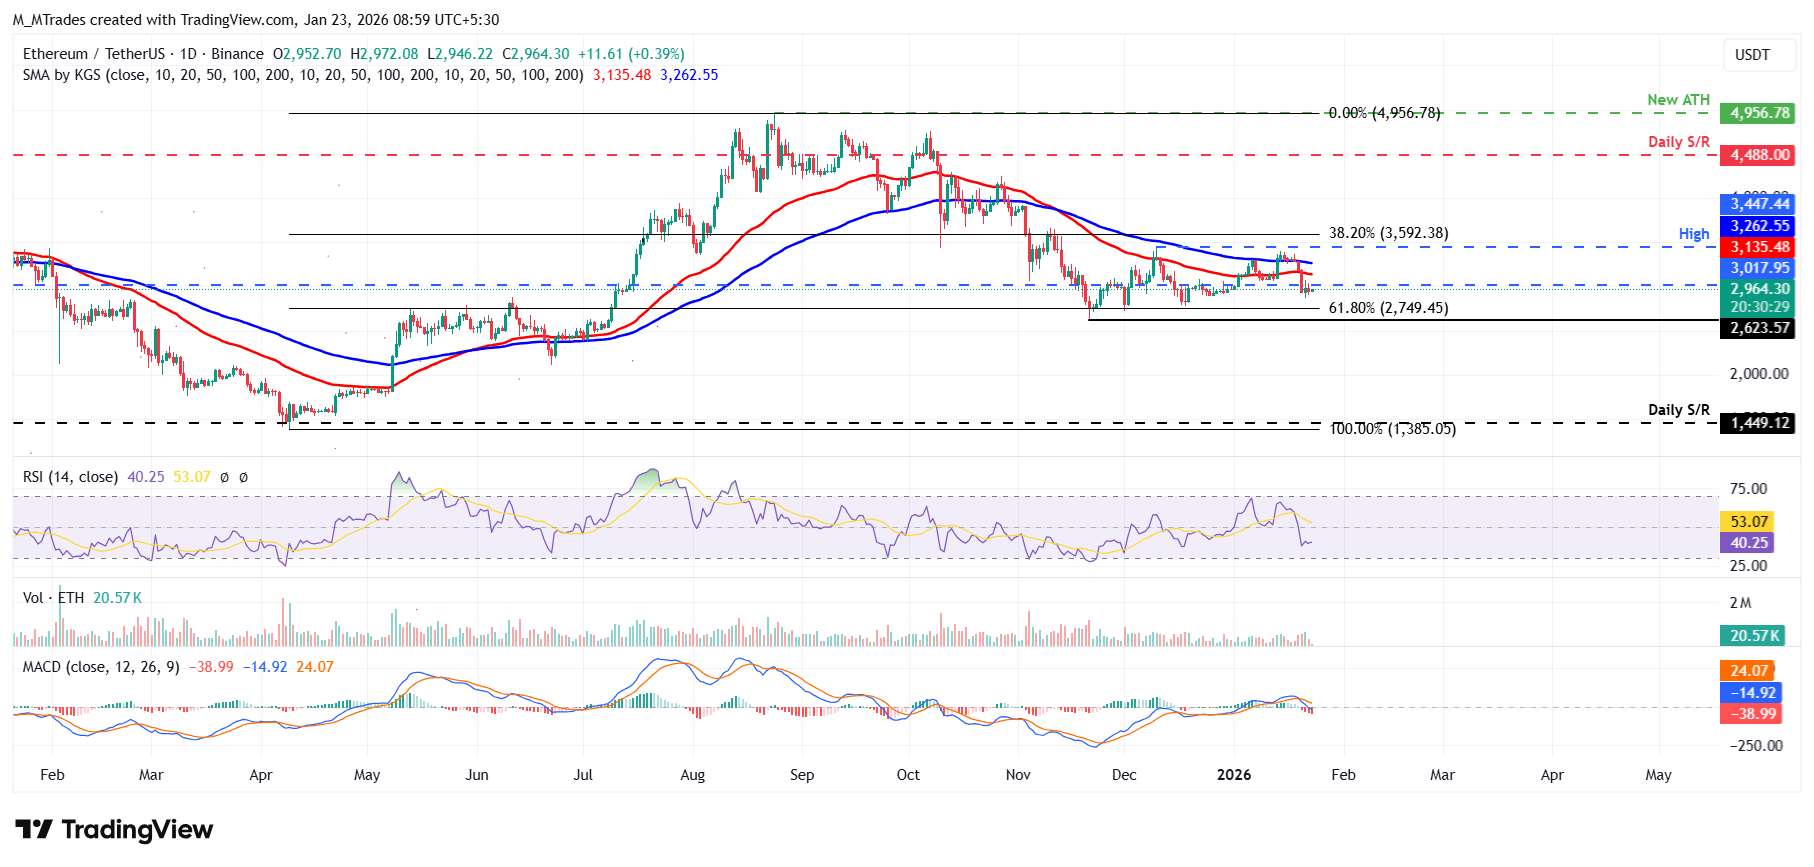
As long as $3,017 keeps acting like resistance, the next downside level to watch is the 61.8% Fibonacci retracement at $2,749.45 (measured from the April low of $1,385 to the August all-time high of $4,956).
Momentum indicators lean bearish. The daily RSI is 40, below the neutral 50 level, which signals that selling pressure is still dominant. The MACD also showed a bearish crossover on Tuesday, reinforcing the downside bias.
If ETH turns higher and reclaims $3,017 with a daily close, price could then aim for the 50-day EMA at $3,135.
XRP sellers keep focus on $1.77
XRP was rejected at the 50-day EMA ($2.04) last week and has dropped more than 8% since the weekend, closing below the daily support at $1.96 on Tuesday. The token bounced modestly on Wednesday but again failed to secure a close above $1.96, before slipping slightly the next day. On Friday, XRP is trading around $1.91.
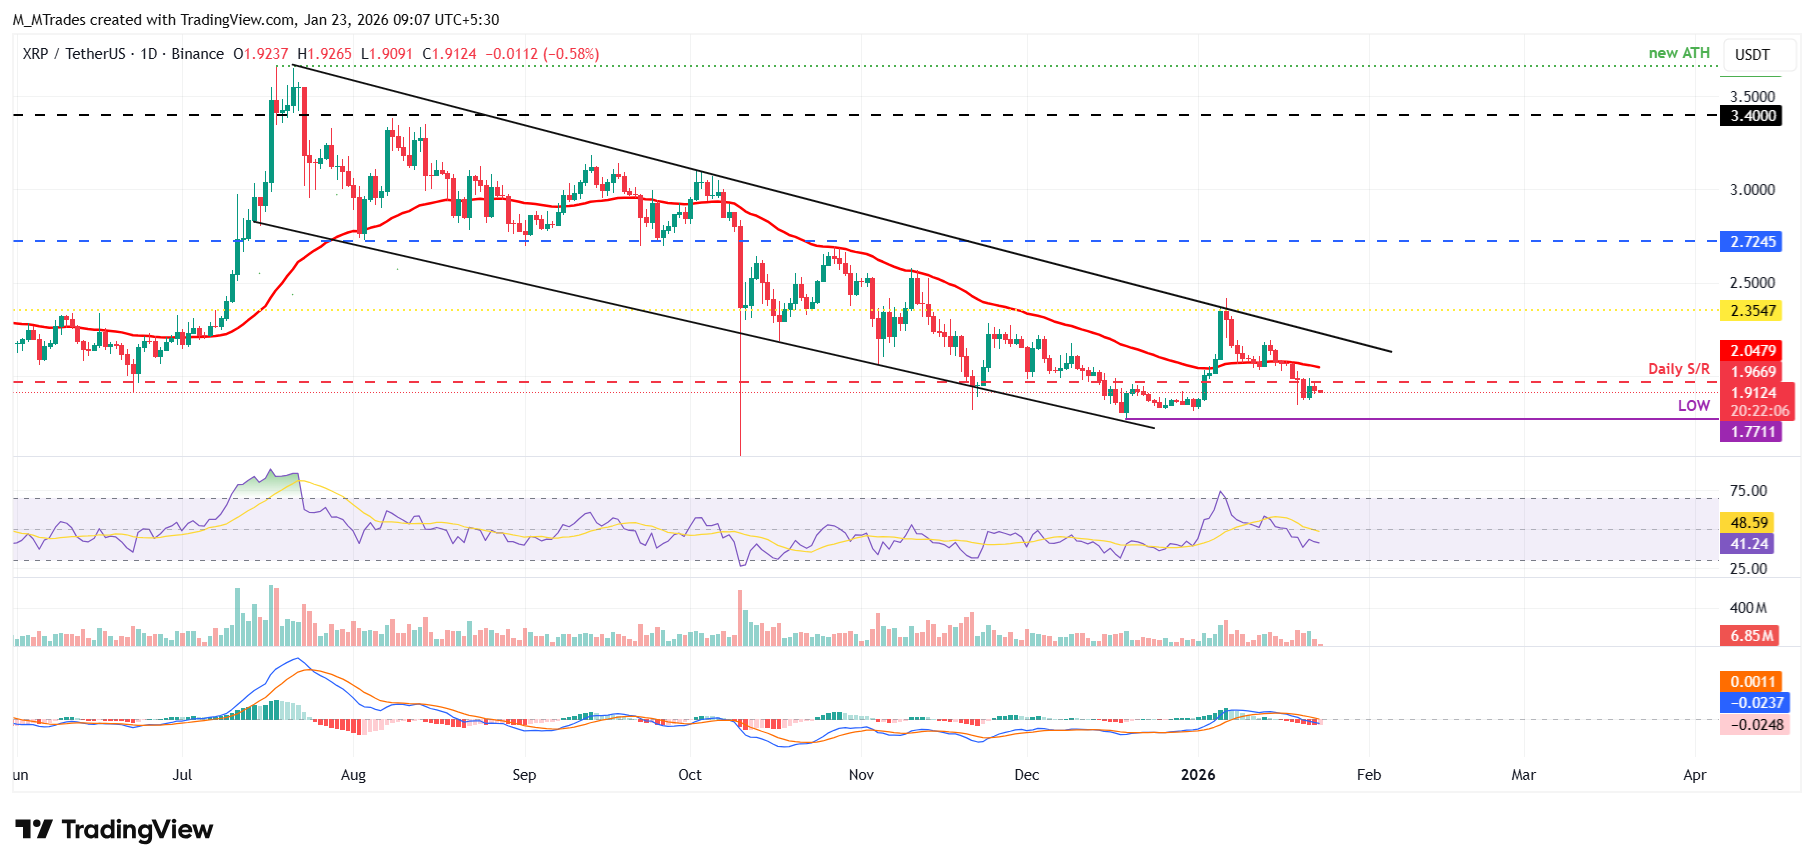
If the correction extends, bears may look toward the December 19 low at $1.77.
As with Ethereum, XRP’s momentum gauges point to a market that is still under pressure, with both RSI and MACD supporting a bearish view.
If XRP manages a recovery and posts a daily close above the daily resistance at $1.966, it could extend the rebound toward the 50-day EMA at $2.04.
Read more
The above content was completed with the assistance of AI and has been reviewed by an editor.


