


Zcash Bear Trap Active After 15% Rebound: What’s Next for ZEC Price?
The Zcash price has done something important after weeks of weakness. Since January 19, the ZEC price has rebounded nearly 15%, lifting from the breakdown low near $336 to around $362. That move came just days after a confirmed bearish pattern break, exactly the kind of setup that often traps aggressive sellers.
The structure still looks dicey on the surface. But under it, accumulation has quietly picked up. Now the focus shifts to one level. Zcash sits roughly 9% below a key Fib level, which also puts a key EMA line in focus. Whether price can reclaim that level may decide if this rebound stays a bounce or turns into something larger, a rally maybe.
Rebound Puts the 100-Day EMA Back in Focus
The rebound did not come out of nowhere.
After the head-and-shoulders breakdown was activated, the Zcash price briefly dipped toward $336 before buyers stepped in to possibly activate the trap.
Since then, the price has climbed about 15%, stalling just below the 100-day EMA (exponential moving average). An EMA is a trend indicator that gives more weight to recent prices.
The last time Zcash reclaimed its 100-day EMA, on December 3, the price went on to rally more than 70% in the weeks that followed. That history does not guarantee a repeat, but it explains why this level matters so much now.
 Zcash Trap Setup: TradingView
Want more token insights like this? Sign up for Editor Harsh Notariya’s Daily Crypto Newsletter here.
At the same time, sellers are still active near resistance. ZEC has struggled to push through $386, where this bounce stalled, showing that supply has not disappeared. This keeps the bearish structure technically alive. The question is whether the buying underneath is strong enough to force a reclaim anyway.
That answer starts with who has been buying since January 19.
Whales Accumulate as Dip Buying Strength Builds
On-chain data shows accumulation where it usually matters most.
Over the past seven days, mega whales (top 100 addresses) have increased their ZEC holdings by roughly 9%, lifting balances to about 42,623 ZEC. That implies a net accumulation of close to 3,500 ZEC during the rebound phase.
Standard whale wallets have followed. Holdings in this cohort rose by about 5%, taking balances to roughly 10,182 ZEC. That equals an additional 480 ZEC accumulated over the same period.
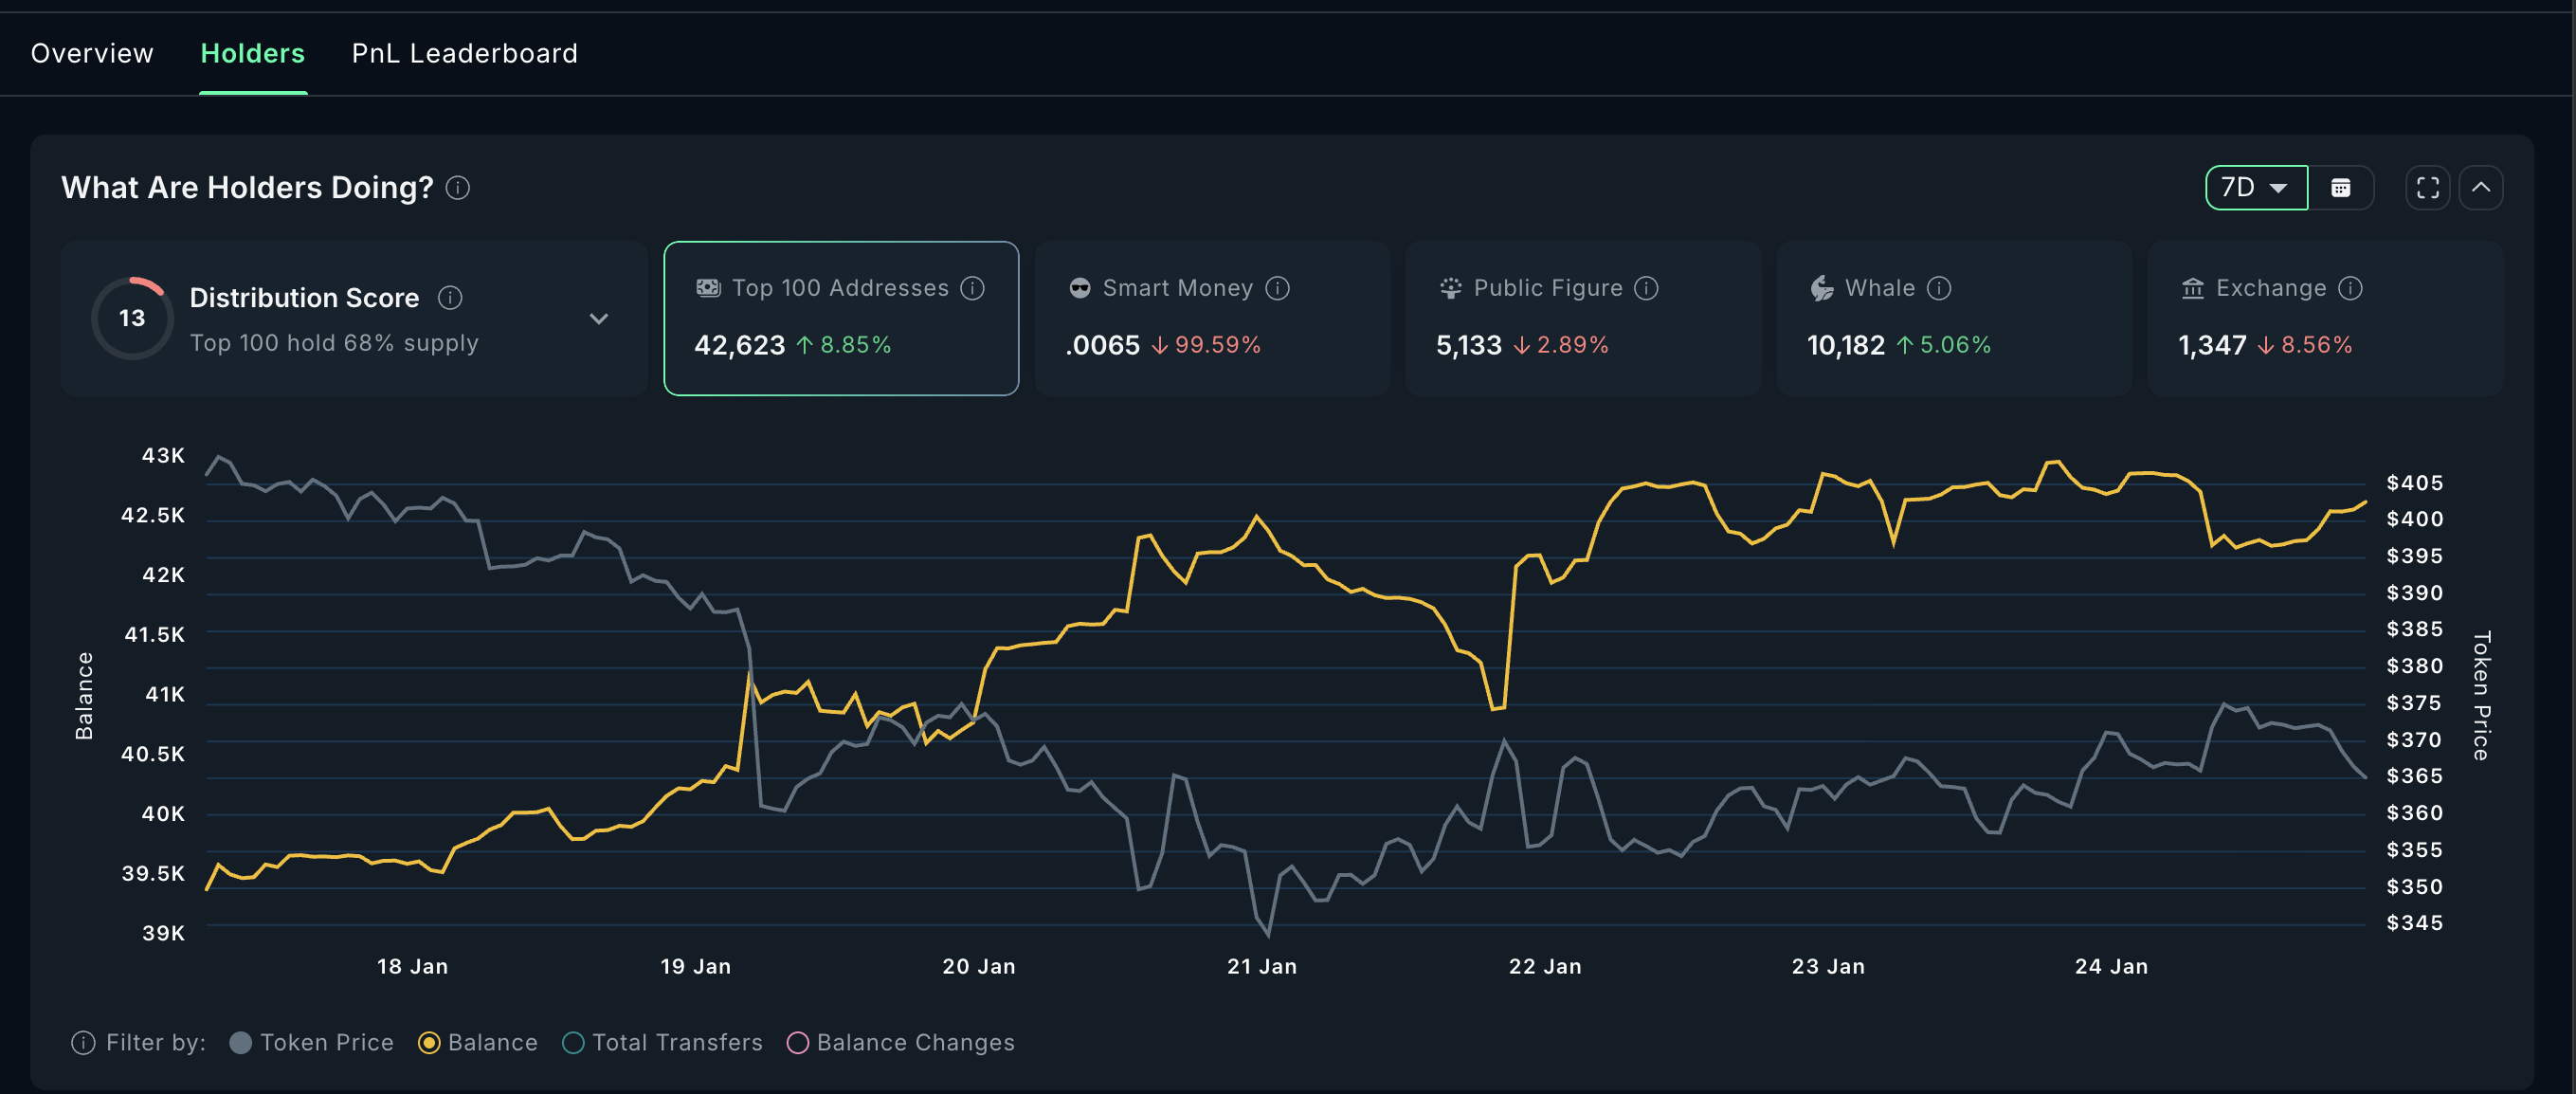 ZEC Accumulation Continues: Nansen
Combined, whales have added around 4,000 ZEC since January 19. This is not buying at highs. It is an accumulation after a confirmed breakdown, expecting price strength. Smart money, however, has left completely, hinting at minimal bounce expectations in the near term.
Momentum indicators support that view. Between January 14 and January 24, ZEC’s price trended lower, but the Money Flow Index moved higher, creating a bullish divergence.
MFI measures buying and selling pressure using both price and volume, a potential dip buying indicator. When price falls while MFI rises, it signals dip buying beneath the surface. That pattern often protects potential downsides.
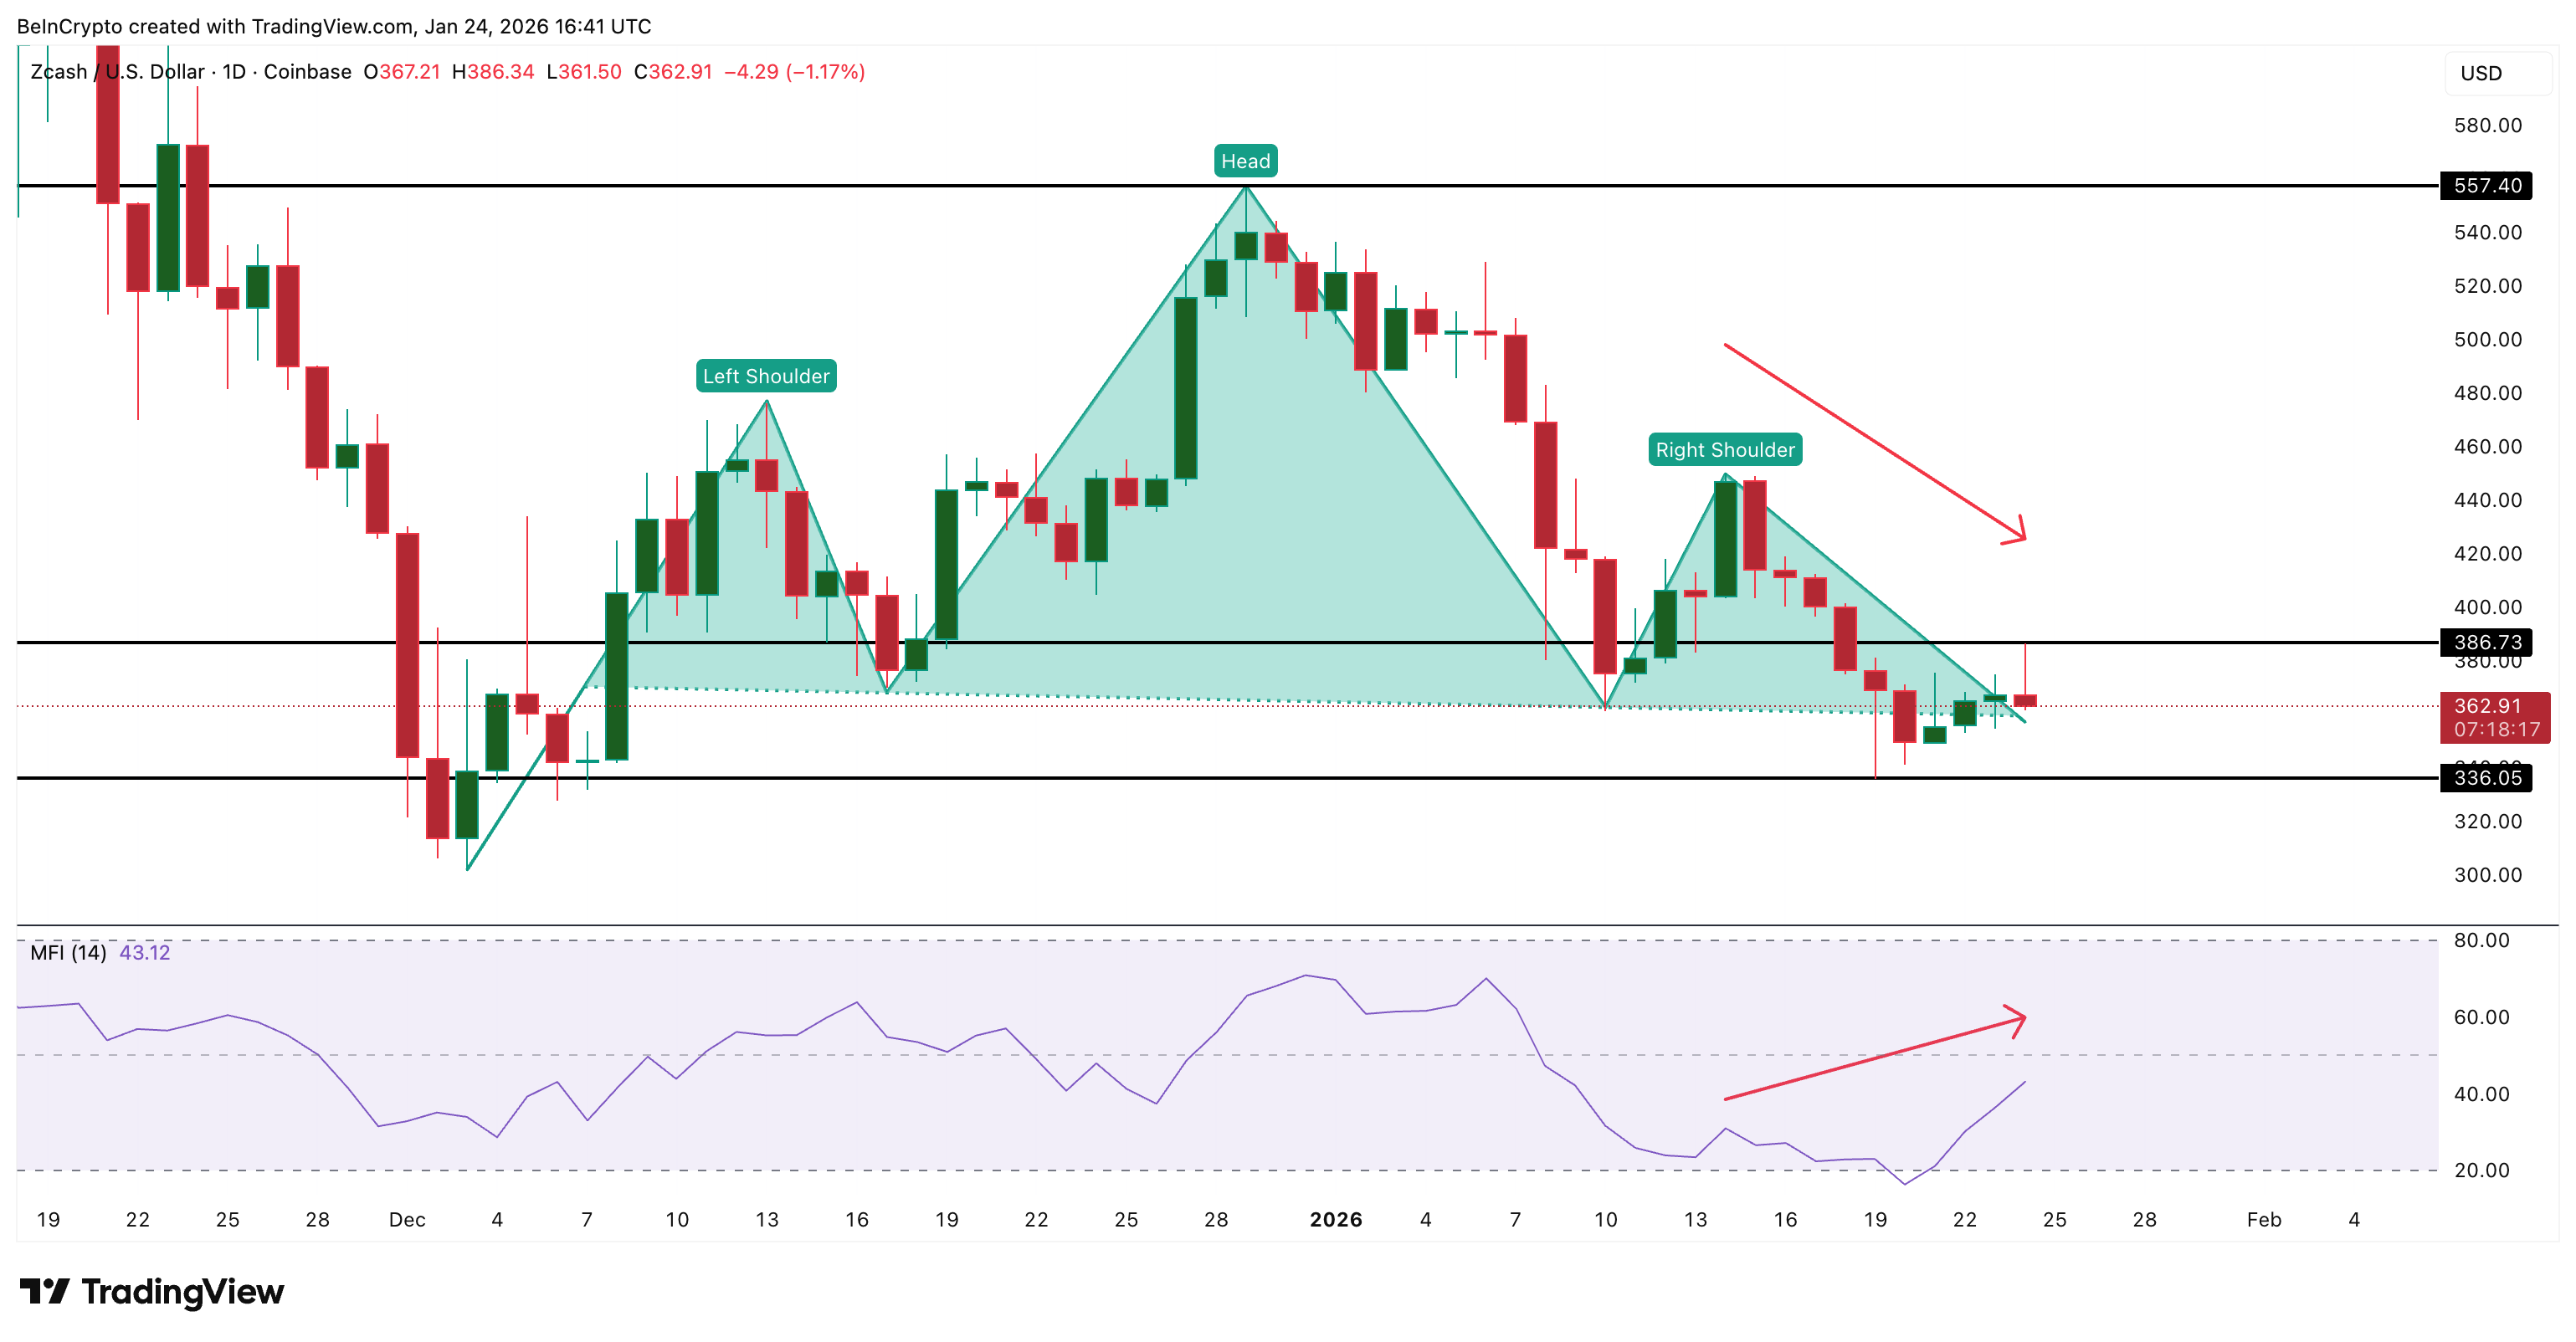 Dip Buying Active: TradingView
Derivatives positioning adds another layer. After the recent move, leverage has reset, turning mostly balanced. Over the next 30 days on Binance ZEC perpetuals, short liquidations still slightly outweigh longs at $26.37 million vs. $22 million in longs.
That imbalance means price does not need a full trend reversal to move higher. Even a moderate push can begin forcing short covering.
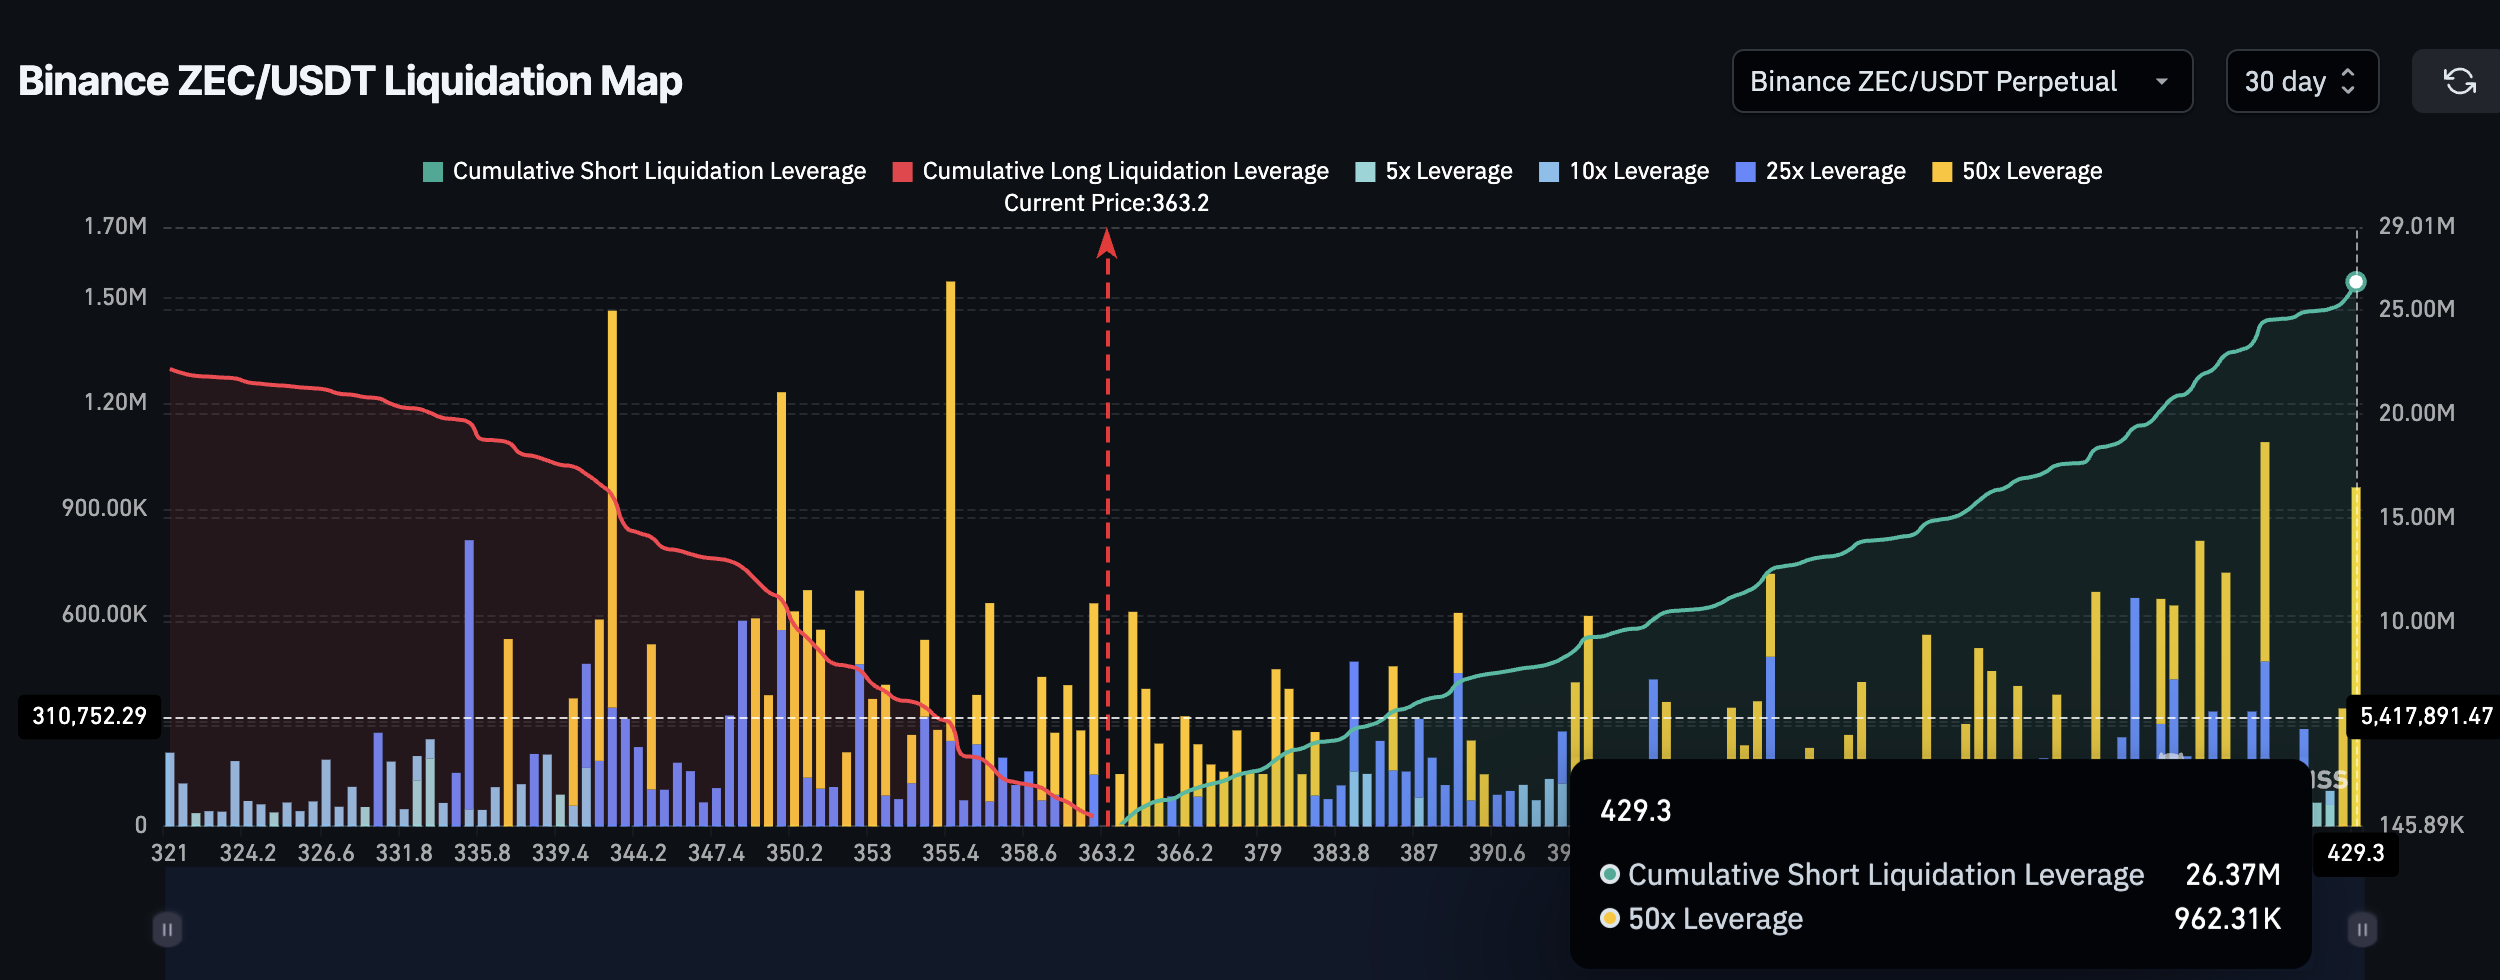 Shorts Still Outweigh Longs: Coinglass
All of these points point to the same thing. Accumulation is present.
Zcash Price Levels That Confirm or Kill the Bear Trap
The structure is now simple.
On the downside, the trap fails if ZEC loses $335-$336 on a daily close. A move back below that level keeps the bearish pattern active and reopens the path toward deeper downside.
On the upside, the key test sits near $386-$395 (the 0.236 Fib level), roughly a 9% move from current levels. That zone lines up with the 100-day EMA. A daily close above it would mirror the December reclaim and materially weaken the bearish structure.
If that reclaim happens, the next upside zone comes in near $463, where prior supply and liquidation clusters sit. A push beyond that would invalidate the right shoulder of the head-and-shoulders pattern entirely. Above $557, the broader bearish thesis breaks down.
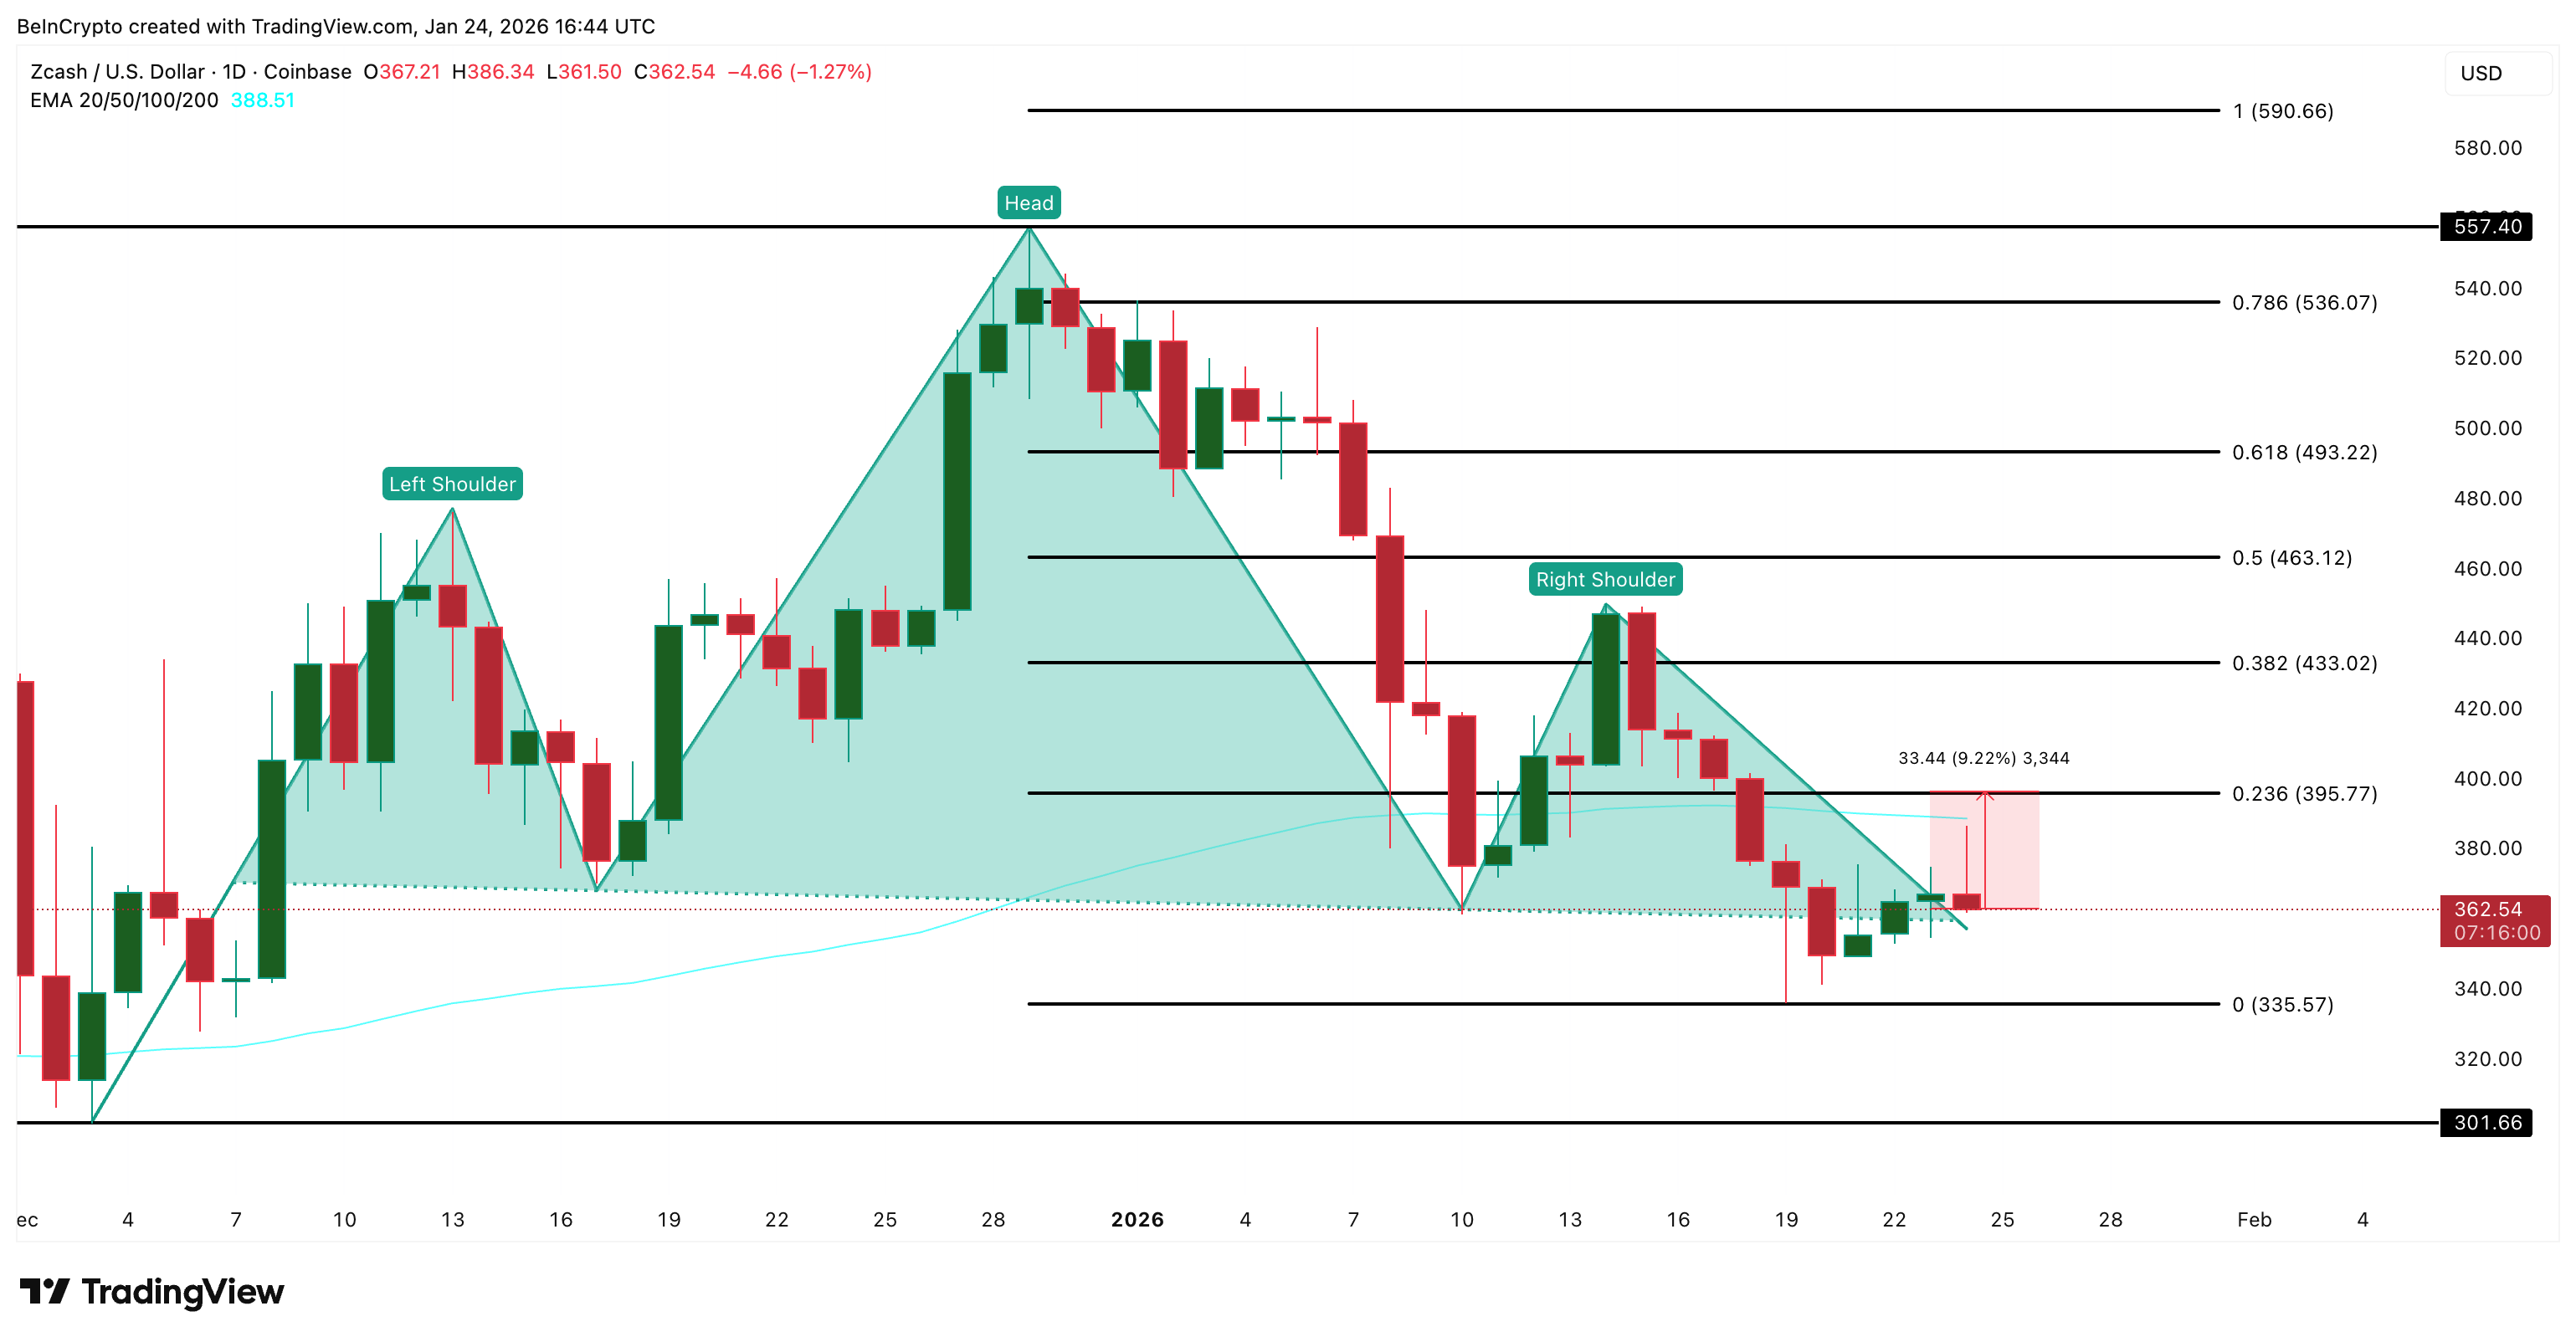 Zcash Price Analysis: TradingView
Until one of those levels gives way, the Zcash price remains in a narrow decision zone.
The takeaway is straightforward. ZEC has already rebounded 15%, whales are accumulating into weakness, and dip buying pressure is visible. Price now sits just 9% from the level that historically unlocked much larger moves.
Recommended Articles


