

Did Axie Infinity (AXS) Whales Just Buy Into a Pullback Risk After a 41% Rally?
The Axie Infinity price has pulled back, but the bigger question is why whales are buying now. Since breaking out on January 21, the AXS price surged roughly 41%, hitting a wall near $3.00. The rally was fast and largely uninterrupted. Now, warning signs are appearing, price down over 17% day-on-day, even as large holders quietly add exposure.
This sets up a clear conflict. Whales are stepping back in, but several chart signals suggest a near-term pullback risk is rising.
A Bearish Harami Signaled Buyer Fatigue After the Rally
The first warning of the early 24-hour crash came from the daily AXS candle structure. A bearish harami pattern formed near recent highs. A bearish harami happens when a small red candle forms inside the body of a prior strong green candle. It signals that buyers are losing momentum and sellers are beginning to push back.
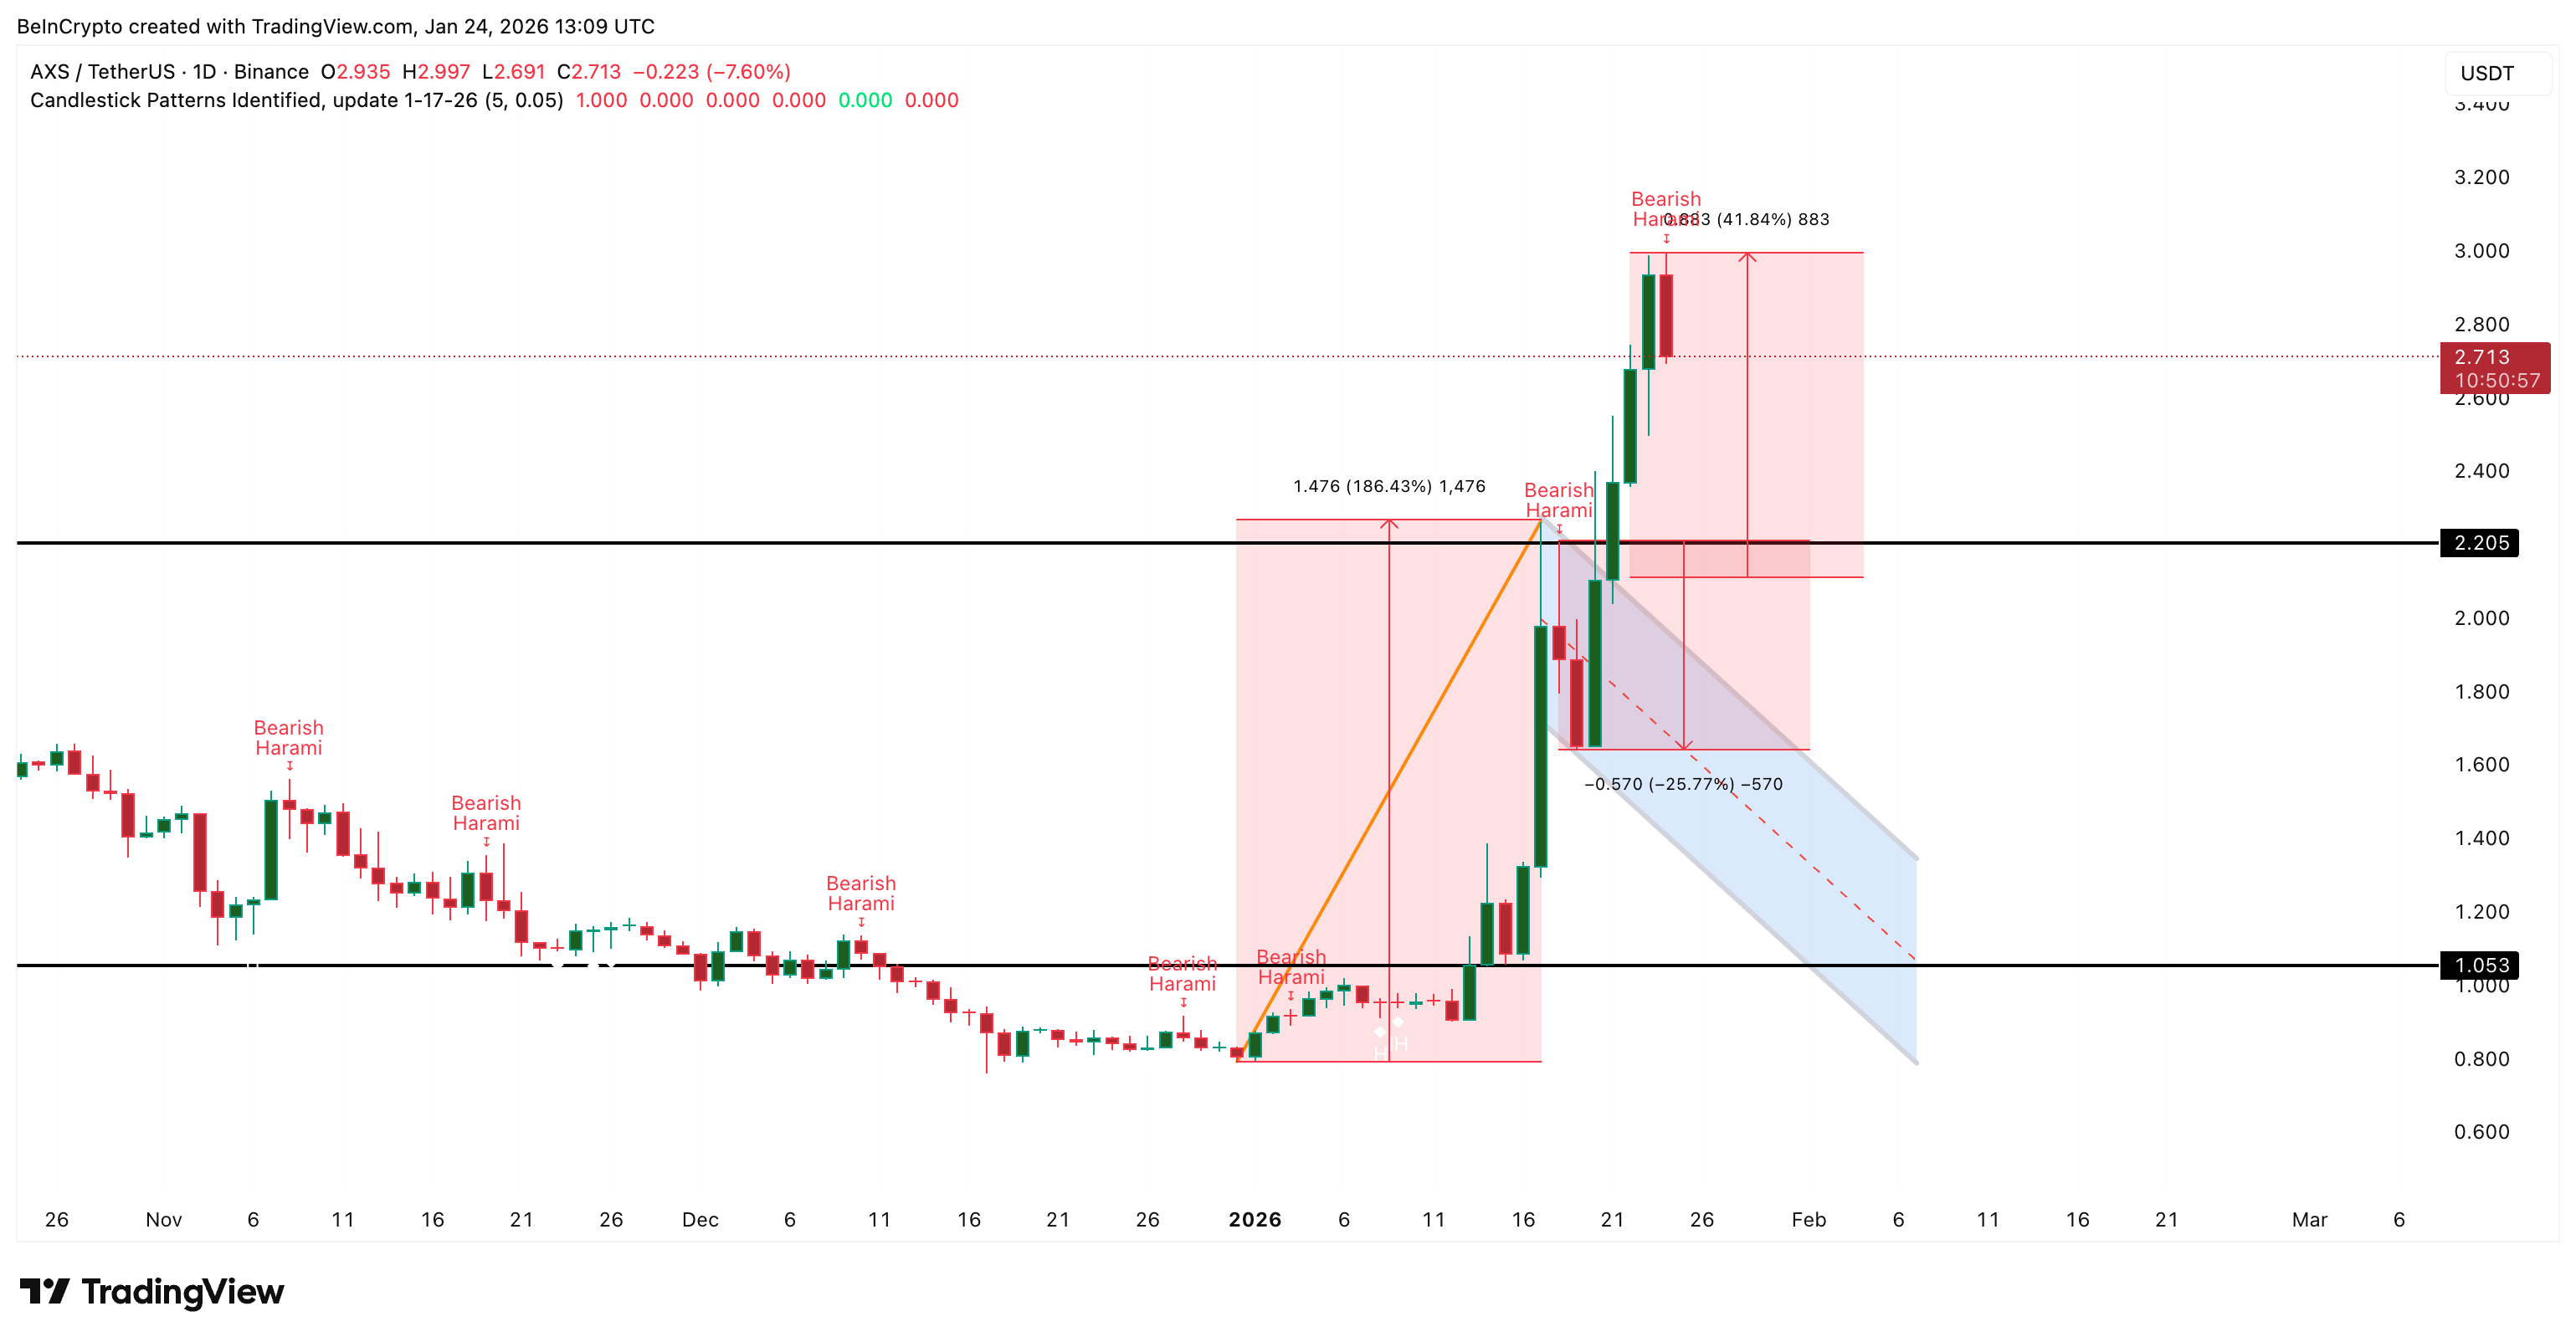 Axie Infinity Price Fractal: TradingView
Want more token insights like this? Sign up for Editor Harsh Notariya’s Daily Crypto Newsletter here.
This pattern matters because Axie Infinity has shown this behavior before. On January 18, a similar bearish harami appeared after a strong advance. In the days that followed, AXS corrected by nearly 26%. That move was driven by buyers stepping back while sellers used higher prices to exit.
This means a bigger crash could be coming, especially since AXS is down 17% over the past 24 hours. After a 41% rally, it signals that upside strength is no longer expanding. At least, not for a while.
Whales Are Finally Buying Again — Misplaced Optimism?
On-chain data shows something important has changed. Axie Infinity whales had been reducing exposure during earlier phases of the rally. That selling pressure was visible across Santiment data and coincided with steady price advances. That confirms that AXS whales might be using the 220% month-on-month Axie Infinity price strength to offload their otherwise loss-making positions.
That behavior has now shifted.
Since January 22, whale wallets increased their holdings from about 243.78 million AXS to roughly 243.94 million AXS. This equals an addition of around 160,000 tokens. At the current price, buying was worth roughly $430,000.
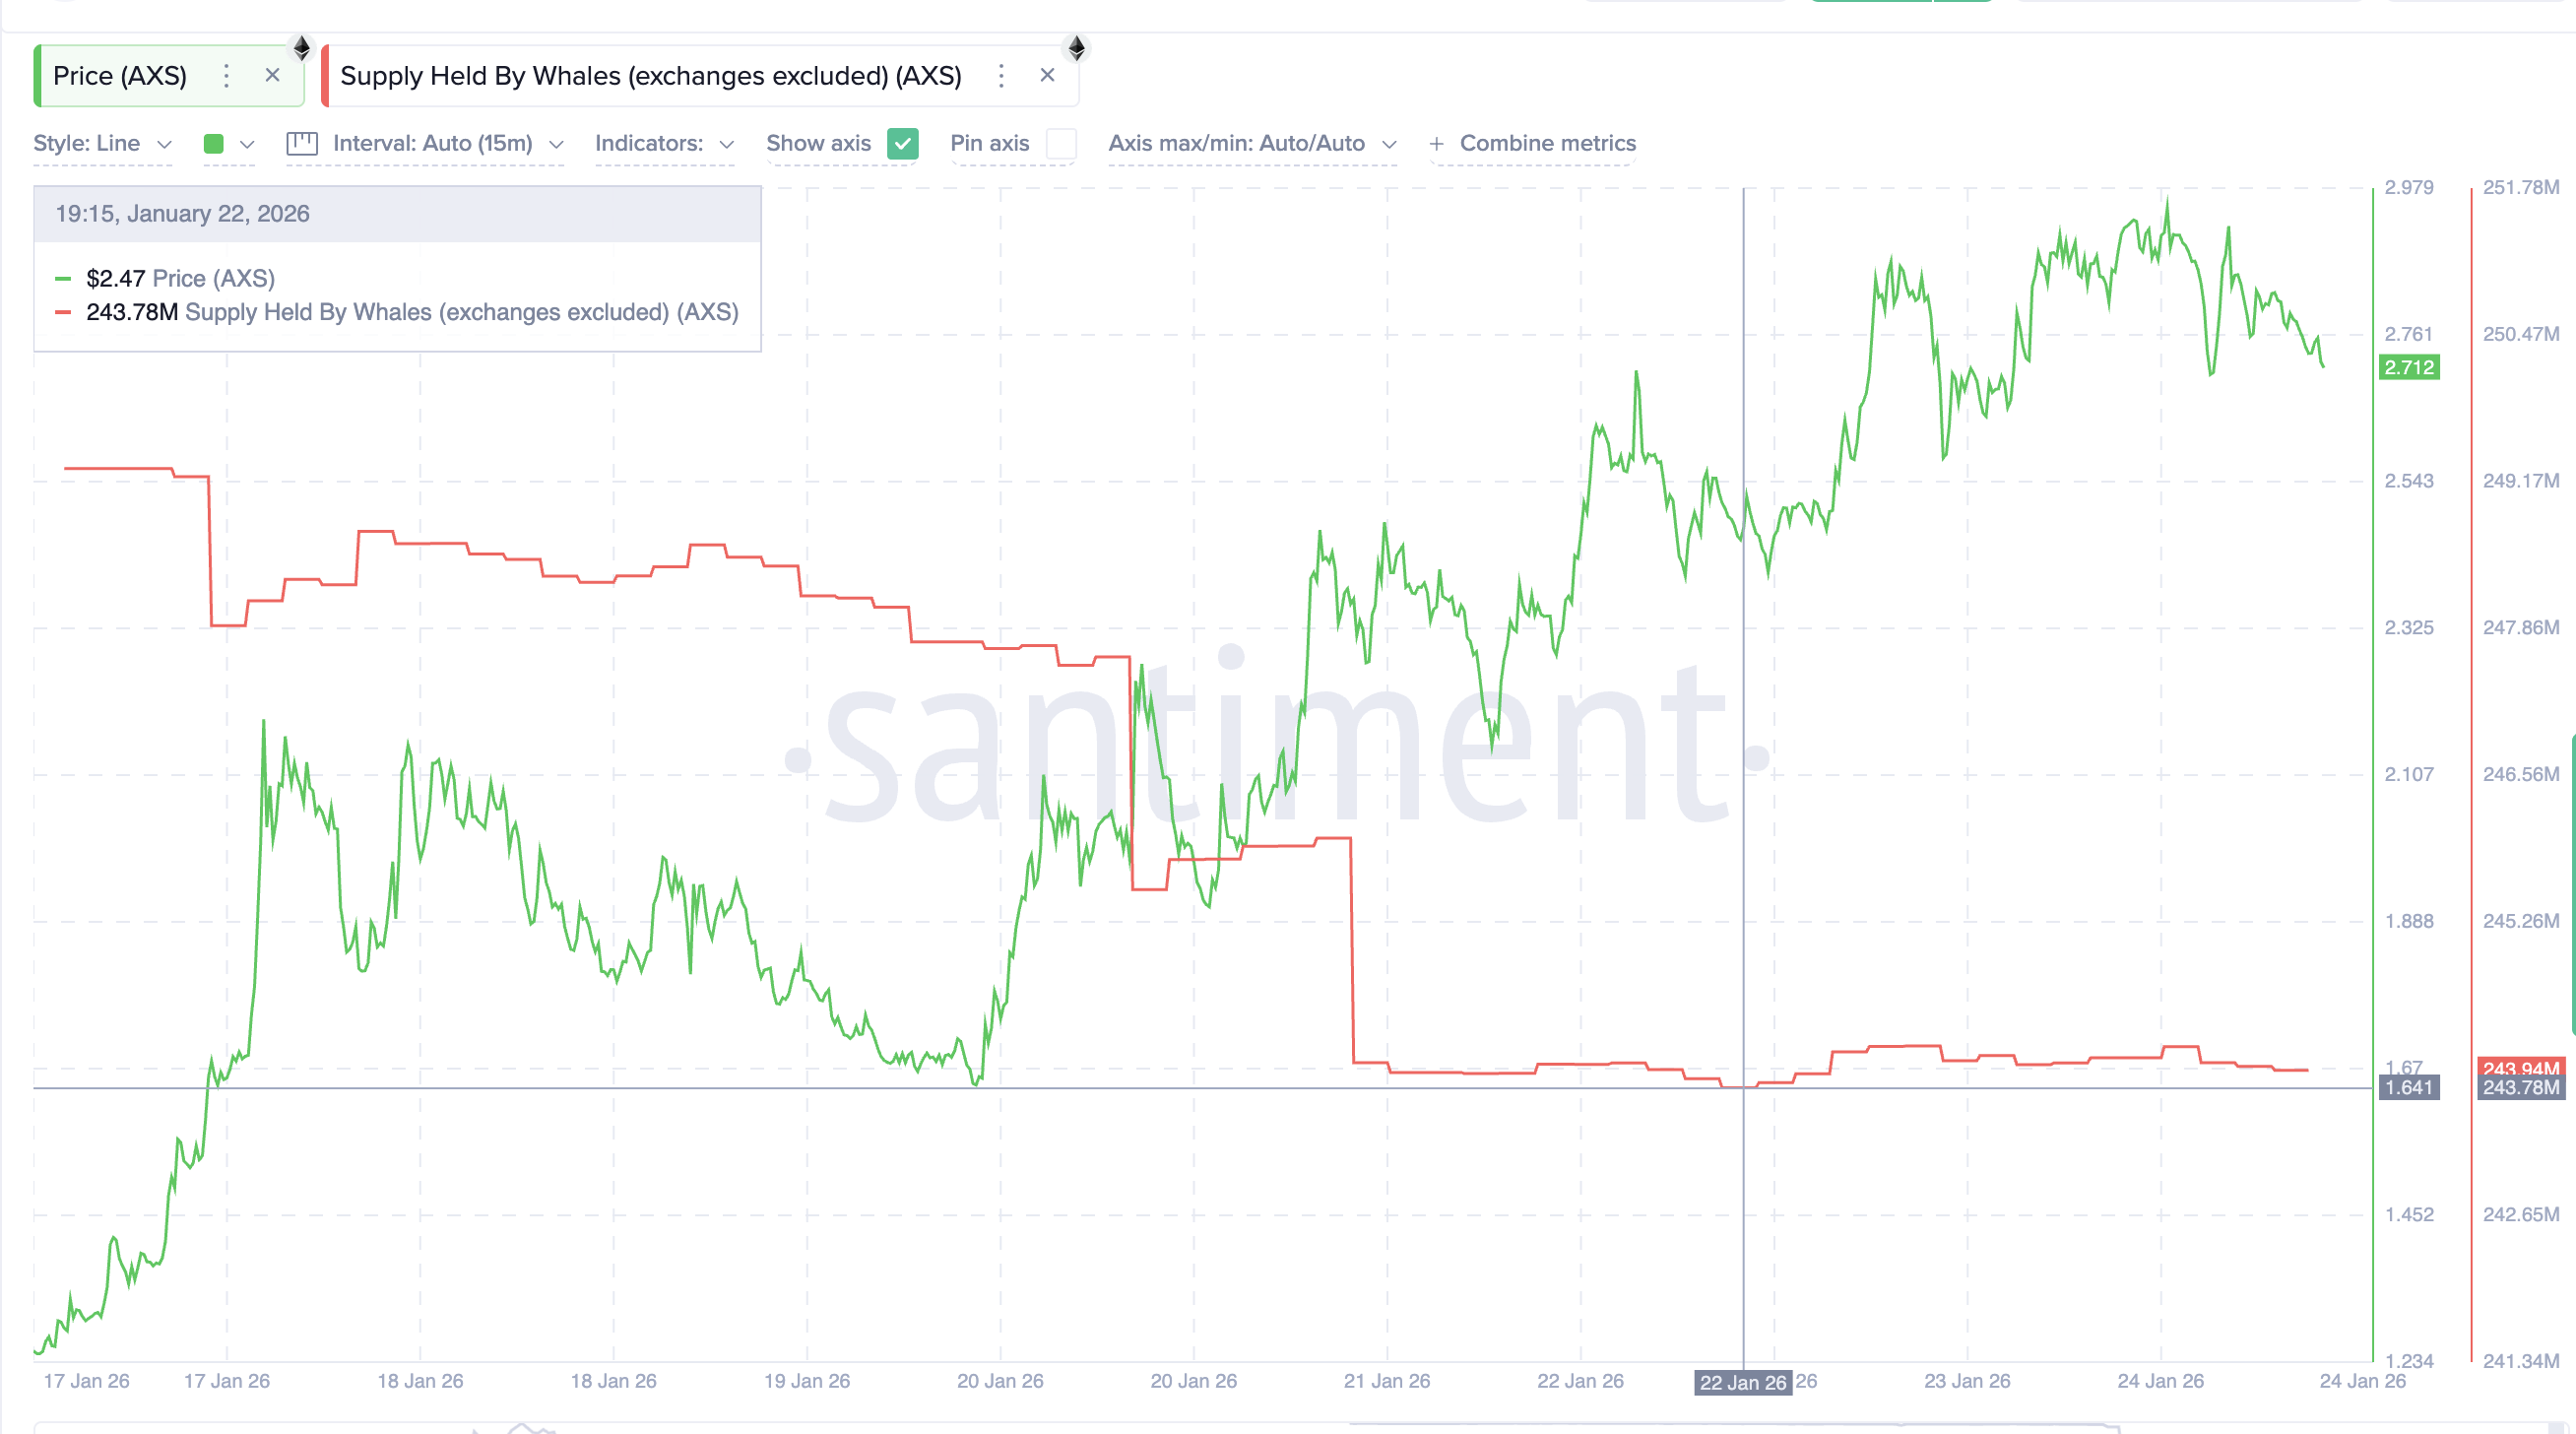 AXS Whales: Santiment
This suggests whales were no longer using rallies to exit. Instead, they appeared to be positioning themselves into strength and conviction.
That currently adds a layer of support, but it does not remove the short-term risk posed by the bearish harami candlestick pattern earlier that already started the correction.
Exchange flow data confirms this mixed picture. On January 15, Axie Infinity saw heavy exchange inflows of about 4.07 million tokens, a clear sign of selling pressure. By January 18, flows flipped sharply negative, with around 465,000 tokens leaving exchanges, showing strong buying demand.
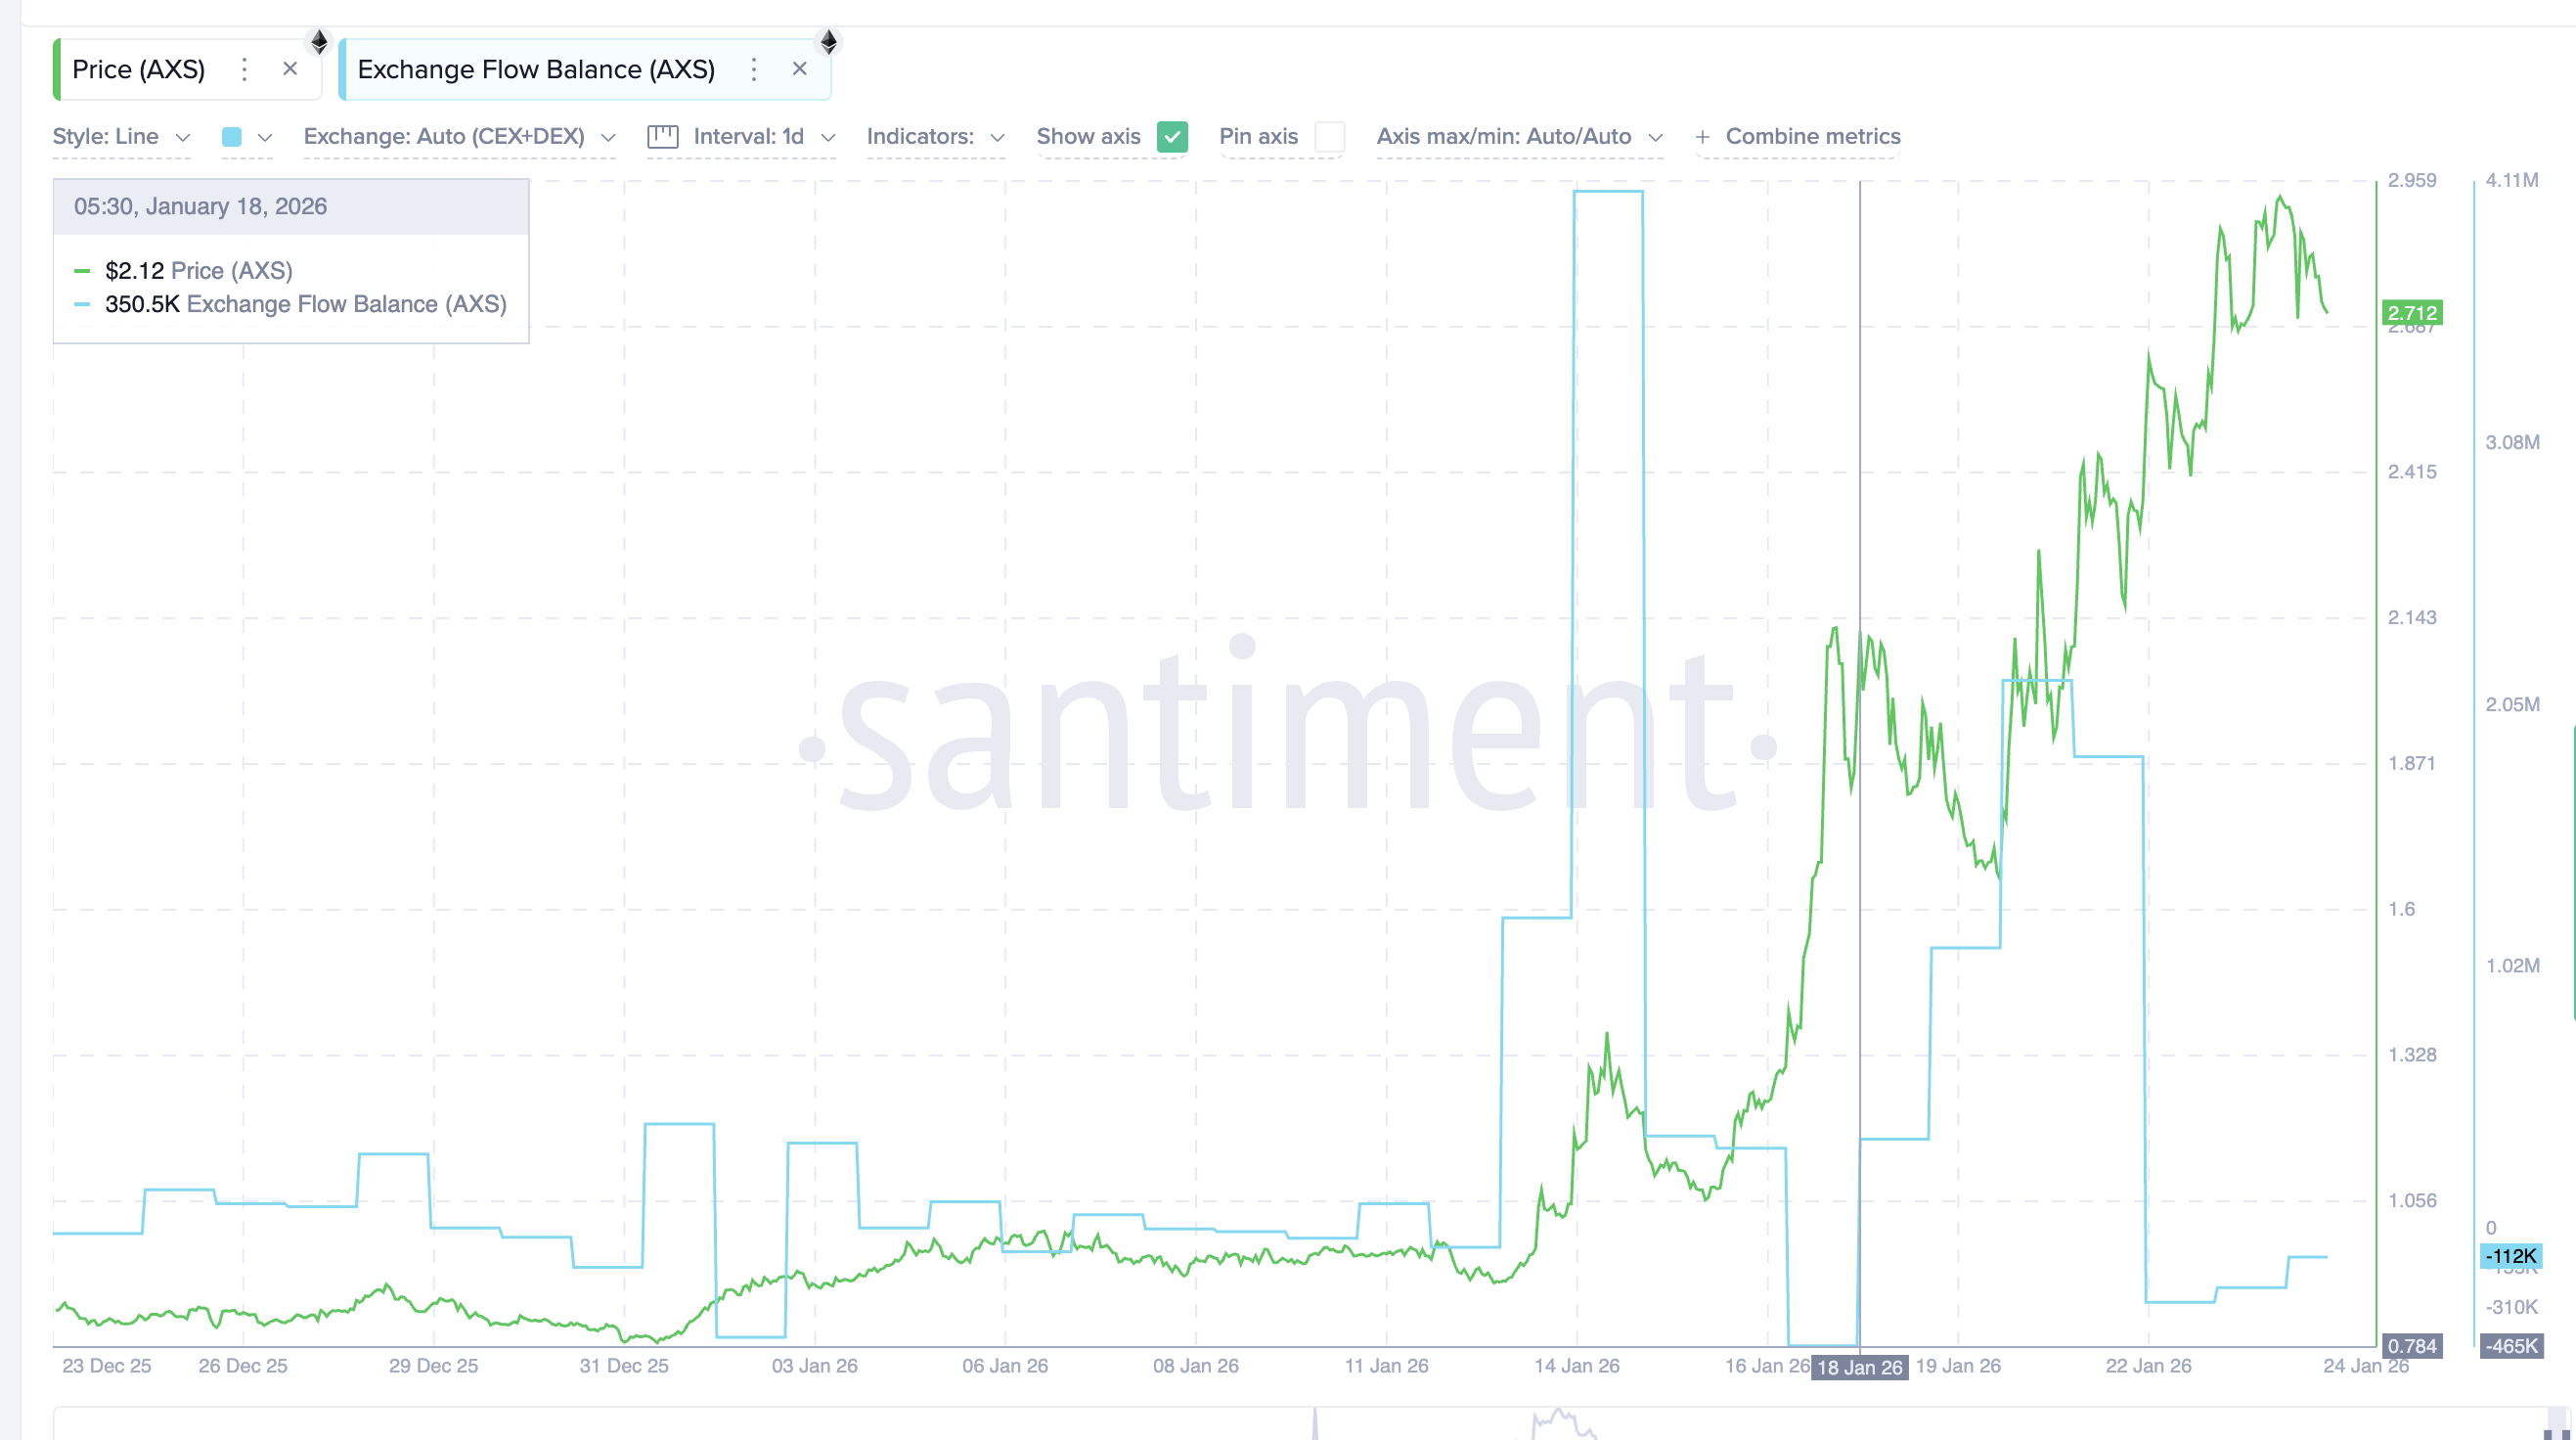 Exchange Flows Still Buyer-Biased: Santiment
As of January 24, exchange outflows have slowed to roughly 112,000 tokens. That means buyers still dominate, but demand is weaker than before. Profit-taking has begun, even as whales selectively add. Are the whales making the right call?
MFI Divergence and AXS Price Levels Were The Deciders
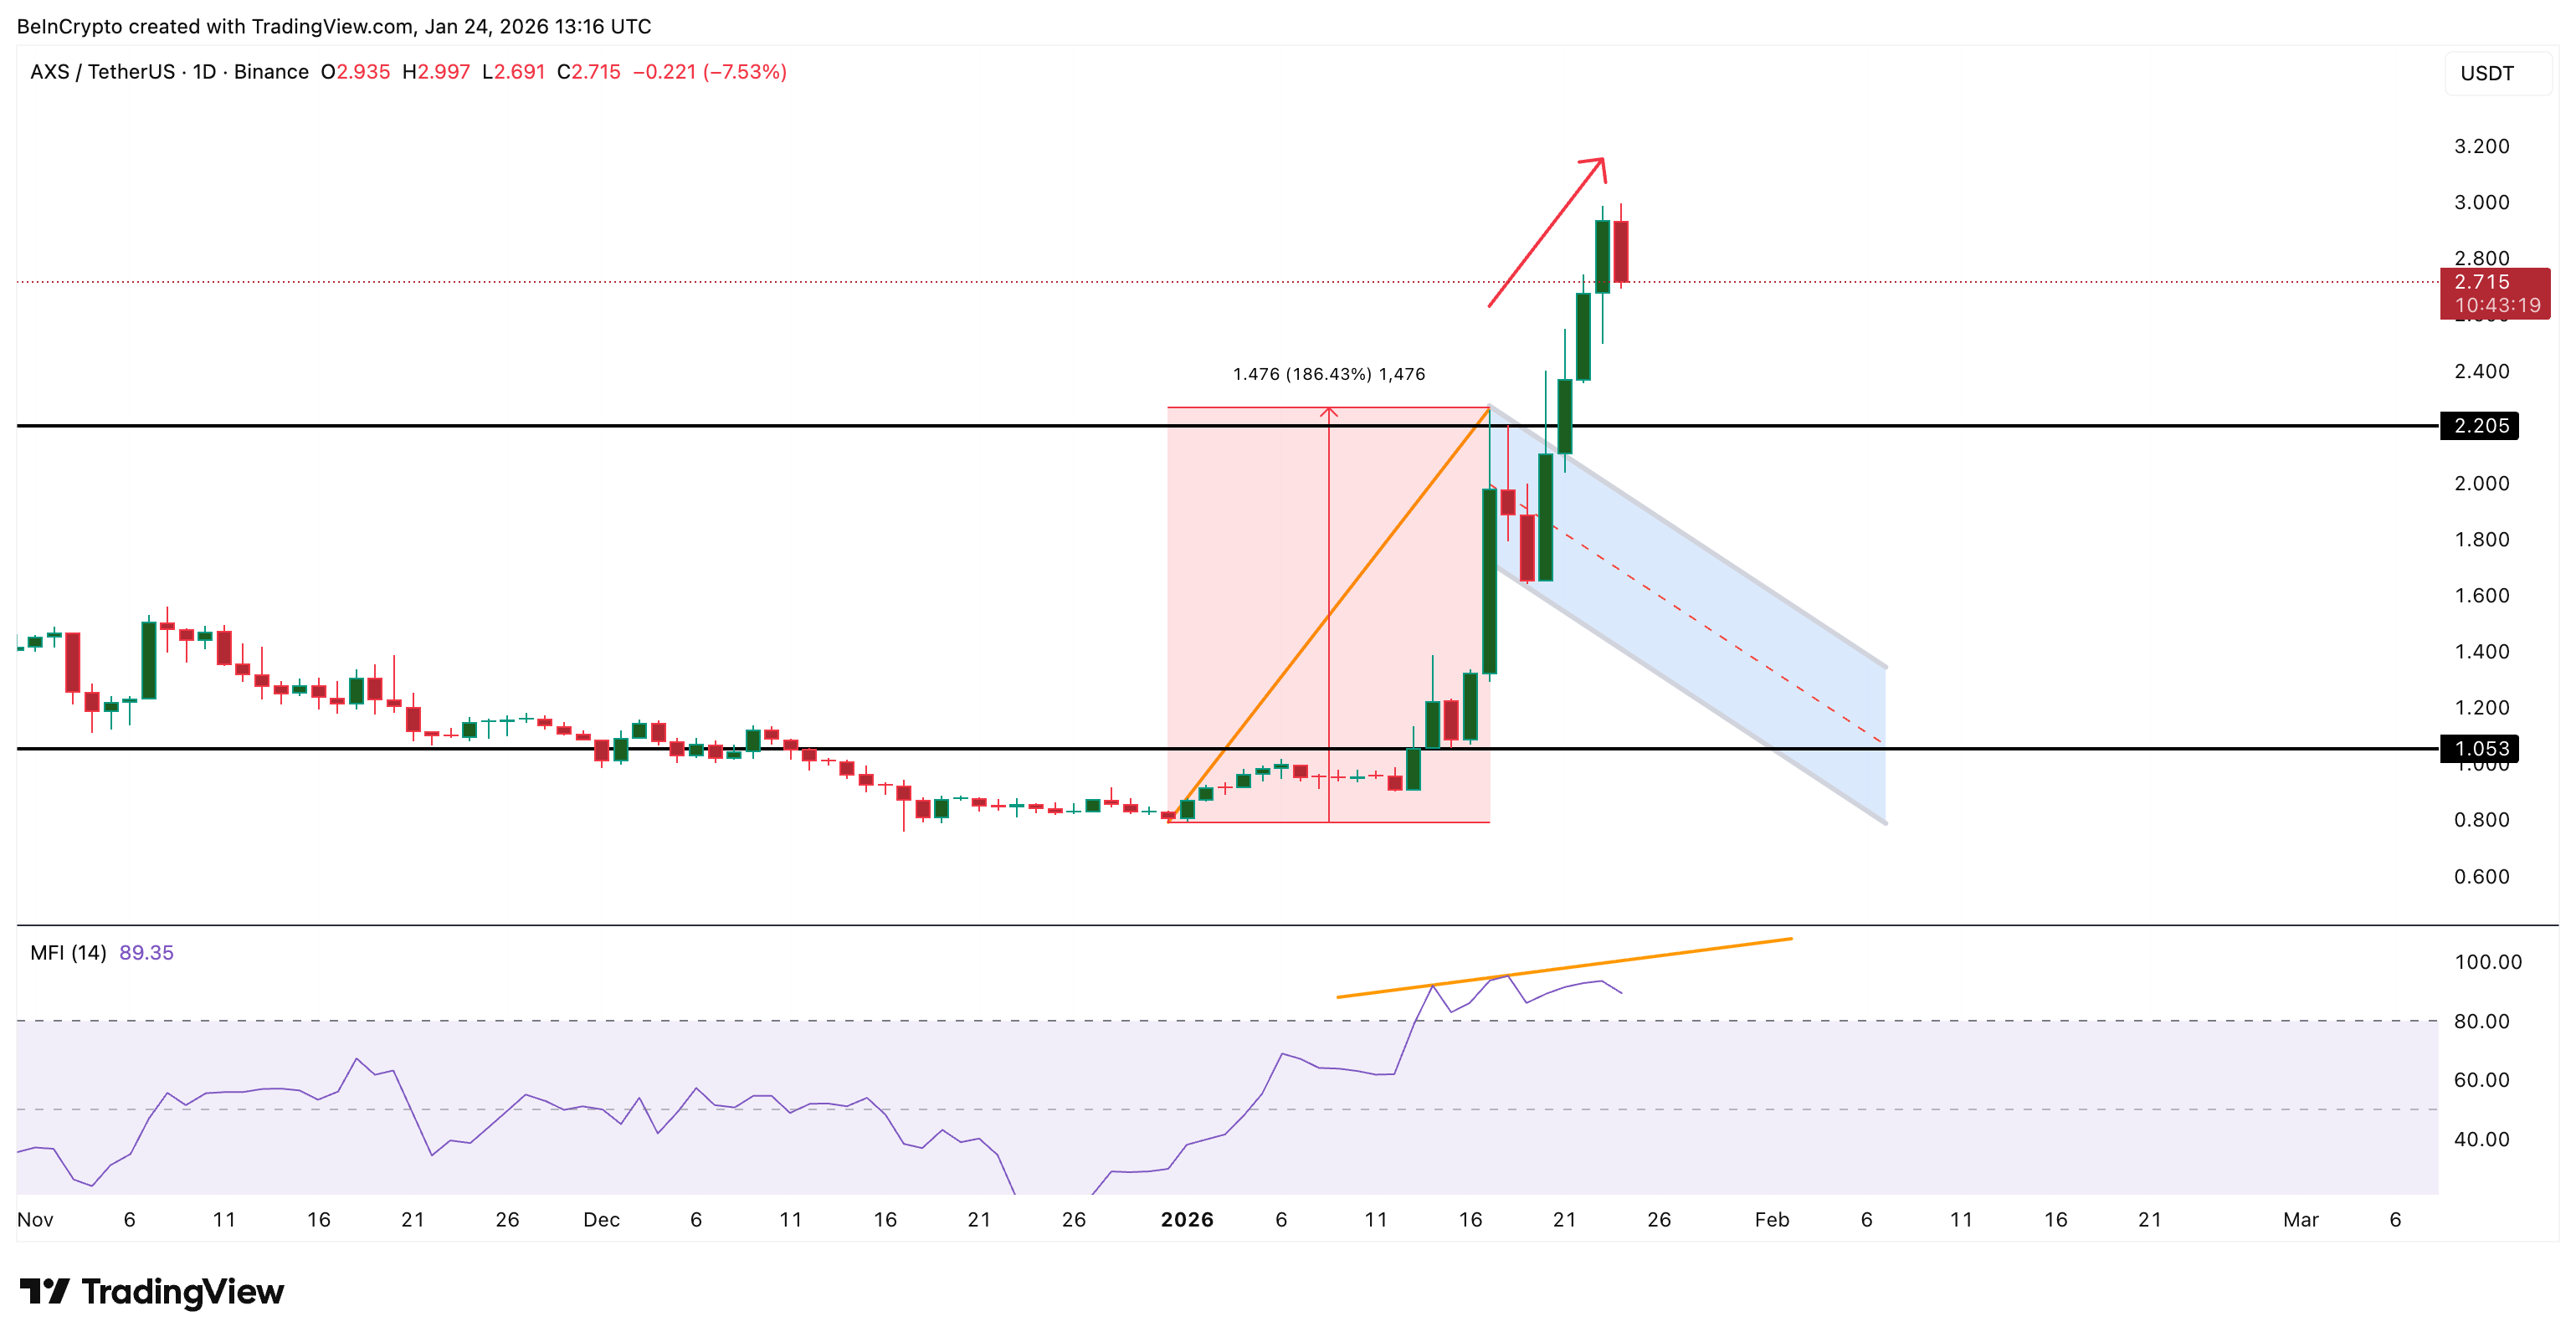
Momentum indicators reinforced the caution. The Money Flow Index, which tracks buying and selling pressure using price and volume, trended lower even as the price moved higher between January 17 and January 23, at $2.71
 Dip Buying Weakens: TradingView
It showed that dips were not being bought as aggressively as earlier in the rally. The AXS price began sliding, and the minimal immediate support beneath it pushed the level lower.
From a price perspective, key levels quickly came into focus. On the upside,Axie Infinity needed to reclaim and hold above $3.00 ( a key psychological level rejecting the price earlier), then push through $3.11. A clean break above $3.11 could have reopened the path toward $4.02.
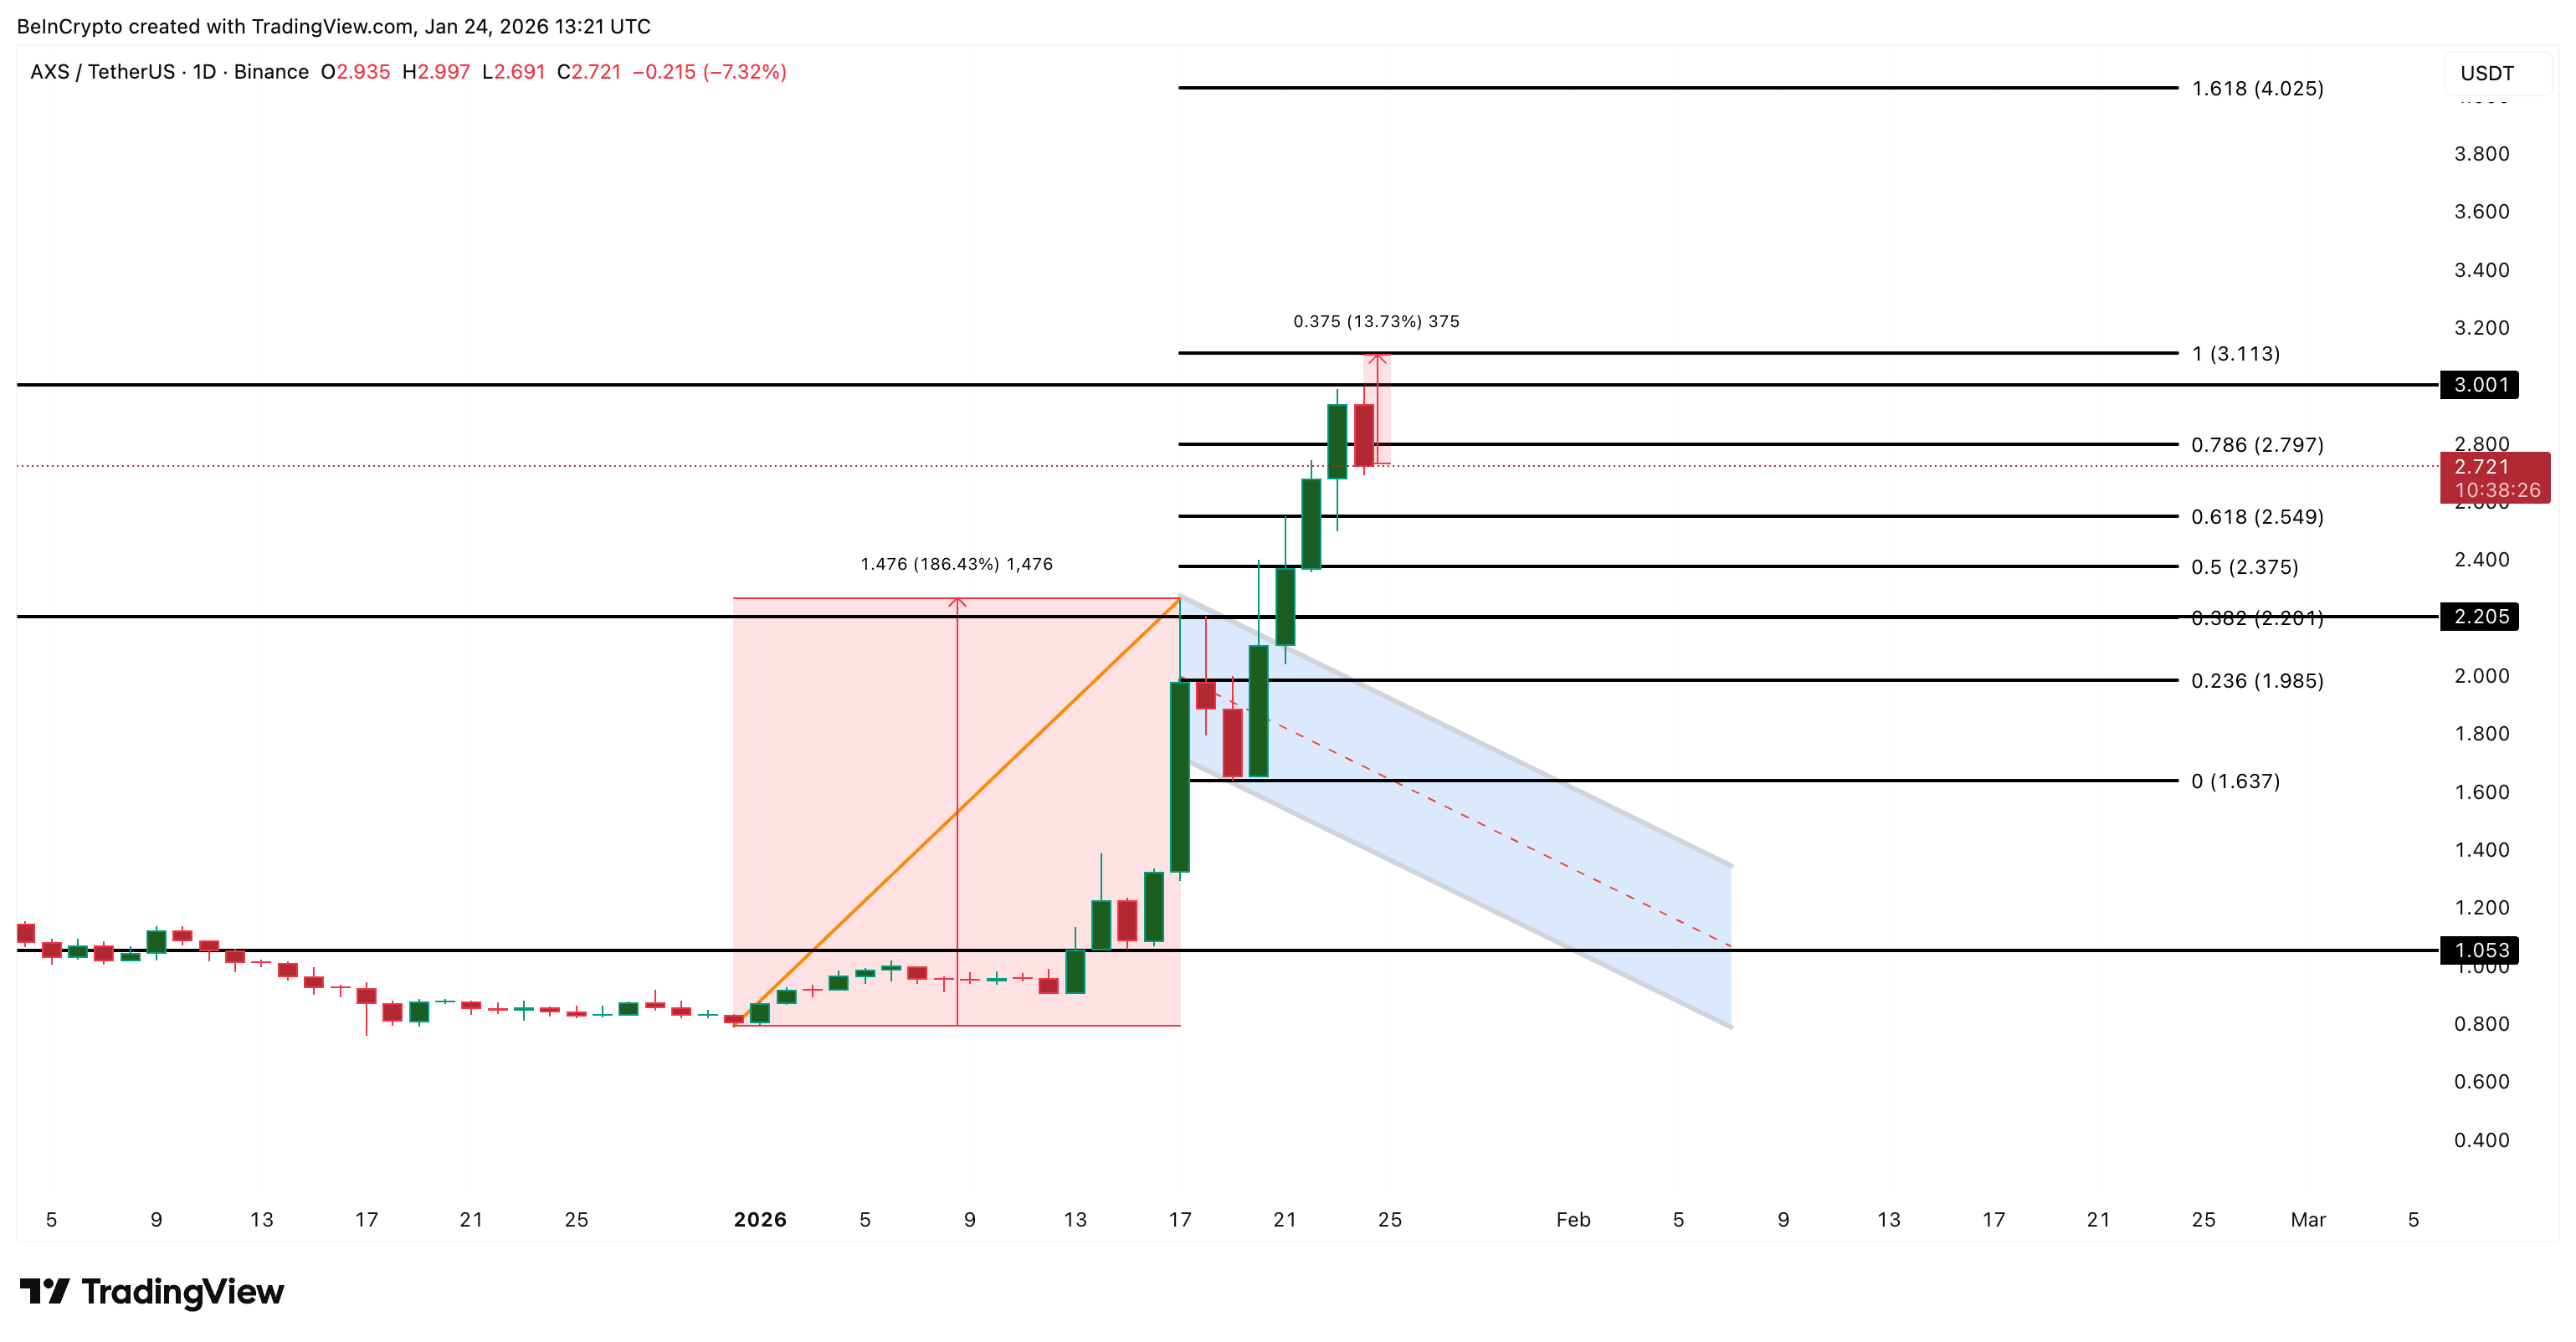 AXS Price Analysis: TradingView
But that didn’t happen.
On the downside, $2.54 stood out as the critical support. This level is aligned with the 0.618 Fibonacci retracement and acted as a strong reaction zone in the past. AXS lost $2.54, and the correction started.
The pullback could now deepen toward $2.20 and even $1.98, trapping the whales deeper in the process.
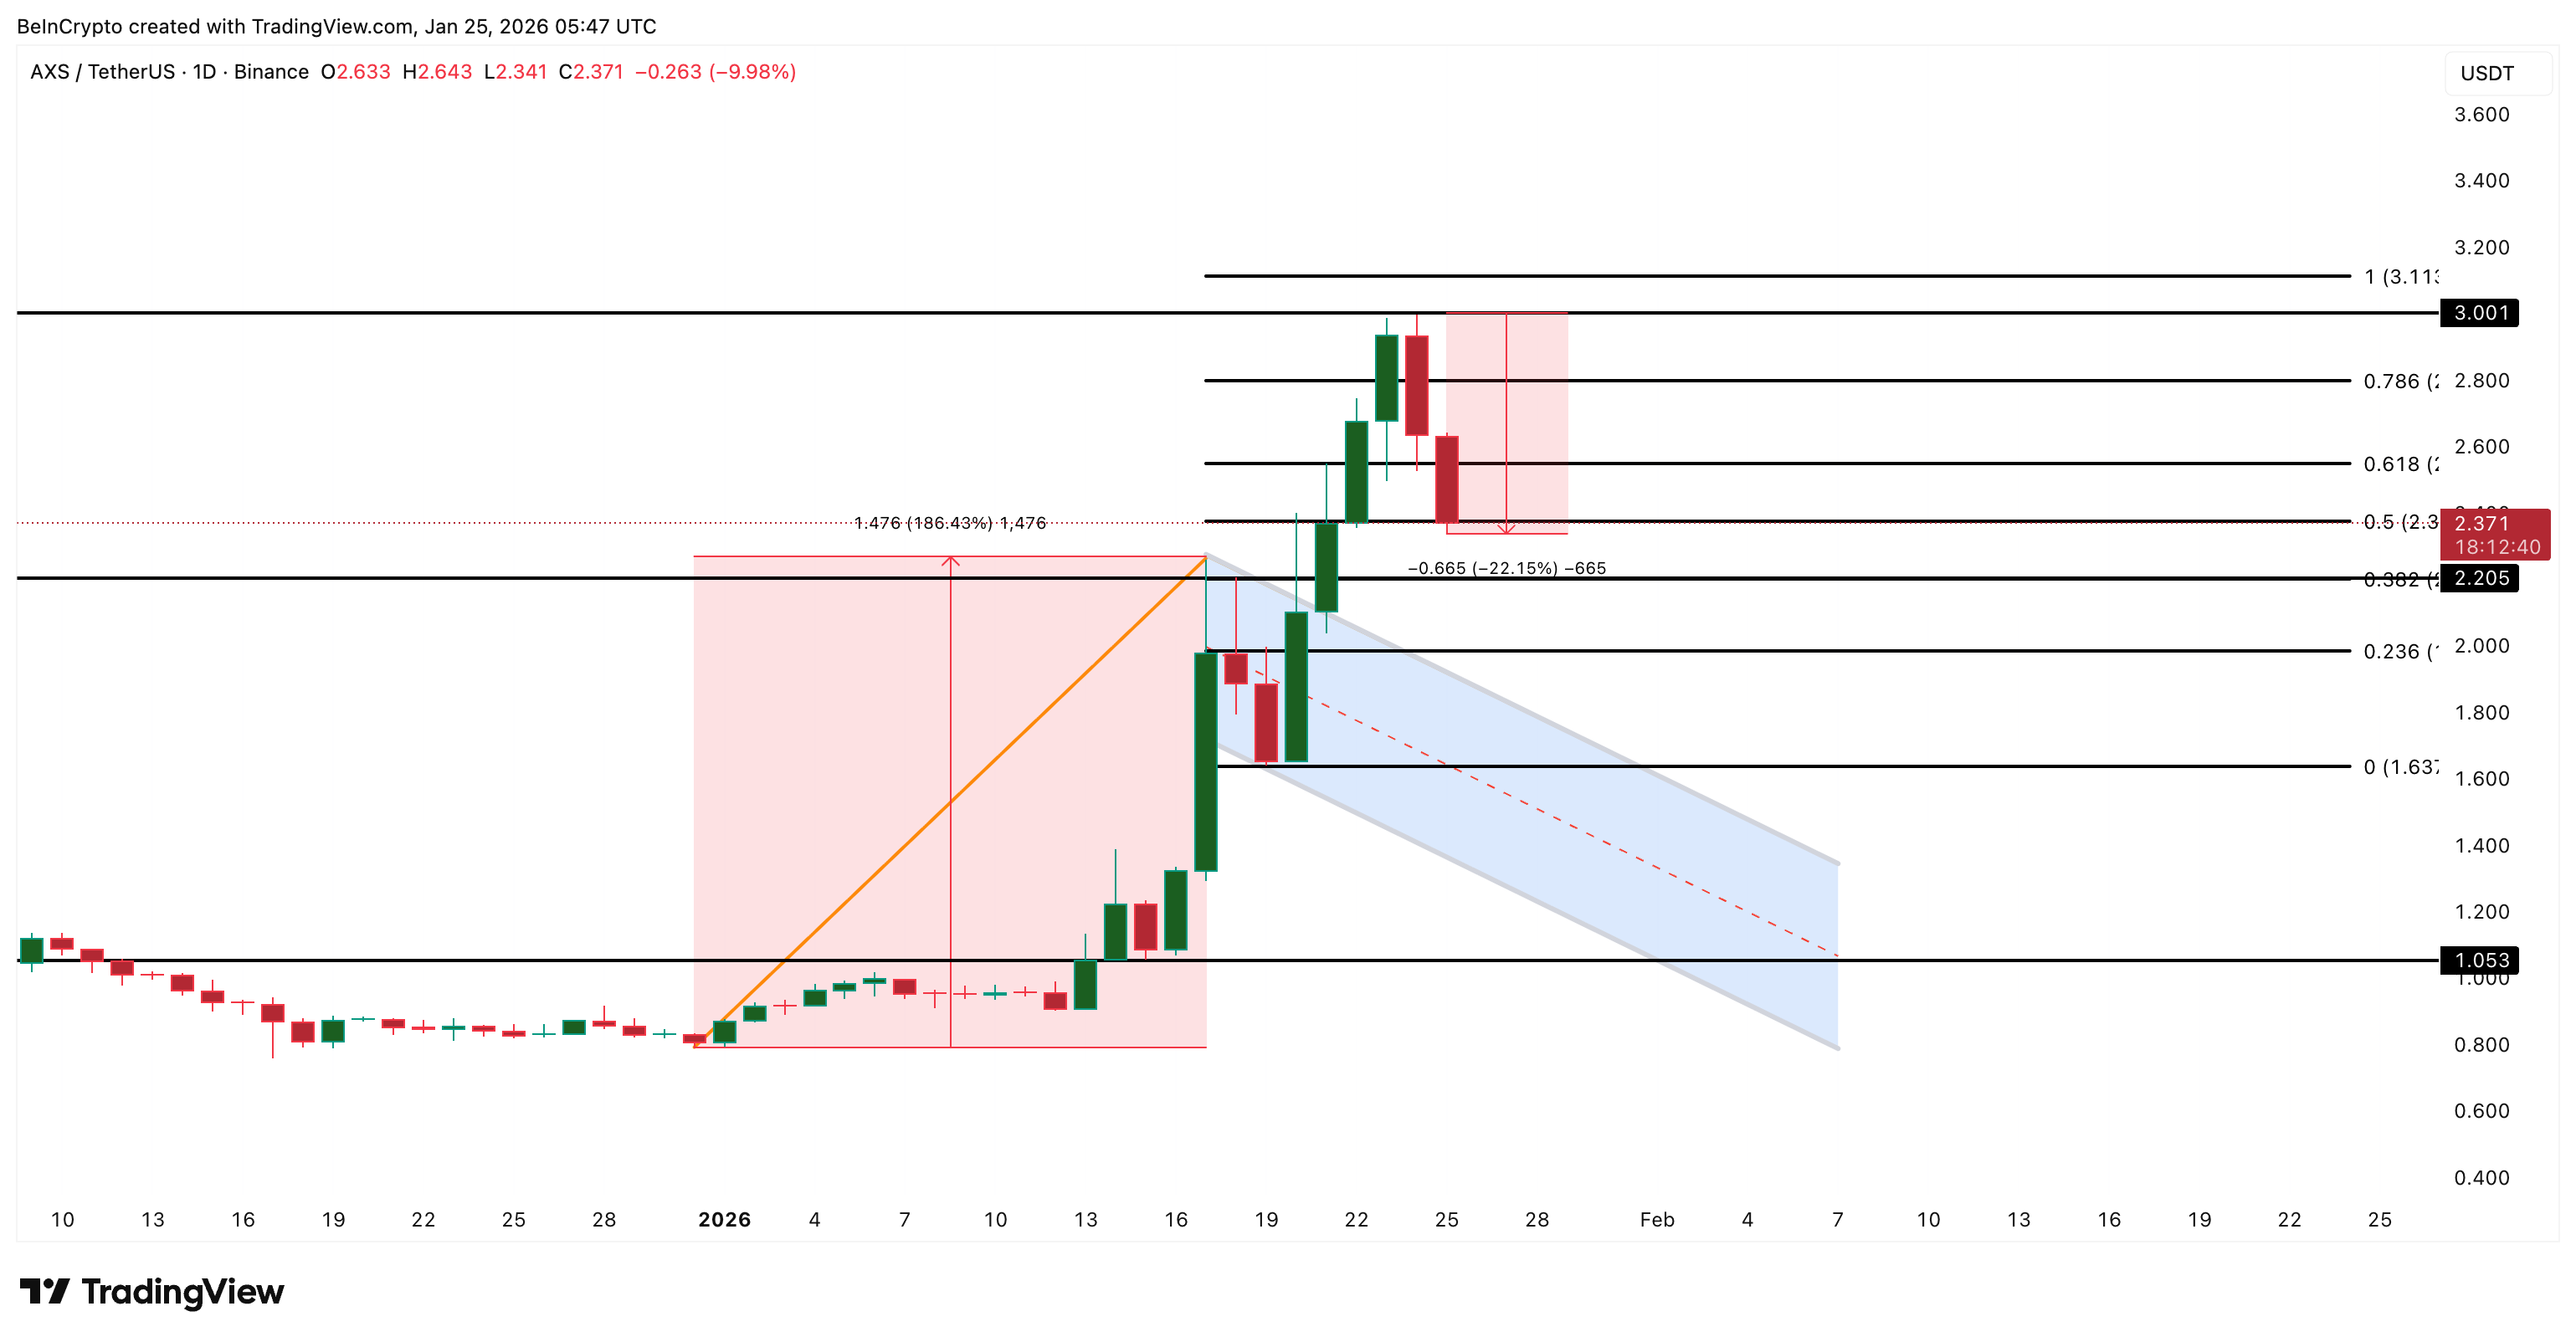 AXS Price Analysis (Current Case): TradingView
Whales are buying, but momentum is fading. Buyers remain in control, but they are no longer aggressive.
If Axie Infinity reclaims above $2.54 and momentum rebuilds, the rally can extend. If not, the market may need a deeper correction before the next leg higher.
Recommended Articles


