


Sentient (SENT) Up 140% Since TGE — Charts Show a Scalper’s Market As Price Eyes Direction
SENT launched on January 22 and immediately grabbed attention. Since the post-launch candle opening point near $0.010, the SENT price is up roughly 140%, even as the broader market stayed shaky. That strength matters. But short-term charts show something critical beneath the surface.
This price move is being driven by fast trades, not steady conviction. For now, SENT looks like a momentum playground, not a clean trend.
15-Minute Chart Shows Momentum Bursts, Not Follow-Through
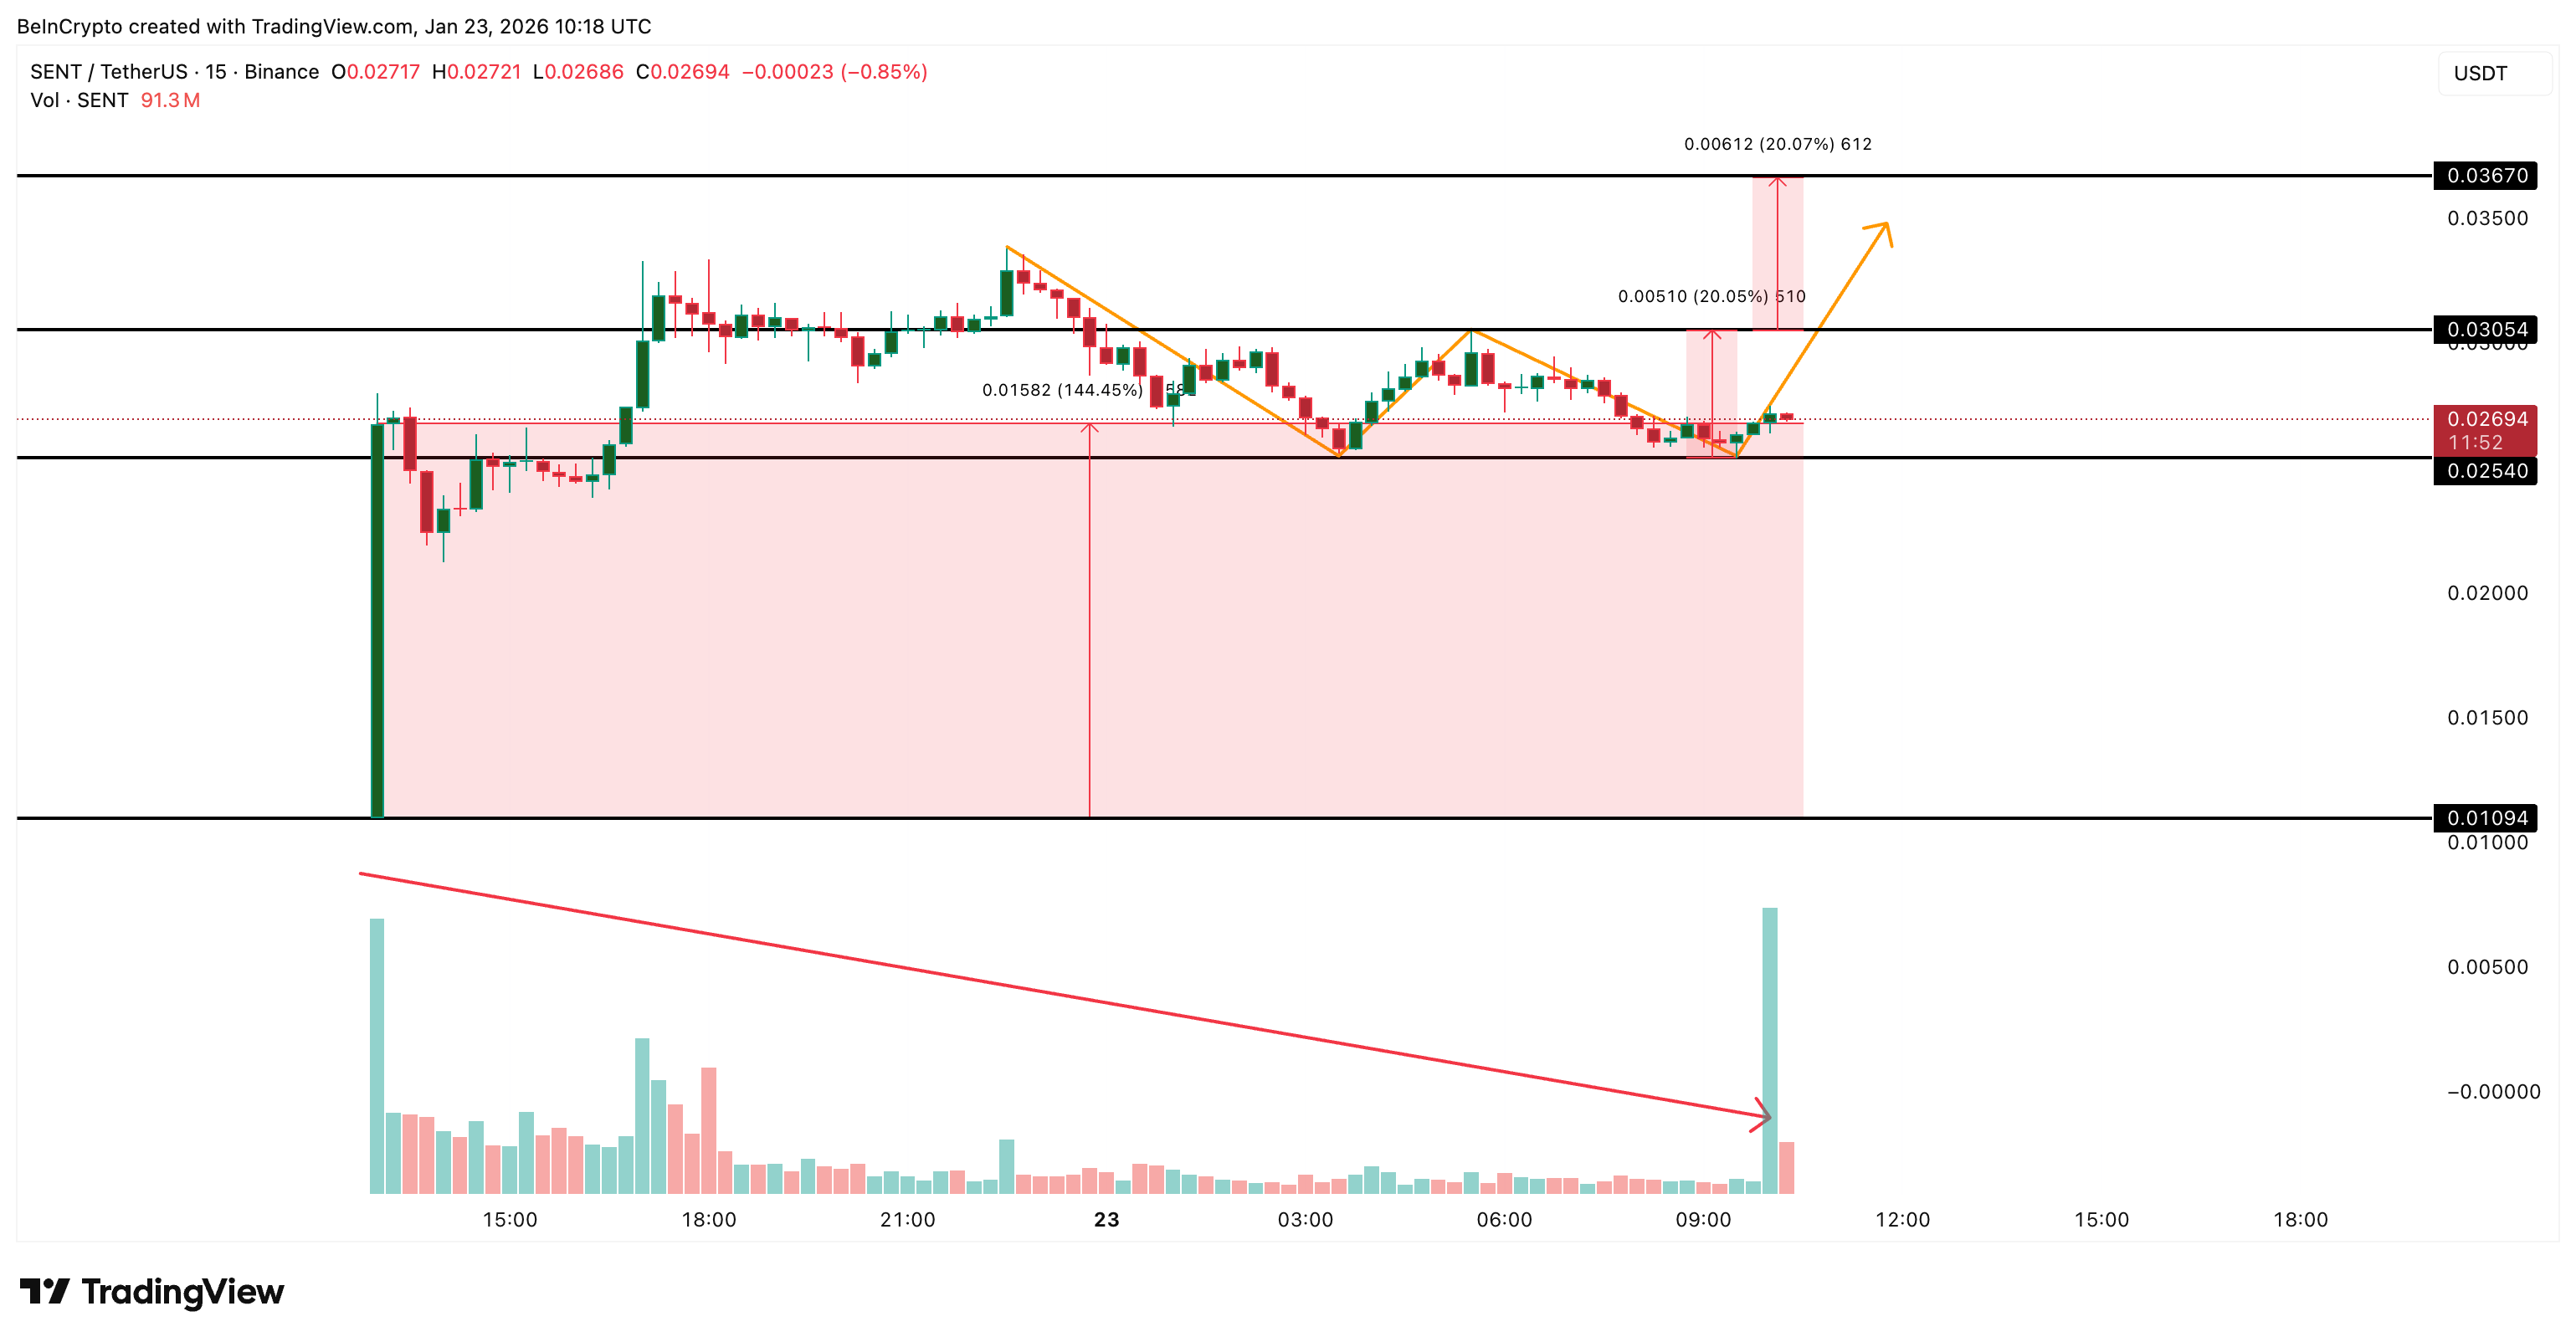
On the 15-minute timeframe, SENT formed a clear double-bottom structure after launch. The neckline sits near $0.030, which is why traders are watching that level closely. A break above it would normally suggest continuation.
The problem is volume behavior. After the initial post-TGE surge, Sentient volume steadily faded. The only exception was one large green volume pillar, followed almost immediately by a smaller but still meaningful red pillar. That sequence is key.
Want more token insights like this? Sign up for Editor Harsh Notariya’s Daily Crypto Newsletter here.
The green candle shows aggressive buyers stepping in, likely chasing a breakout or a quick price surge. The red candle that followed shows fast profit-taking. This is classic short-term behavior, likely by smart money or scalpers. Buyers push price, sellers respond quickly, and the move stalls.
 15-Minute Sentient Chart: TradingView
In simple terms, momentum exists, but it is being sold into almost immediately. That is why the price keeps moving sideways instead of expanding higher. This is ideal for scalpers, but risky for traders expecting smooth continuation.
30-Minute And 1-Hour Data Point To Rotation, Not Conviction
When we zoom out slightly, the story becomes clearer.
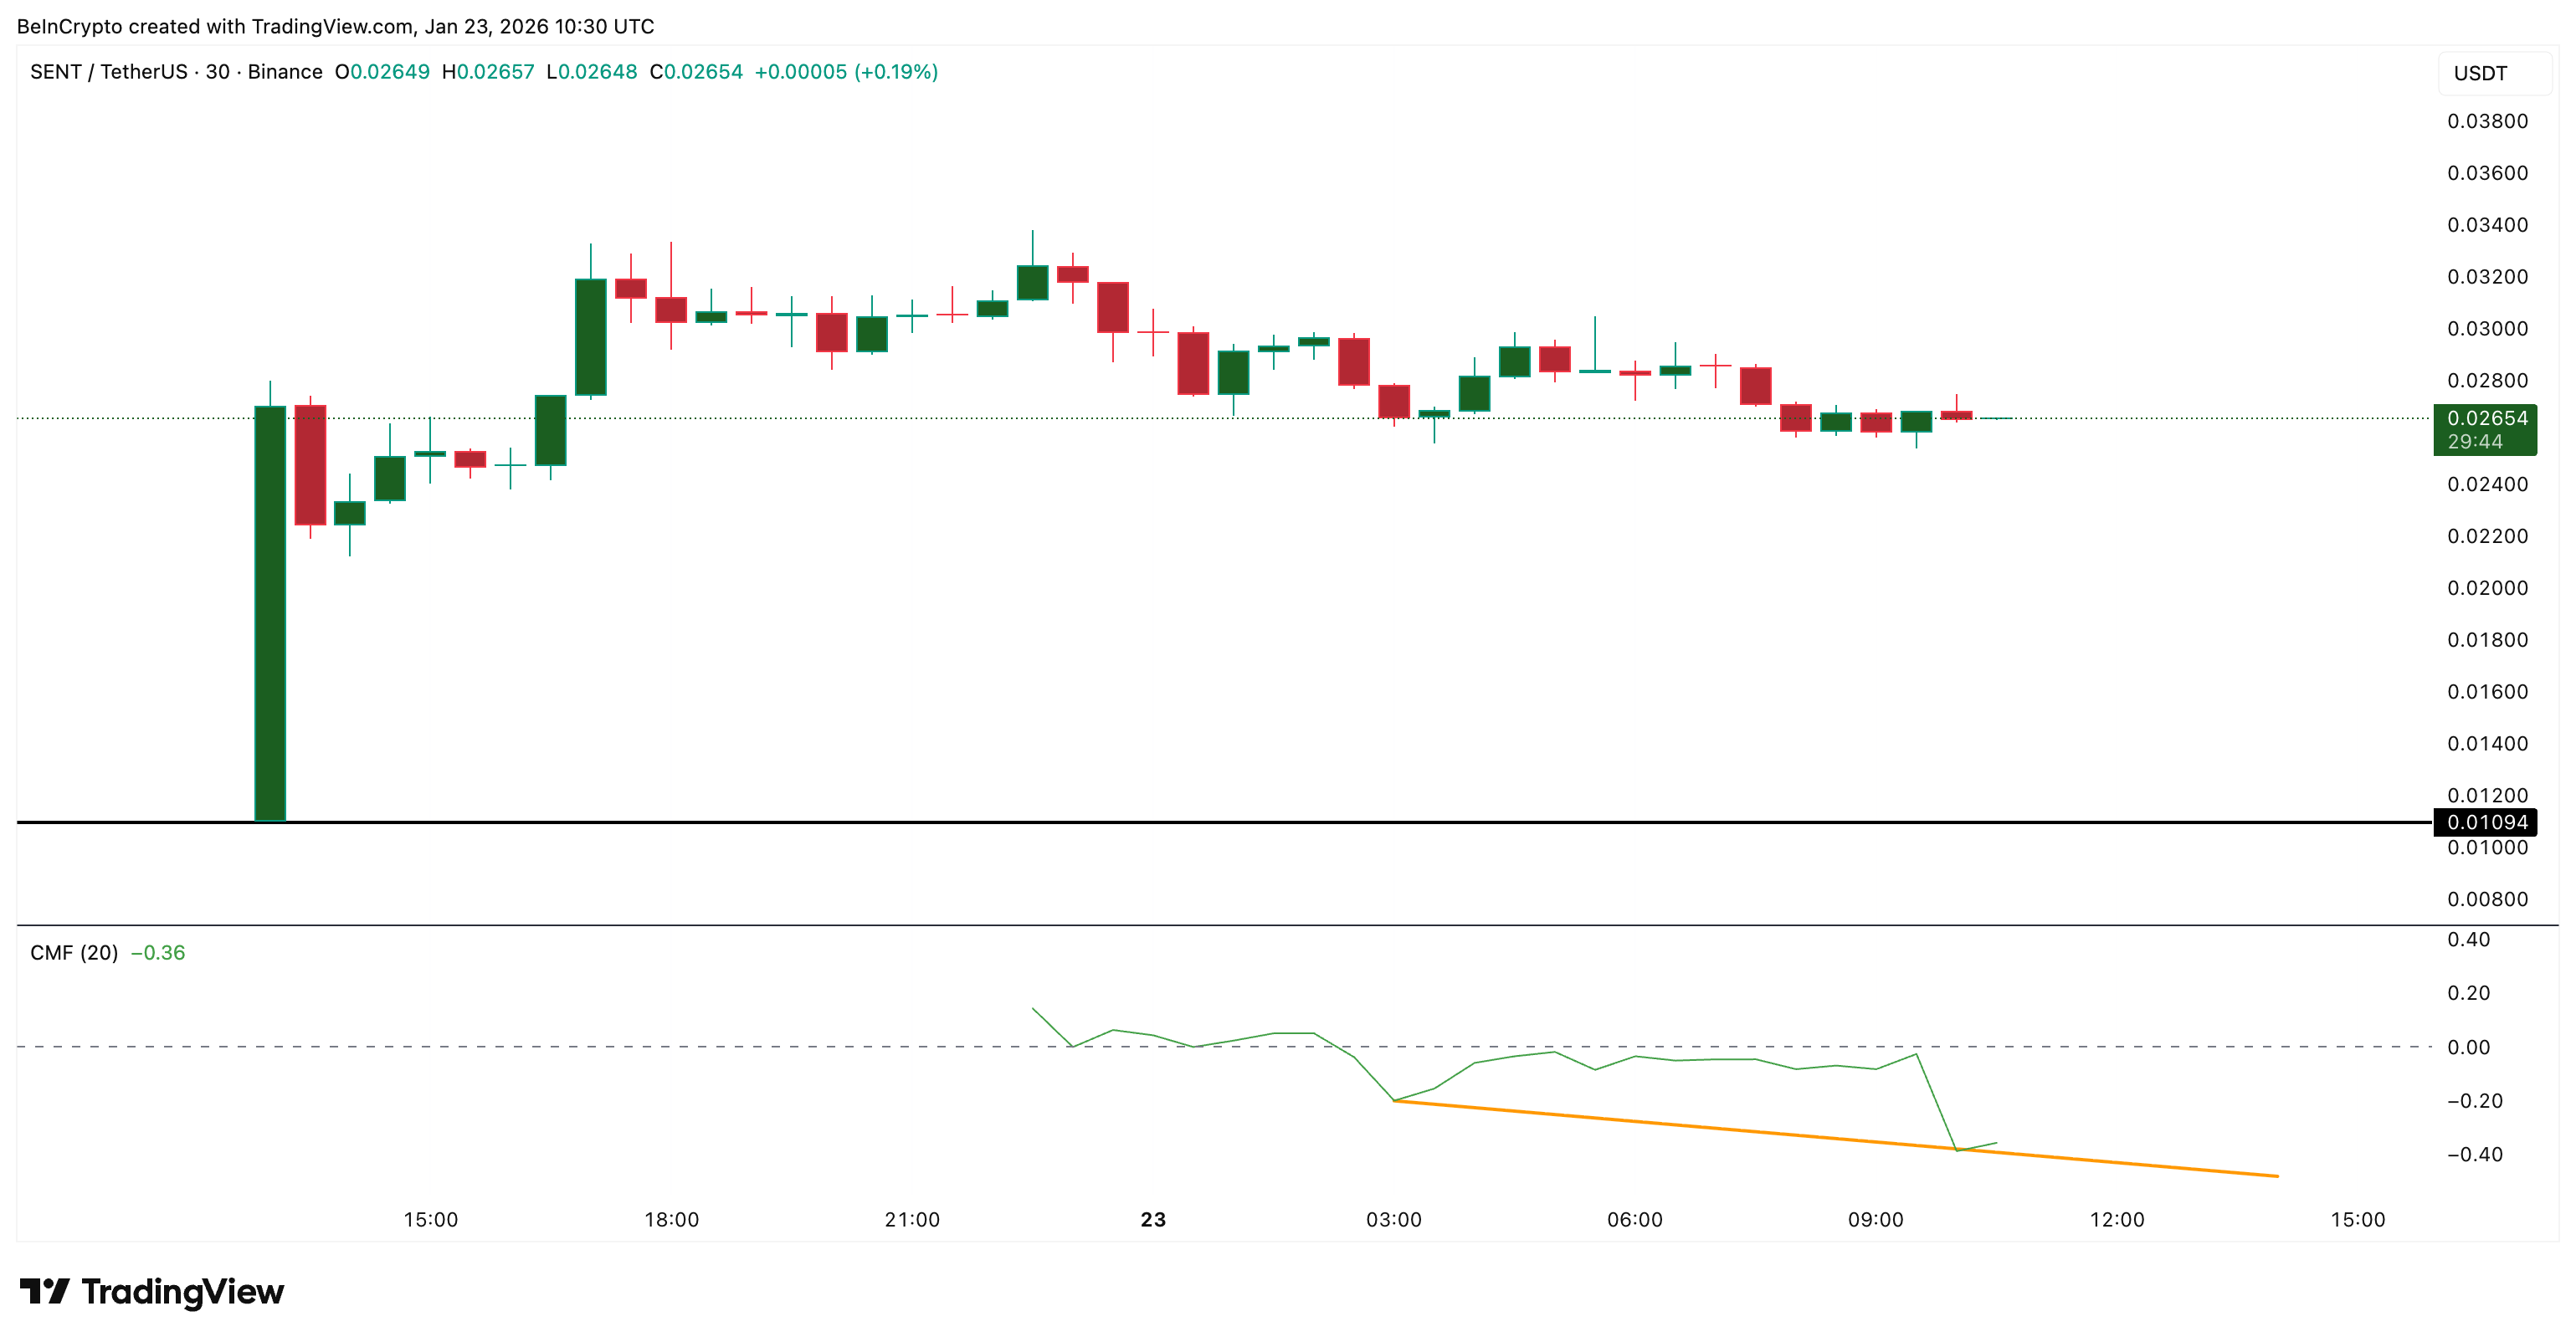
On the 30-minute chart, the Chaikin Money Flow, or CMF, the big money tracker, has dropped below the zero line, while the price moves mostly sideways. Below zero means more capital is leaving than entering. Even though the price is holding, larger money or big SENT wallets are not committing yet.
For now, CMF needs to hold above the descending trendline to avoid a breakdown and massive capital outflow.
 Big Money Not Convinced Yet: TradingView
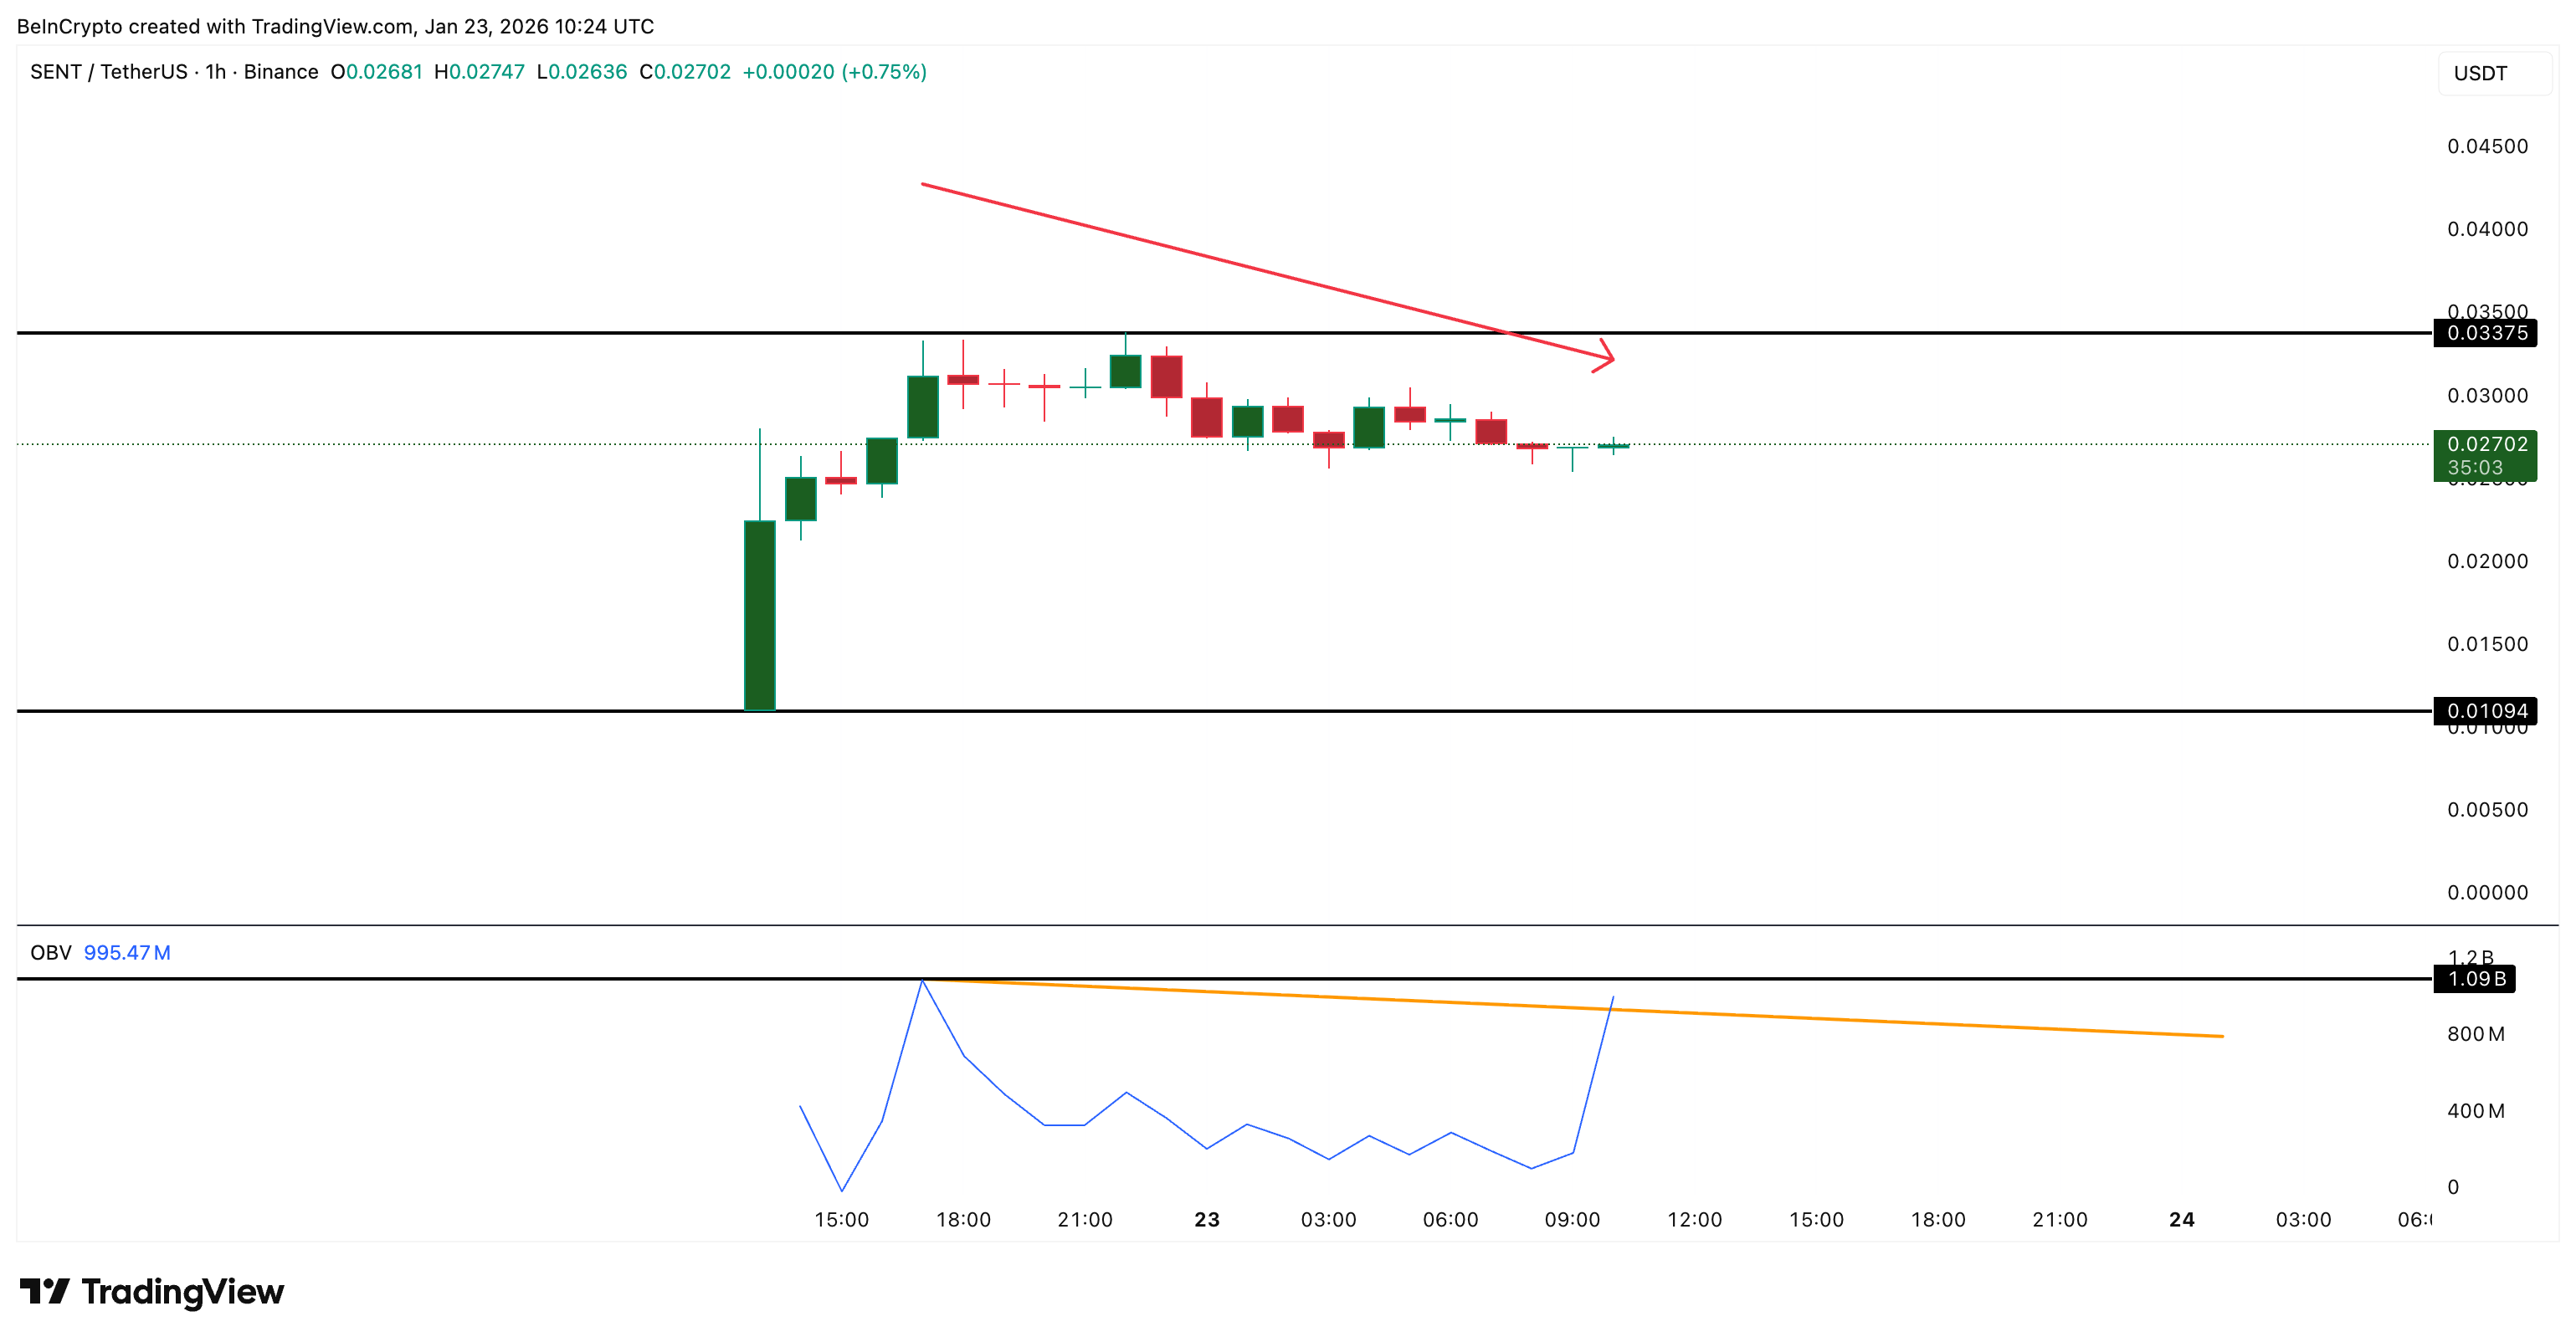
At the same time, the 1-hour On-Balance Volume, or OBV, is trying to break above a descending trendline. OBV tracks whether volume confirms price. Right now, OBV is rising (buyers supporting with the flattish price), but it still needs to push above roughly 1.09 billion to confirm buyers are in control (make a higher high). Until that happens, the breakout remains tentative.
 Buying Pressure Remains On SENT: TradingView
When CMF weakens while OBV tries to break out, it usually means short-term buying is active, but larger capital is not committing yet. And even possibly selling the airdrop stash into strength, which explains the drop below the zero line.
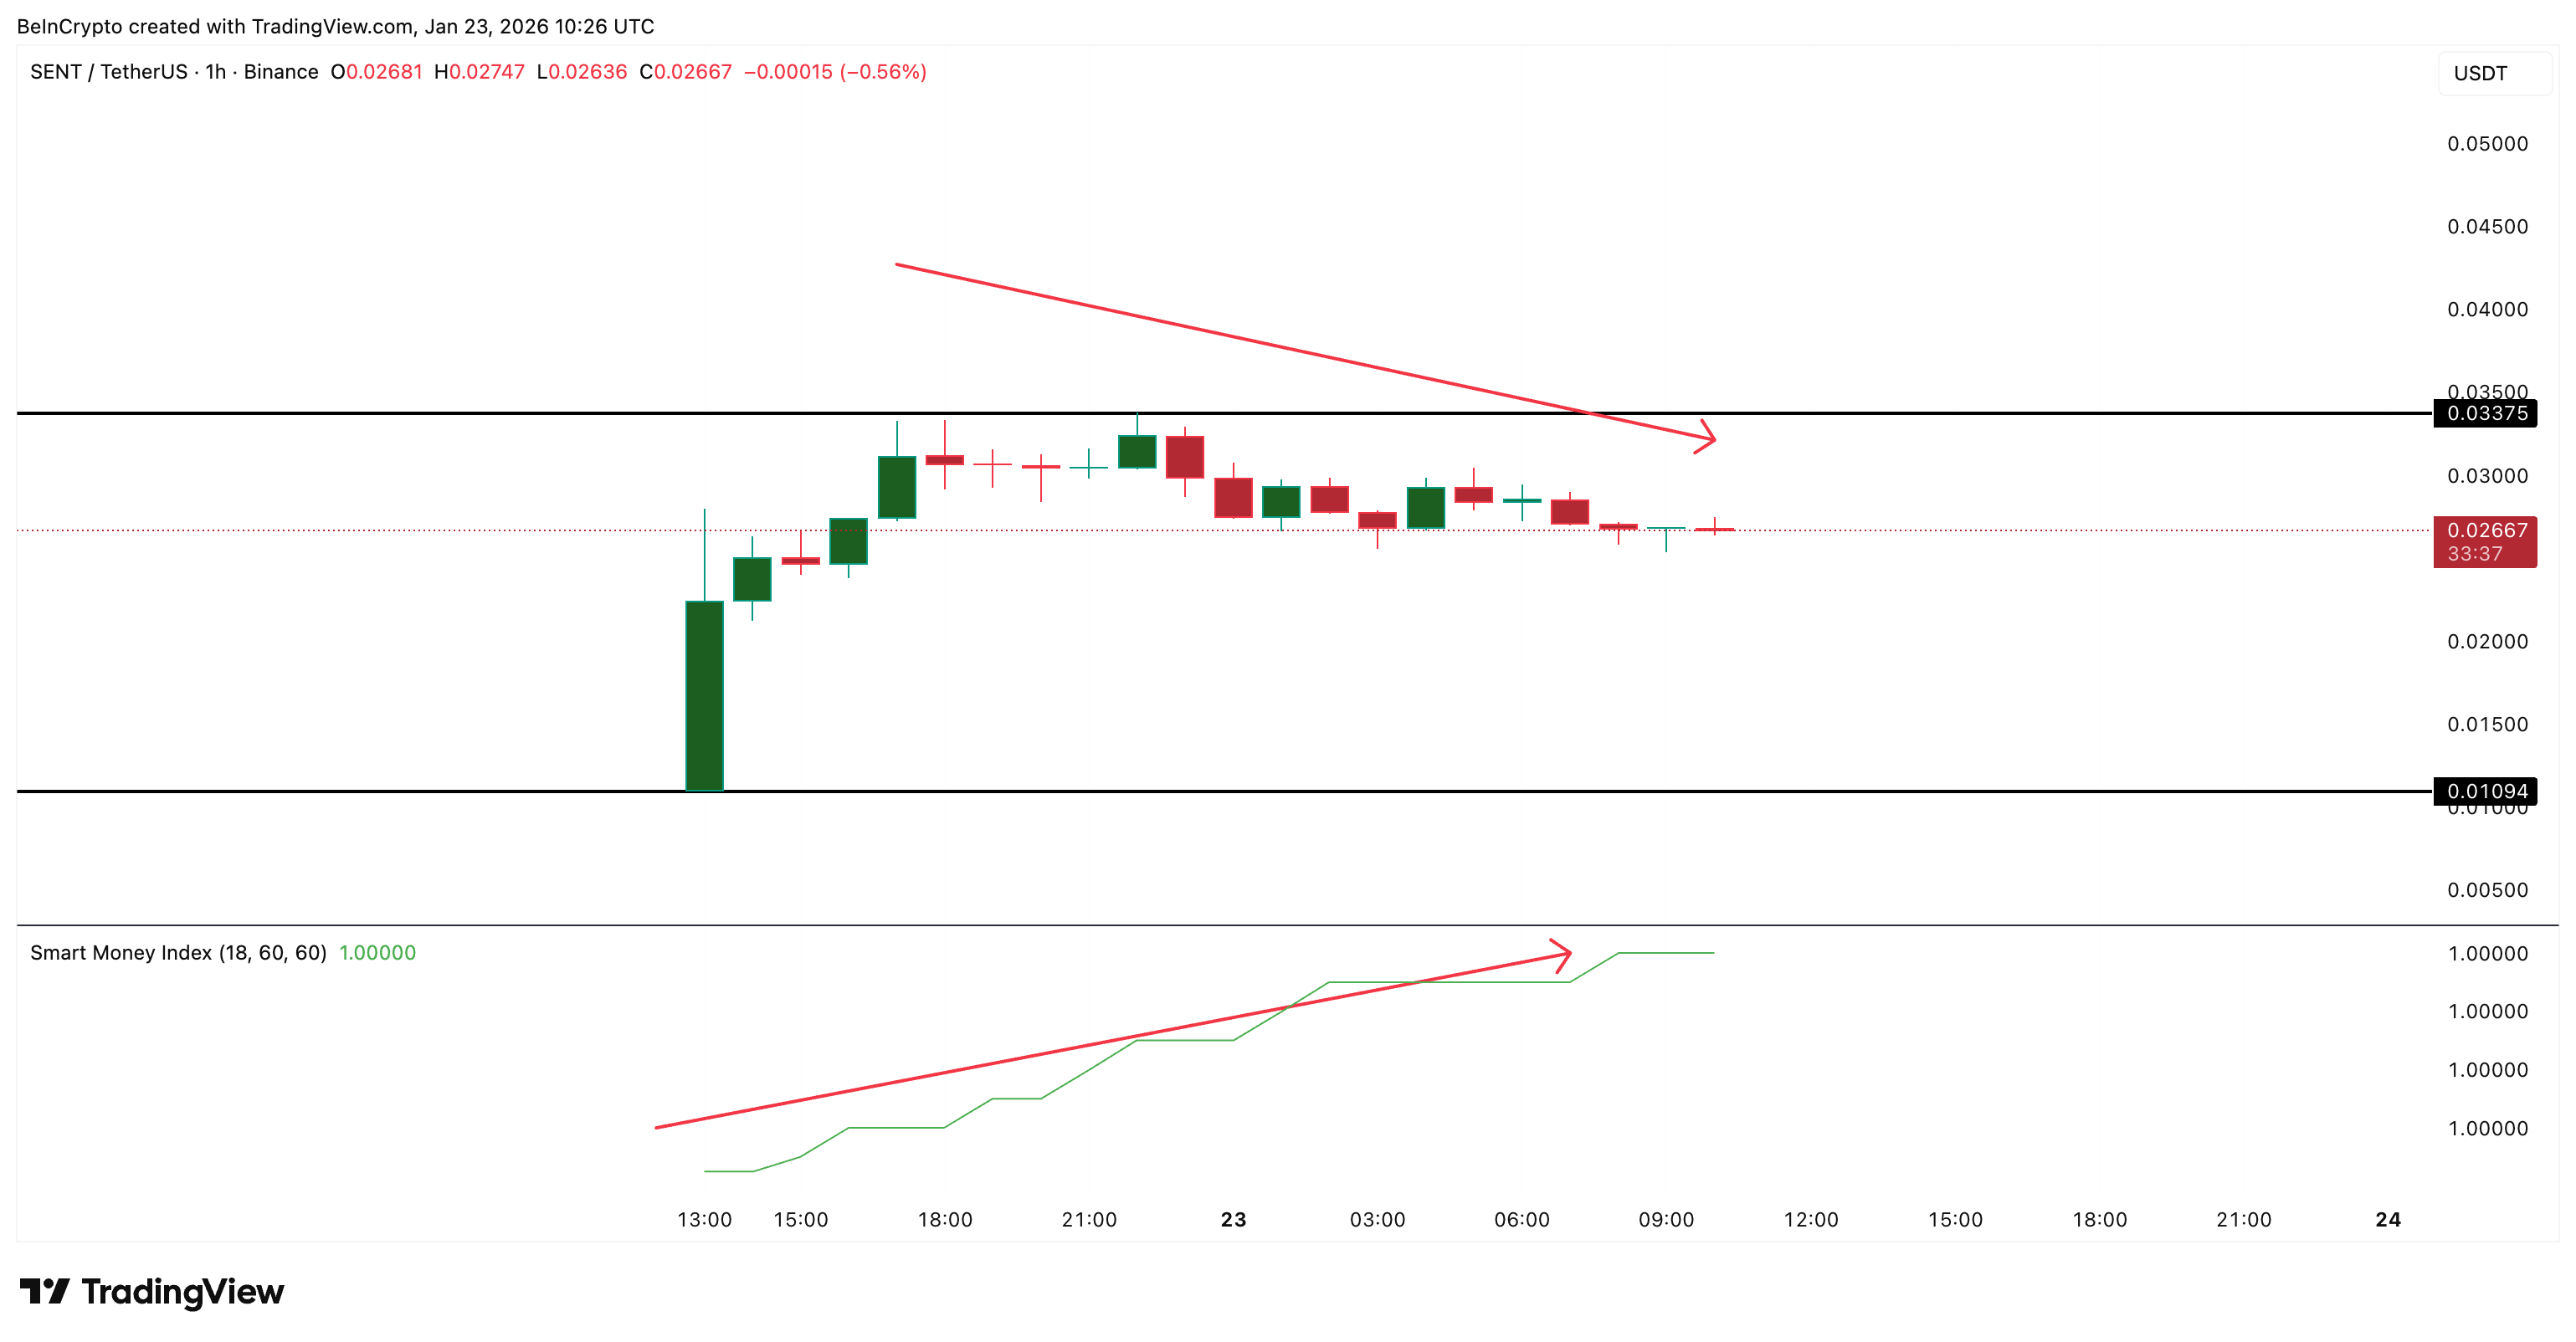
The Smart Money Index adds another layer. While price drifted lower, the smart money line kept moving up. That usually signals quick entries and exits. That also explains the surging volume pillars on the 15-minute chart.
 Smart Money Movements: TradingView
These momentum-driven theory lines up with exchange data as well. Exchange volume jumped about 384% in the past 24 hours. That level of activity points to heavy rotation as rising OBV confirms buying, and exchange inflows confirm selling intent and possible airdrop-led profit booking.
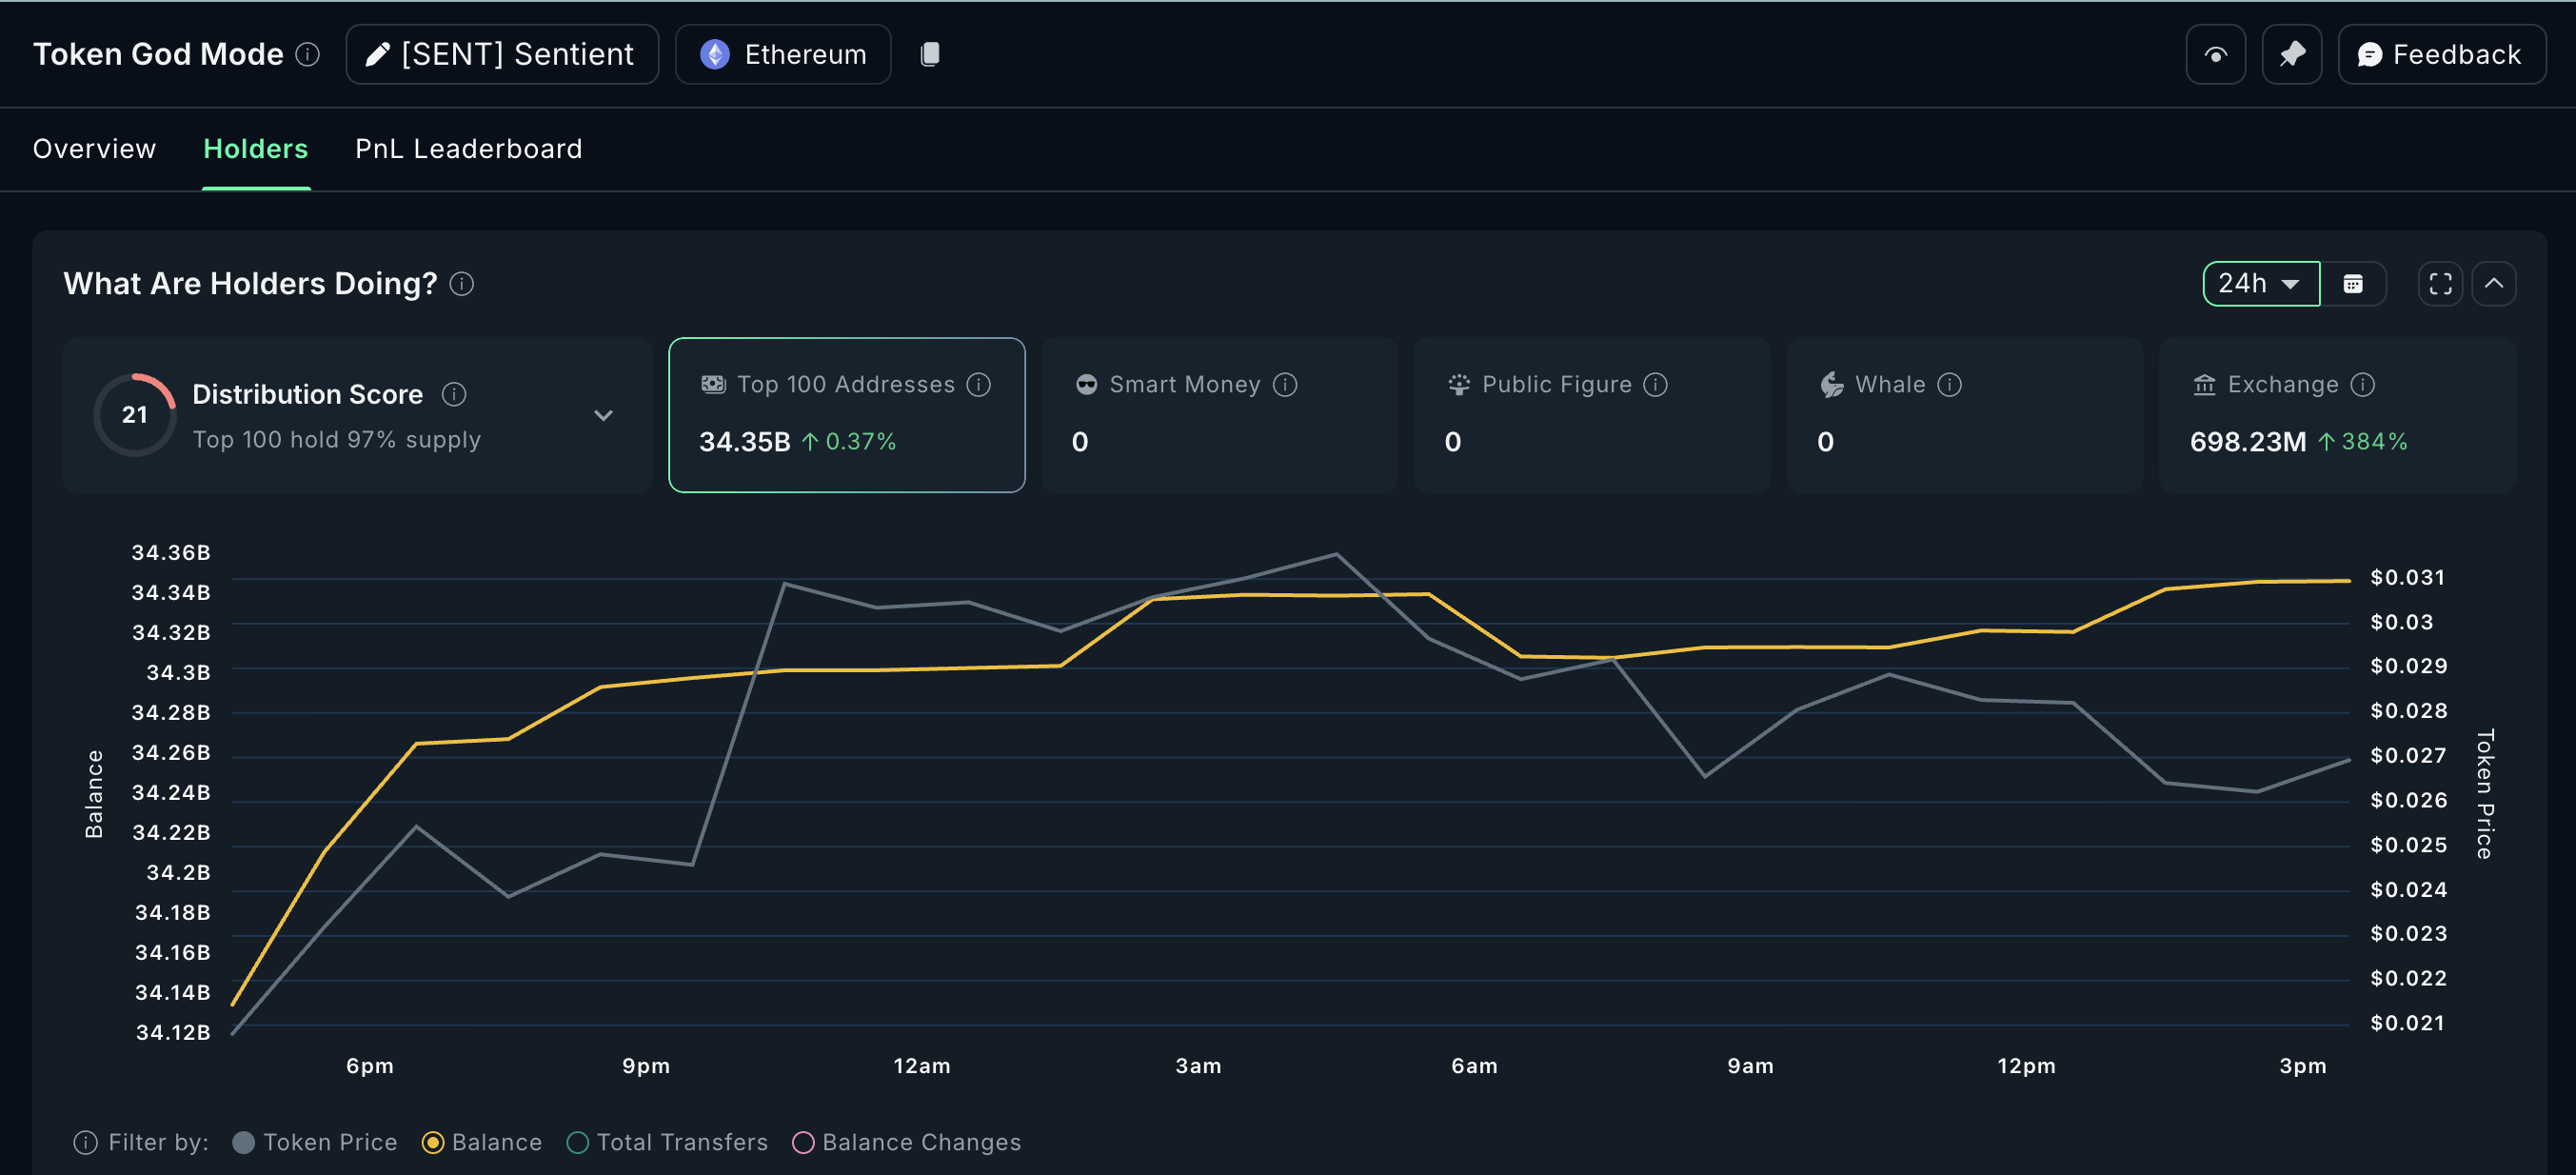 Selling Pressure Remains: Nansen
Together, these signals suggest that SENT is being actively traded, but conviction buying has not taken over yet.
2-Hour SENT Price Trend Defines The Levels That Matter Next
The higher timeframe keeps the analysis grounded.
On the 2-hour chart, SENT is still in an uptrend from the post-launch low. That trend has not broken yet, which is important. As long as it holds, upside attempts remain valid.
The first key support sits near $0.025. This level has held multiple tests. If price loses $0.025 with volume, the next downside target comes in near $0.021. If selling pressure accelerates and CMF continues to fall, a deeper move toward $0.010 cannot be ruled out.
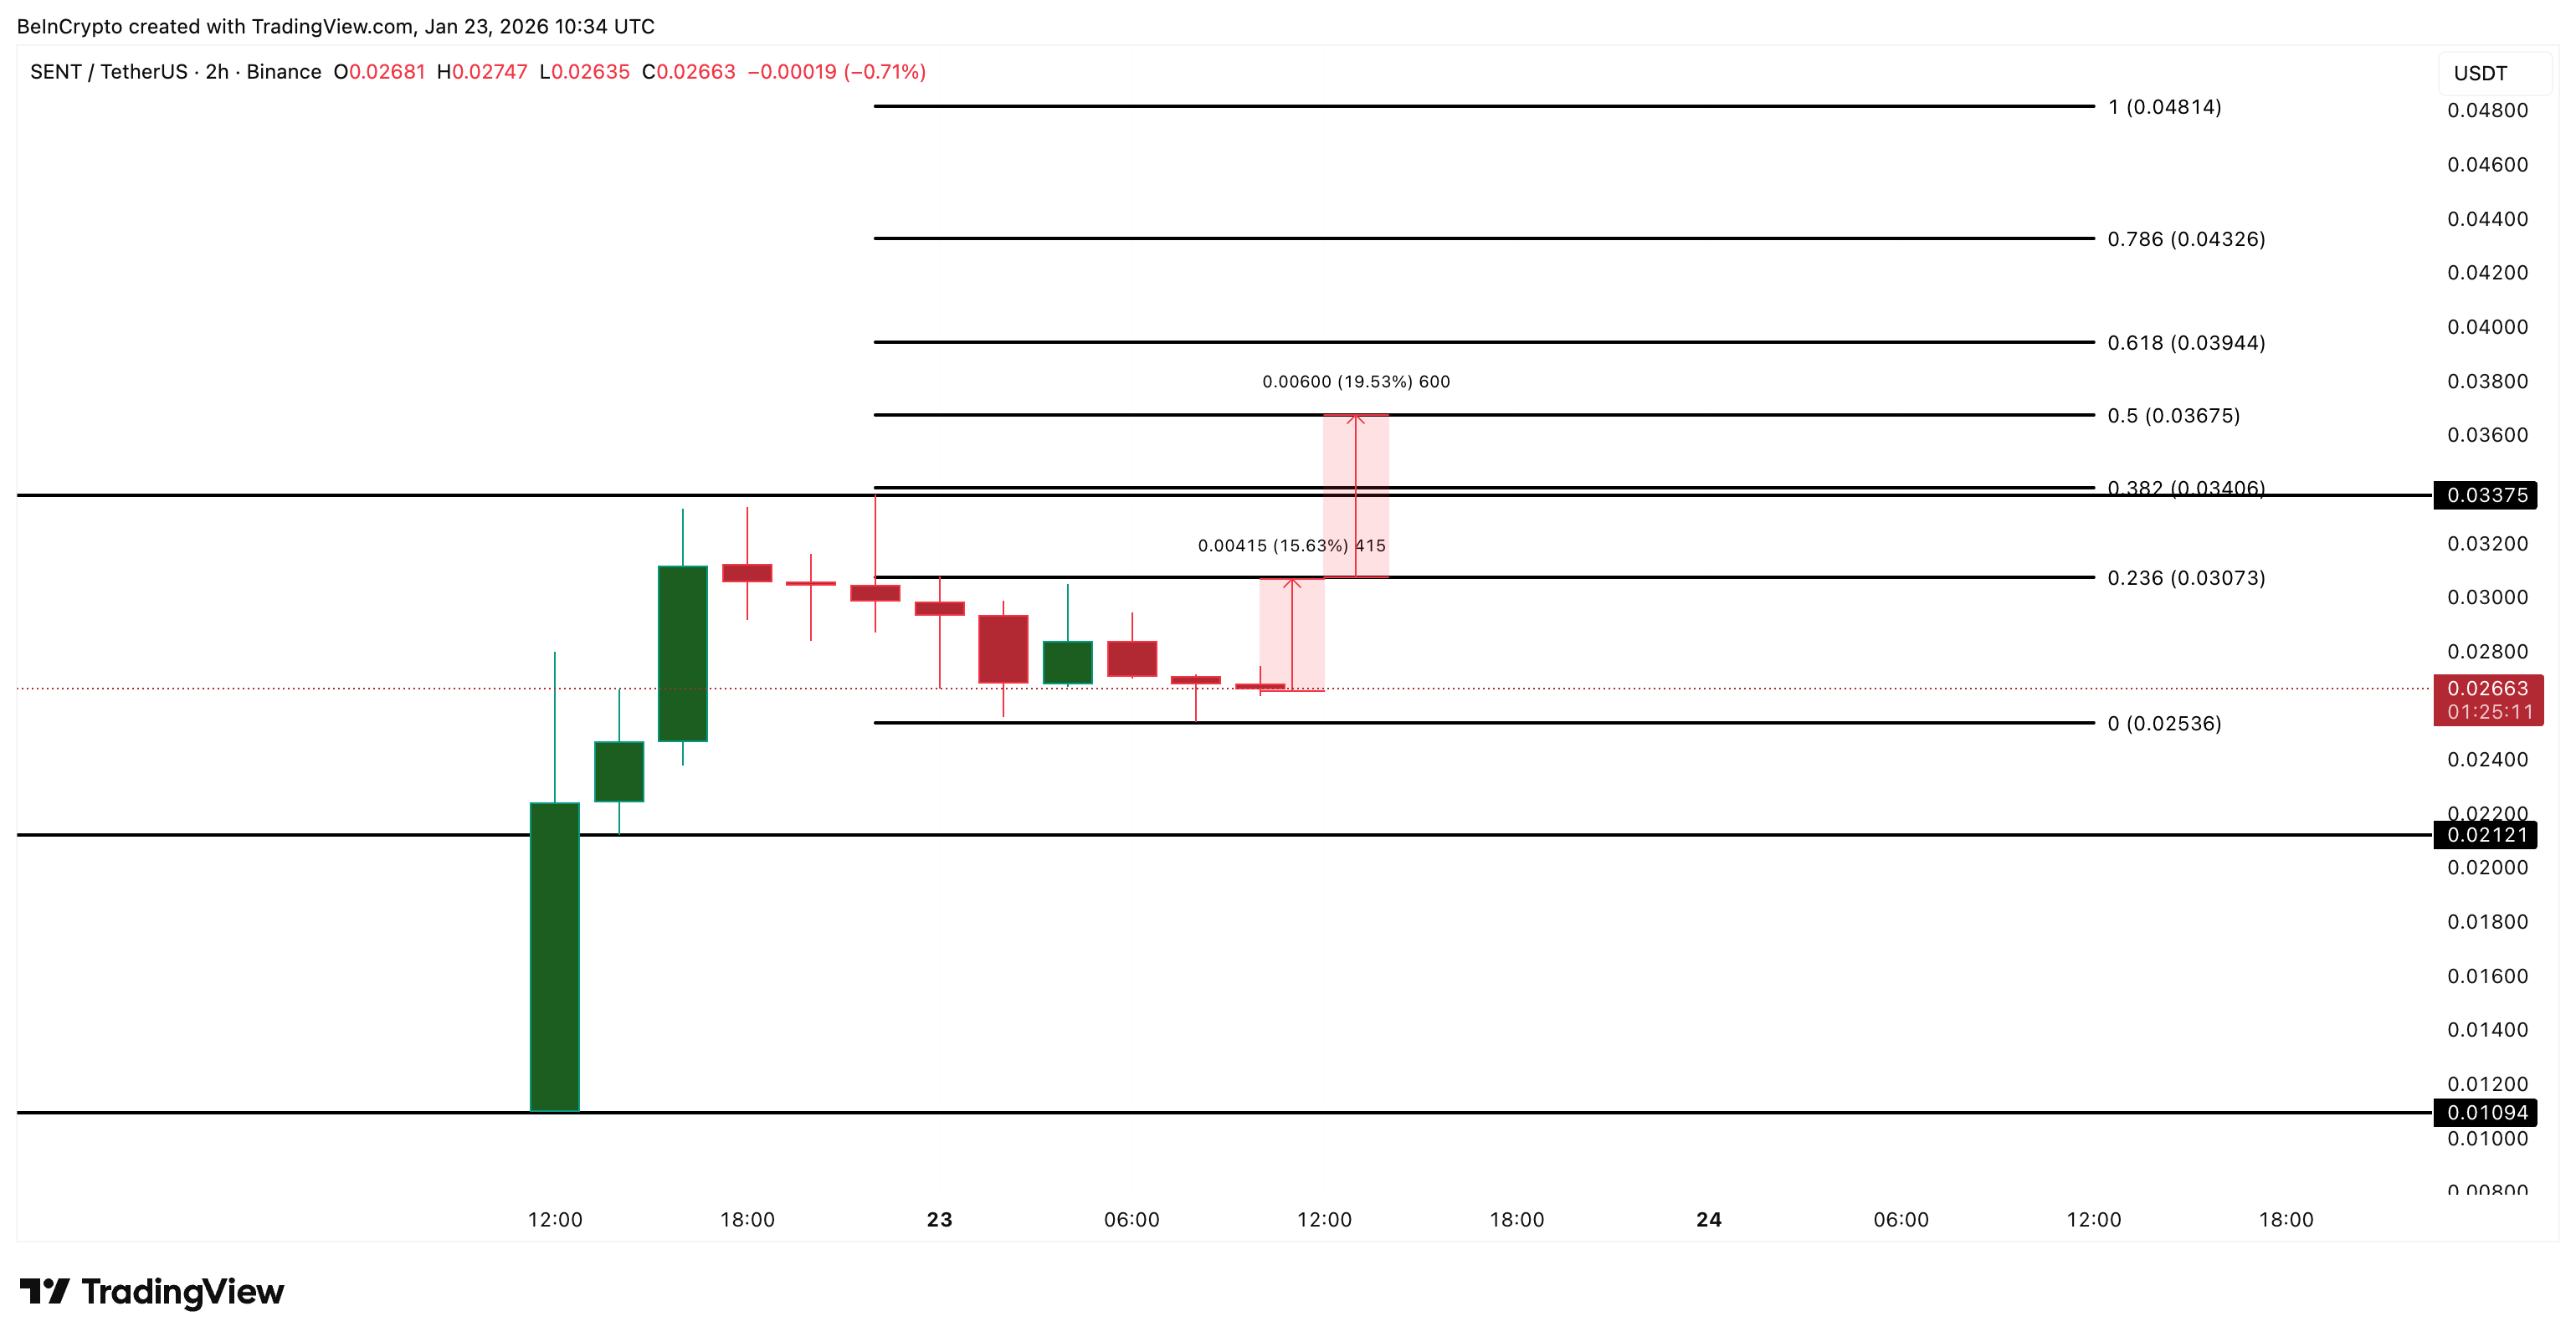 SENT Price Analysis: TradingView
On the upside, everything hinges on $0.030. SENT needs both a 15-minute and a 2-hour close above that level. Just wicking above it is not enough. The move must come with expanding volume.
If that confirmation appears, the measured move from the 15-minute structure points toward $0.036 (also present on the 2-hour chart), roughly a 20% upside from the breakout zone. Beyond that, higher resistance levels sit near $0.043 and $0.048.
Until then, the market remains range-bound and fast.
Bottom line: SENT’s post-TGE strength remains, but for now, price is controlled by speed, not conviction. The next direction will not be decided by hype or patterns alone. Volume will decide whether SENT breaks higher or stays a scalper’s game.
Recommended Articles


