


Monero’s 44% Breakdown Risk Aligns With Its Historically Red February — Possible Repeat?
Monero has been one of the strongest movers this month. XMR is still up roughly 57% over the past three months and around 17% in January so far. But that strength has started to unwind fast. Since topping near $799, the Monero price has already corrected about 36% in the past seven days.
This pullback is not happening in isolation. A bearish chart structure is forming at the same time Monero nears a month that has historically been hostile to price strength. Together, they raise a serious question: is this just a pause, or is Monero setting up for a deeper February sell-off?
Bearish Structure Emerges as February History Turns Against Price
Monero is currently trading inside a rising wedge. A rising wedge is a bearish pattern where the price continues making higher highs, but the trend narrows, signaling exhaustion rather than strength. When this pattern breaks, it often resolves sharply lower.
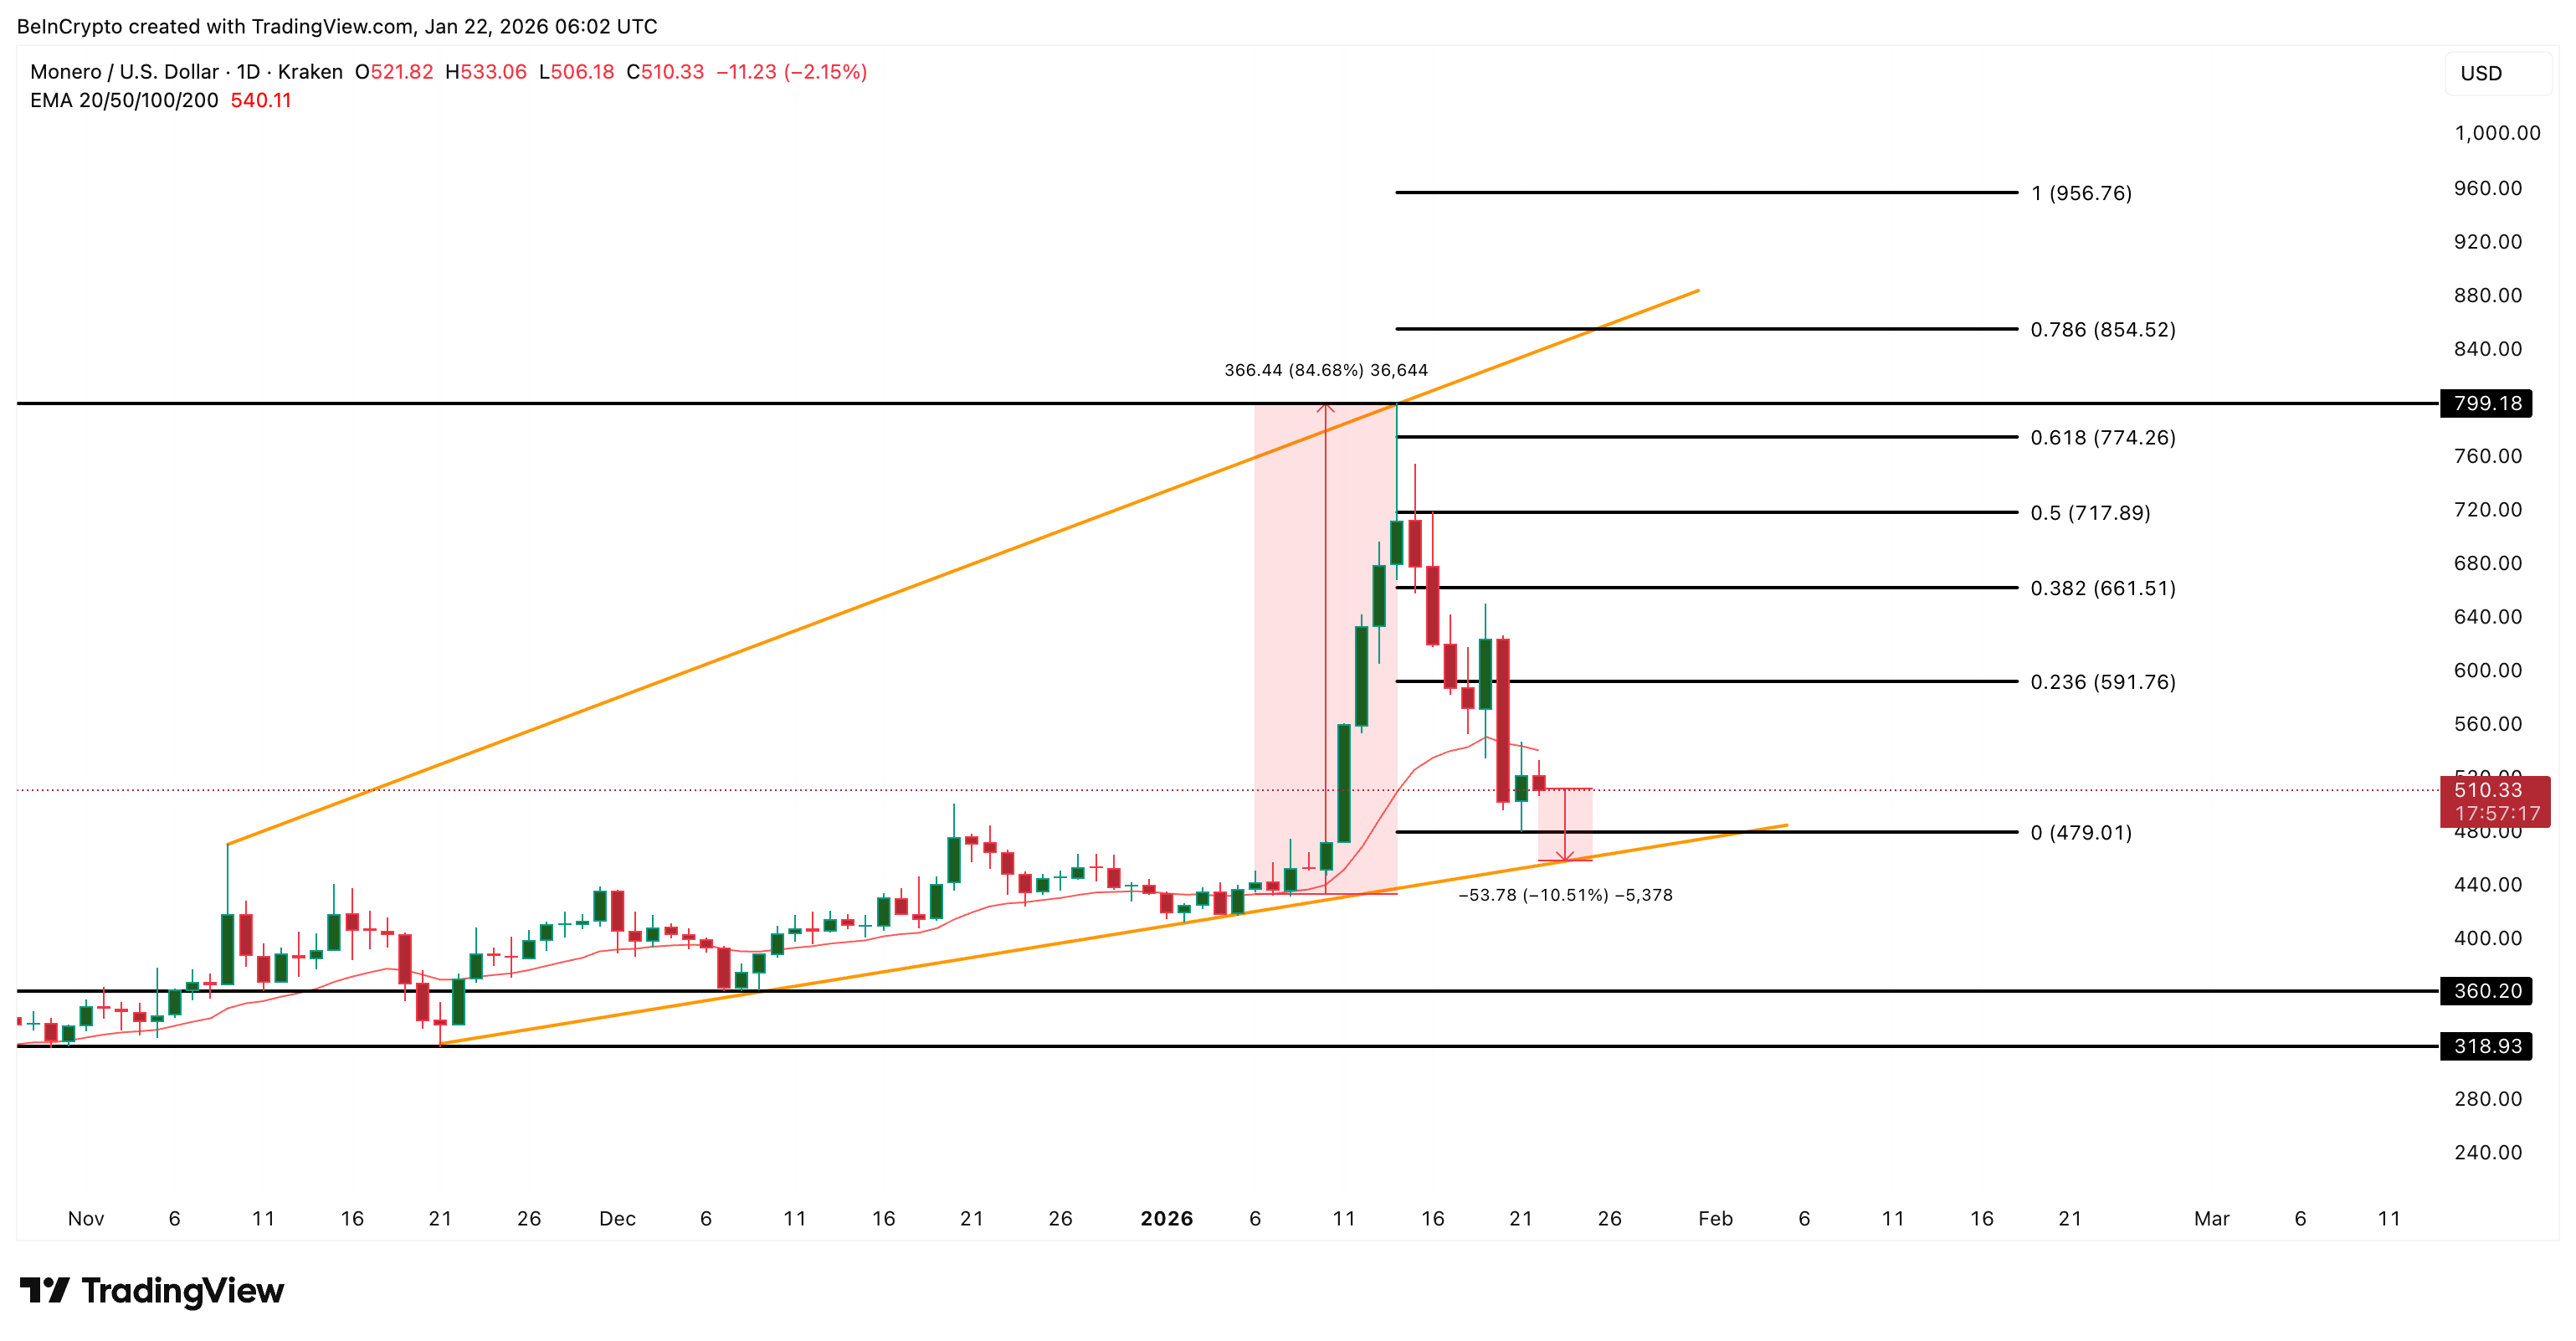
The measured move from this structure implies a 44% downside risk if the lower boundary fails.
Want more token insights like this? Sign up for Editor Harsh Notariya’s Daily Crypto Newsletter here.
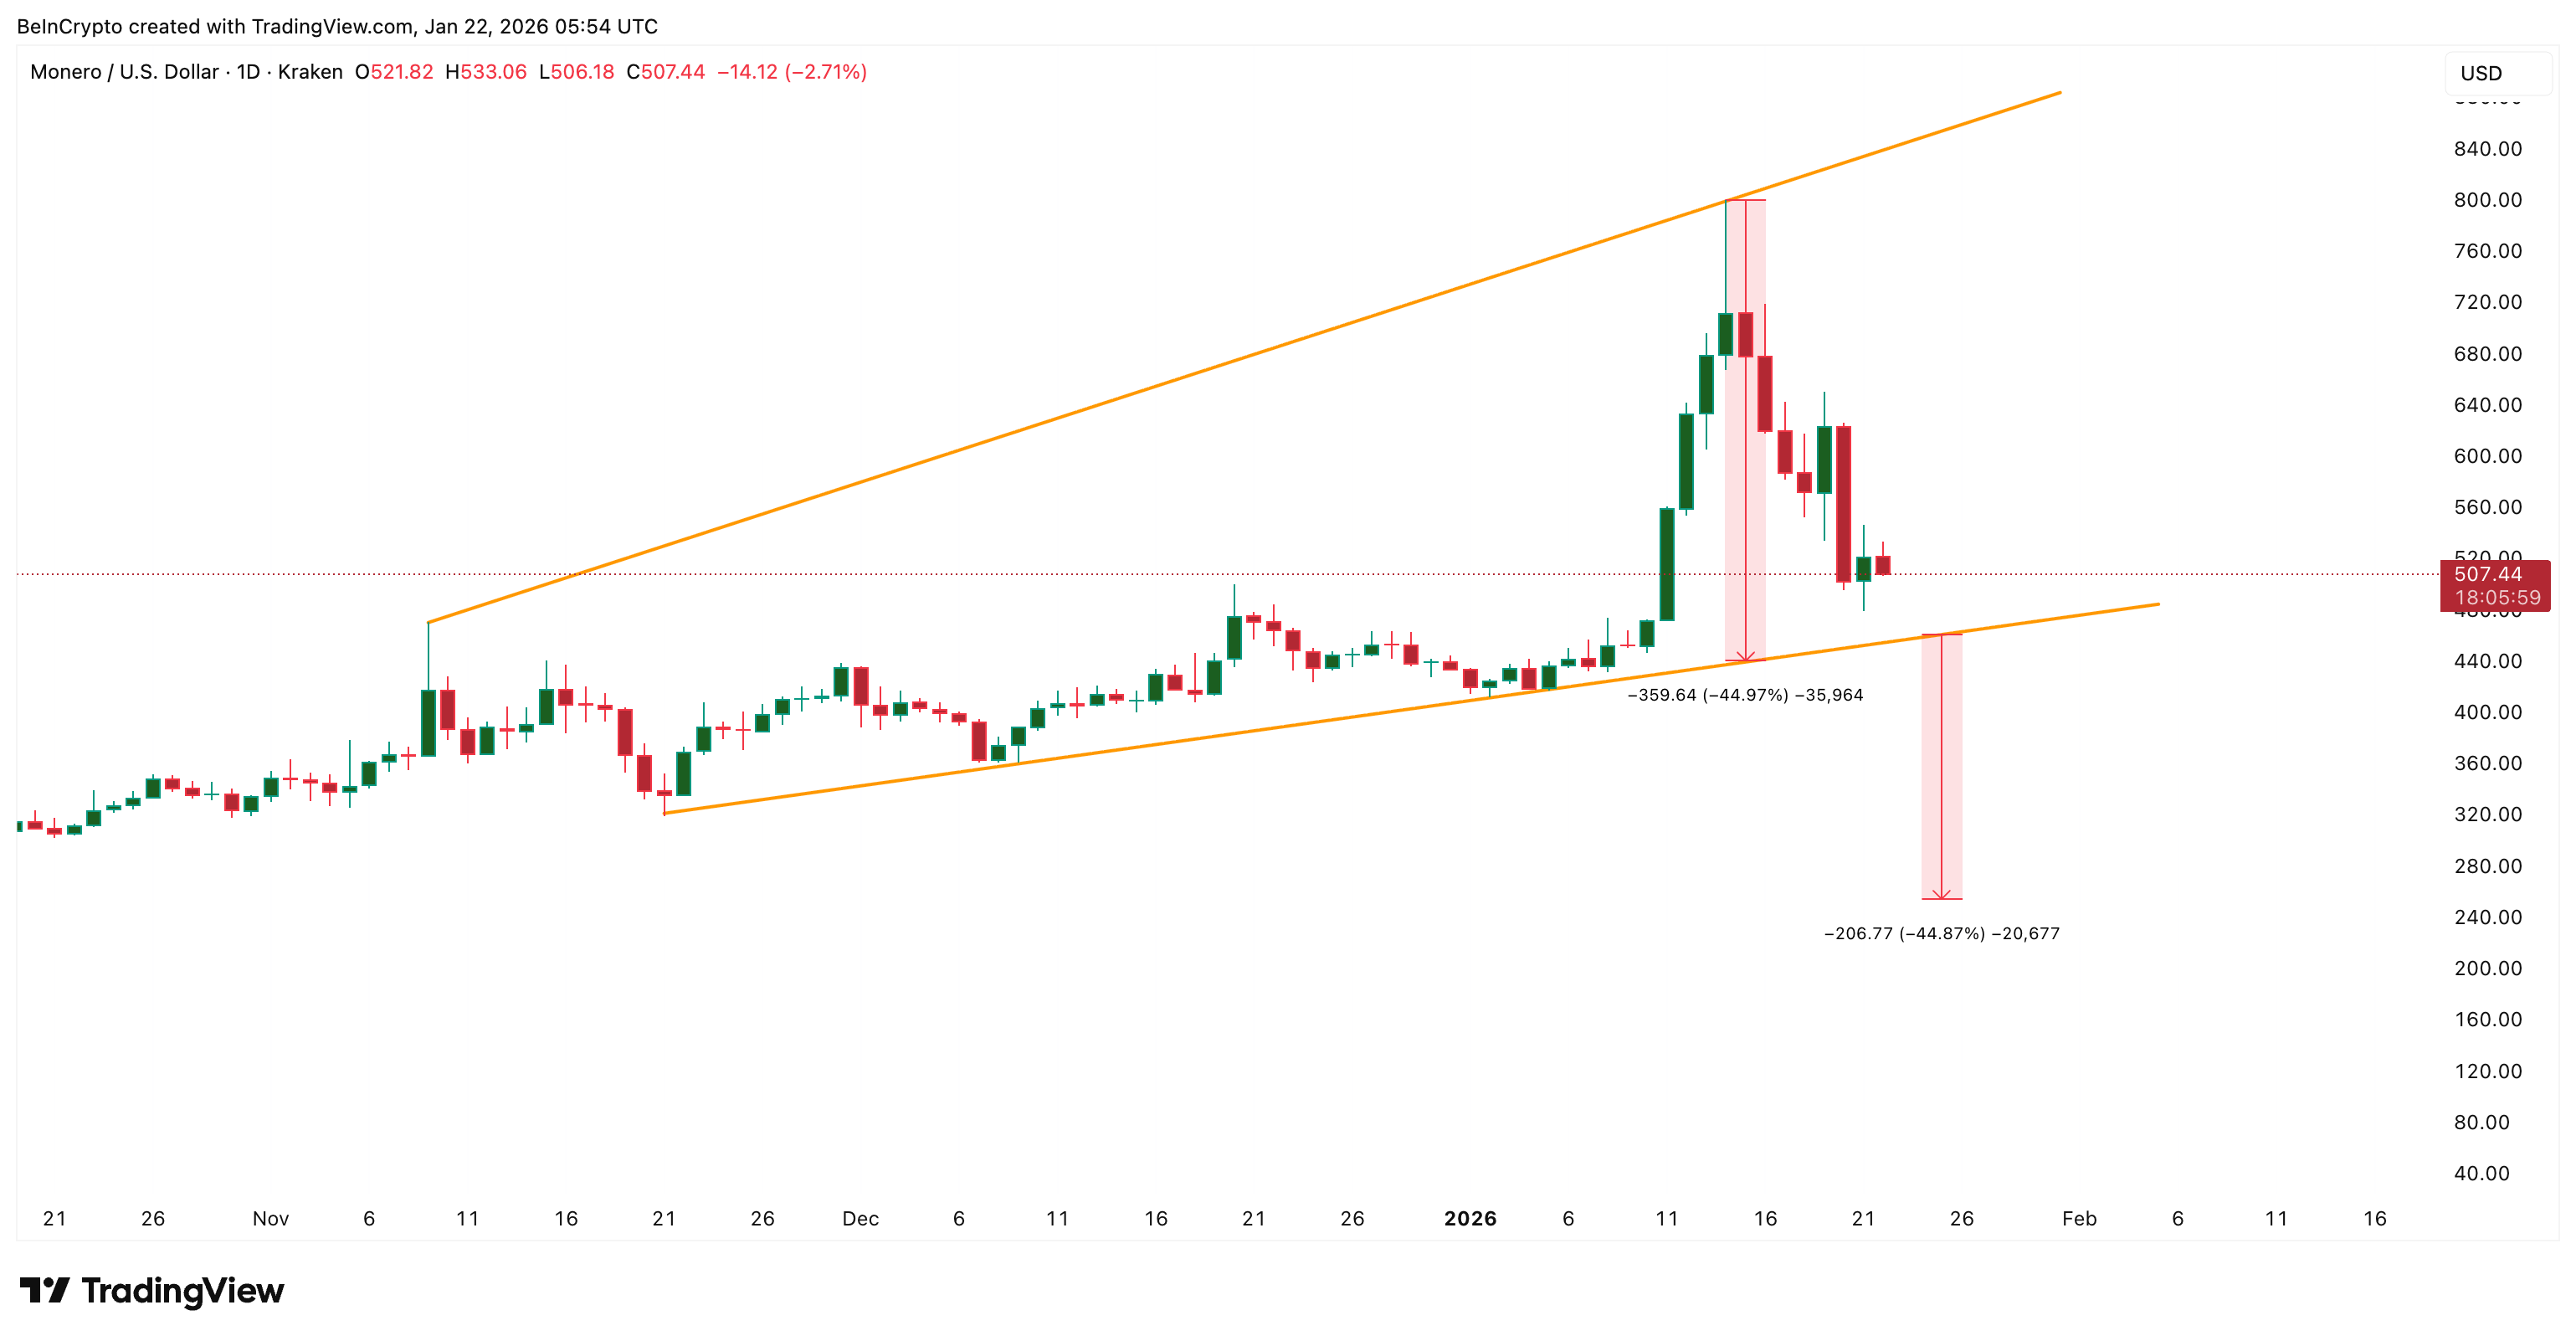 Monero’s Bearish Pattern: TradingView
What makes this setup more concerning is how closely it aligns with Monero’s recent February history.
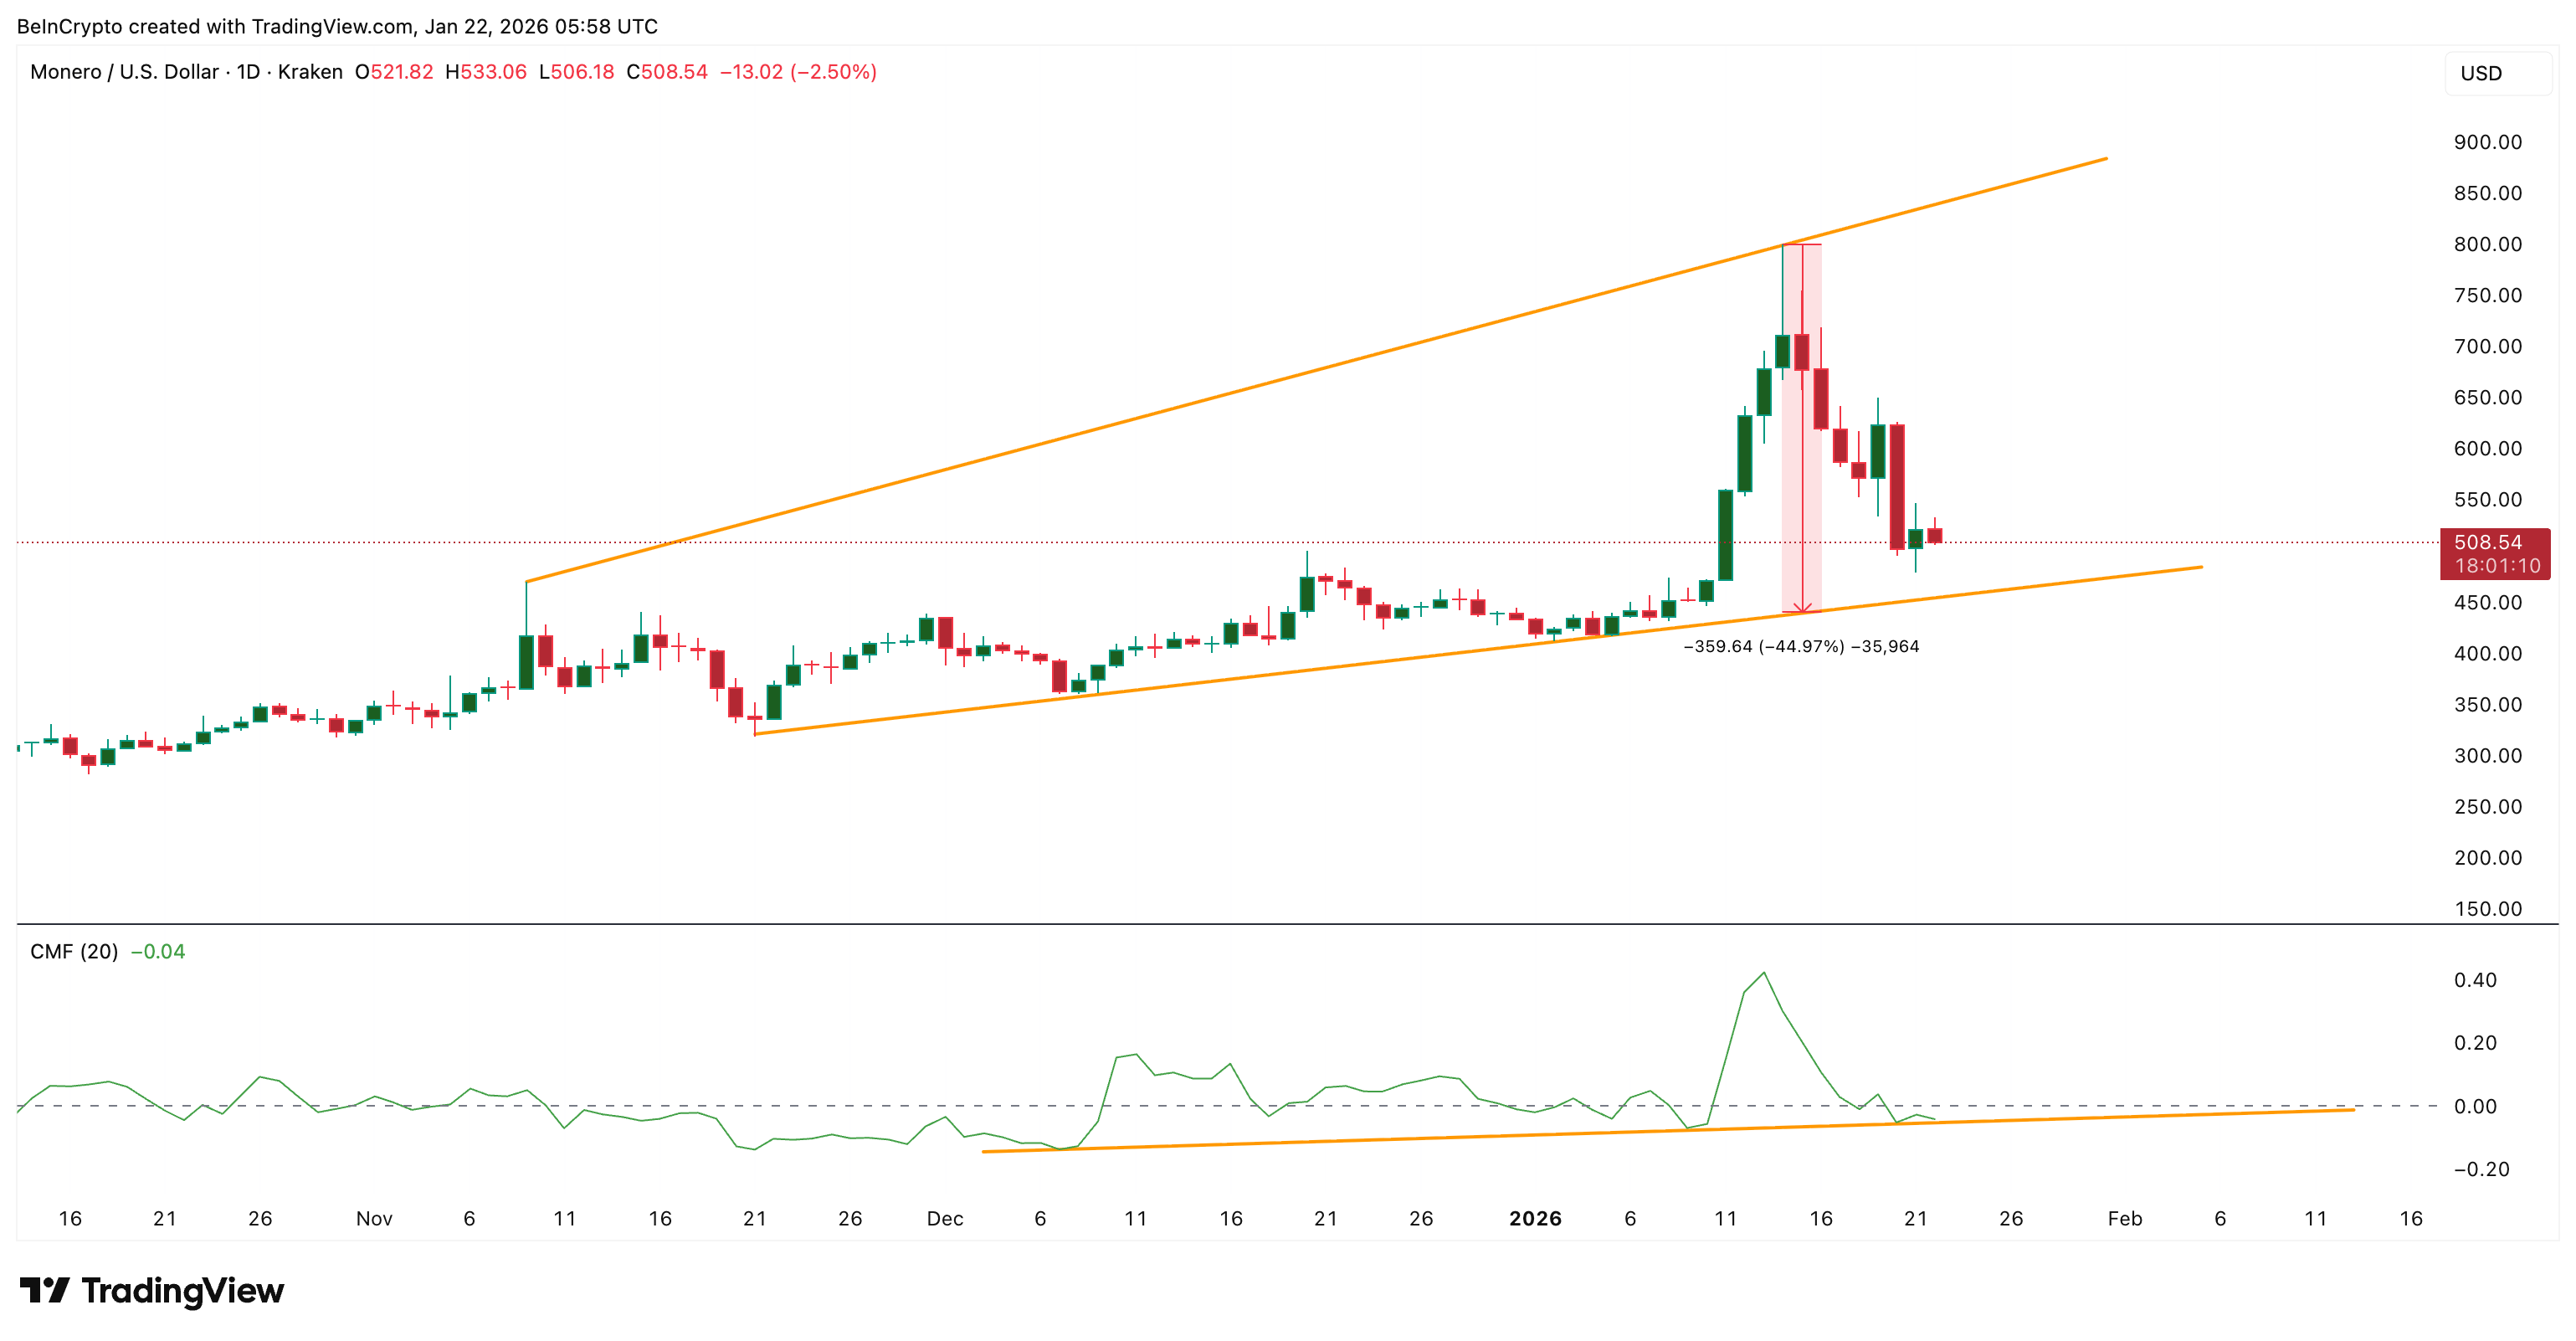
Since February 2023, XMR has been consistently negative.
Across these three Februarys, Monero posted an average monthly decline of roughly 8–16%, with weakness often accelerating after strong January performance.
 Historical Price Moves: CryptoRank
That context matters. Monero is once again coming off a strong January, and the XMR price is now rolling over as February approaches. The wedge does not guarantee a breakdown, but it does mean history and structure are pointing in the same direction.
That risk becomes clearer once momentum indicators are added.
Momentum and Capital Flows Confirm Selling Pressure Is Building
Momentum is no longer supporting the uptrend.
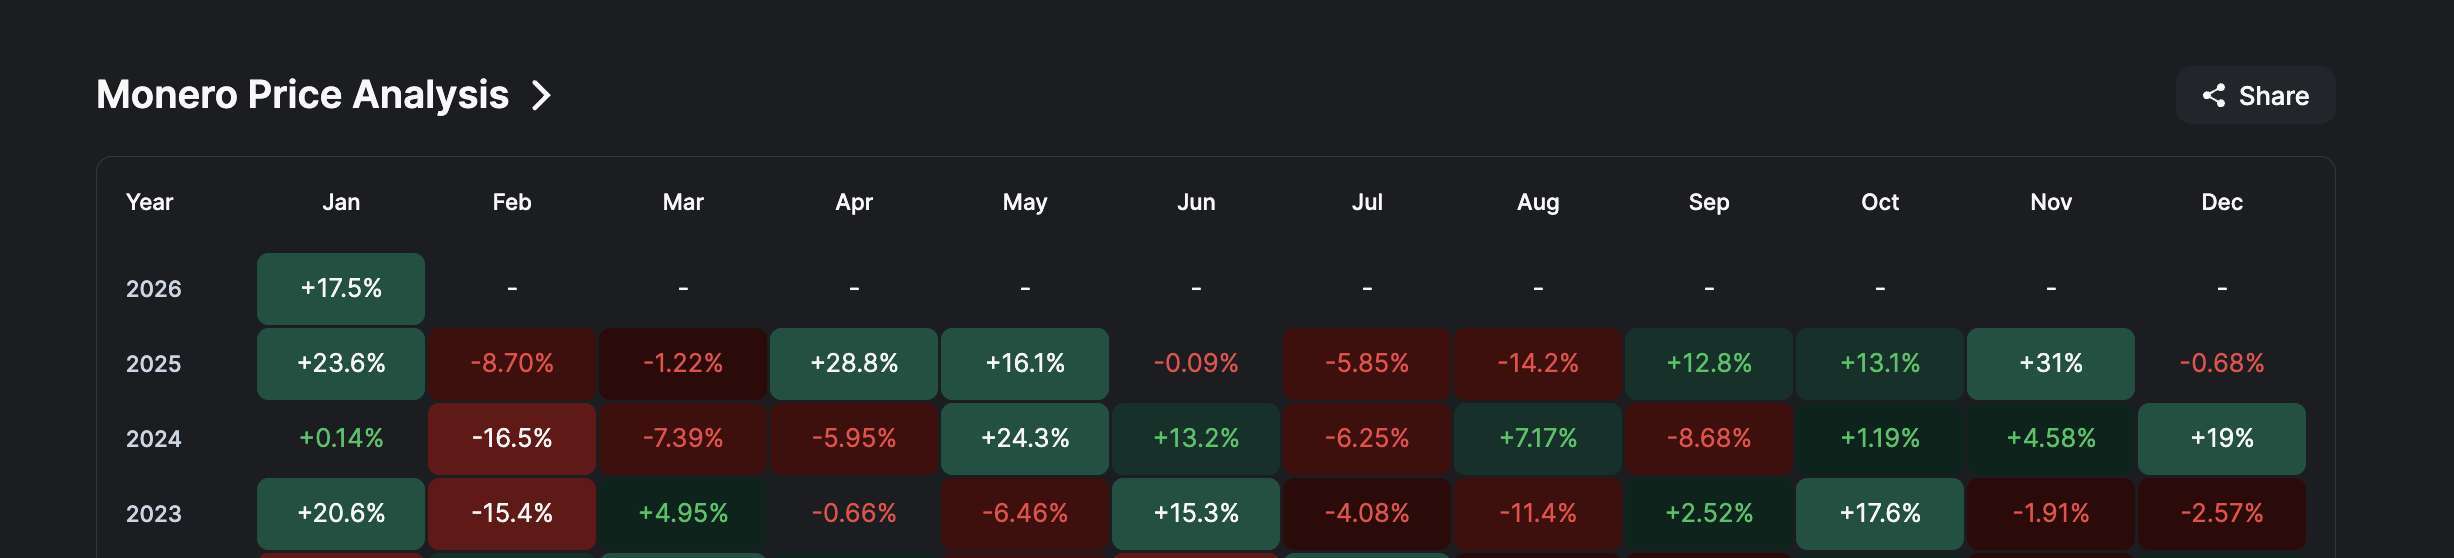
Between November 9 and January 19, the Monero price printed a higher high. Over the same period, the Relative Strength Index (RSI) formed a lower high. RSI measures momentum by comparing recent gains to recent losses. When price rises, but RSI weakens, it signals bearish divergence, often seen before trend reversals.
At the same time, Monero has slipped below the 20-day exponential moving average (EMA). An EMA gives more weight to recent prices and is used to track short-term trend strength. Losing the 20-day EMA shows buyers are losing control of momentum.
 Bearish Divergence At Work: TradingView
Attention now shifts to the 50-day EMA, which sits close to the lower boundary of the rising wedge. A loss of this level would mean both momentum and trend support have failed together.
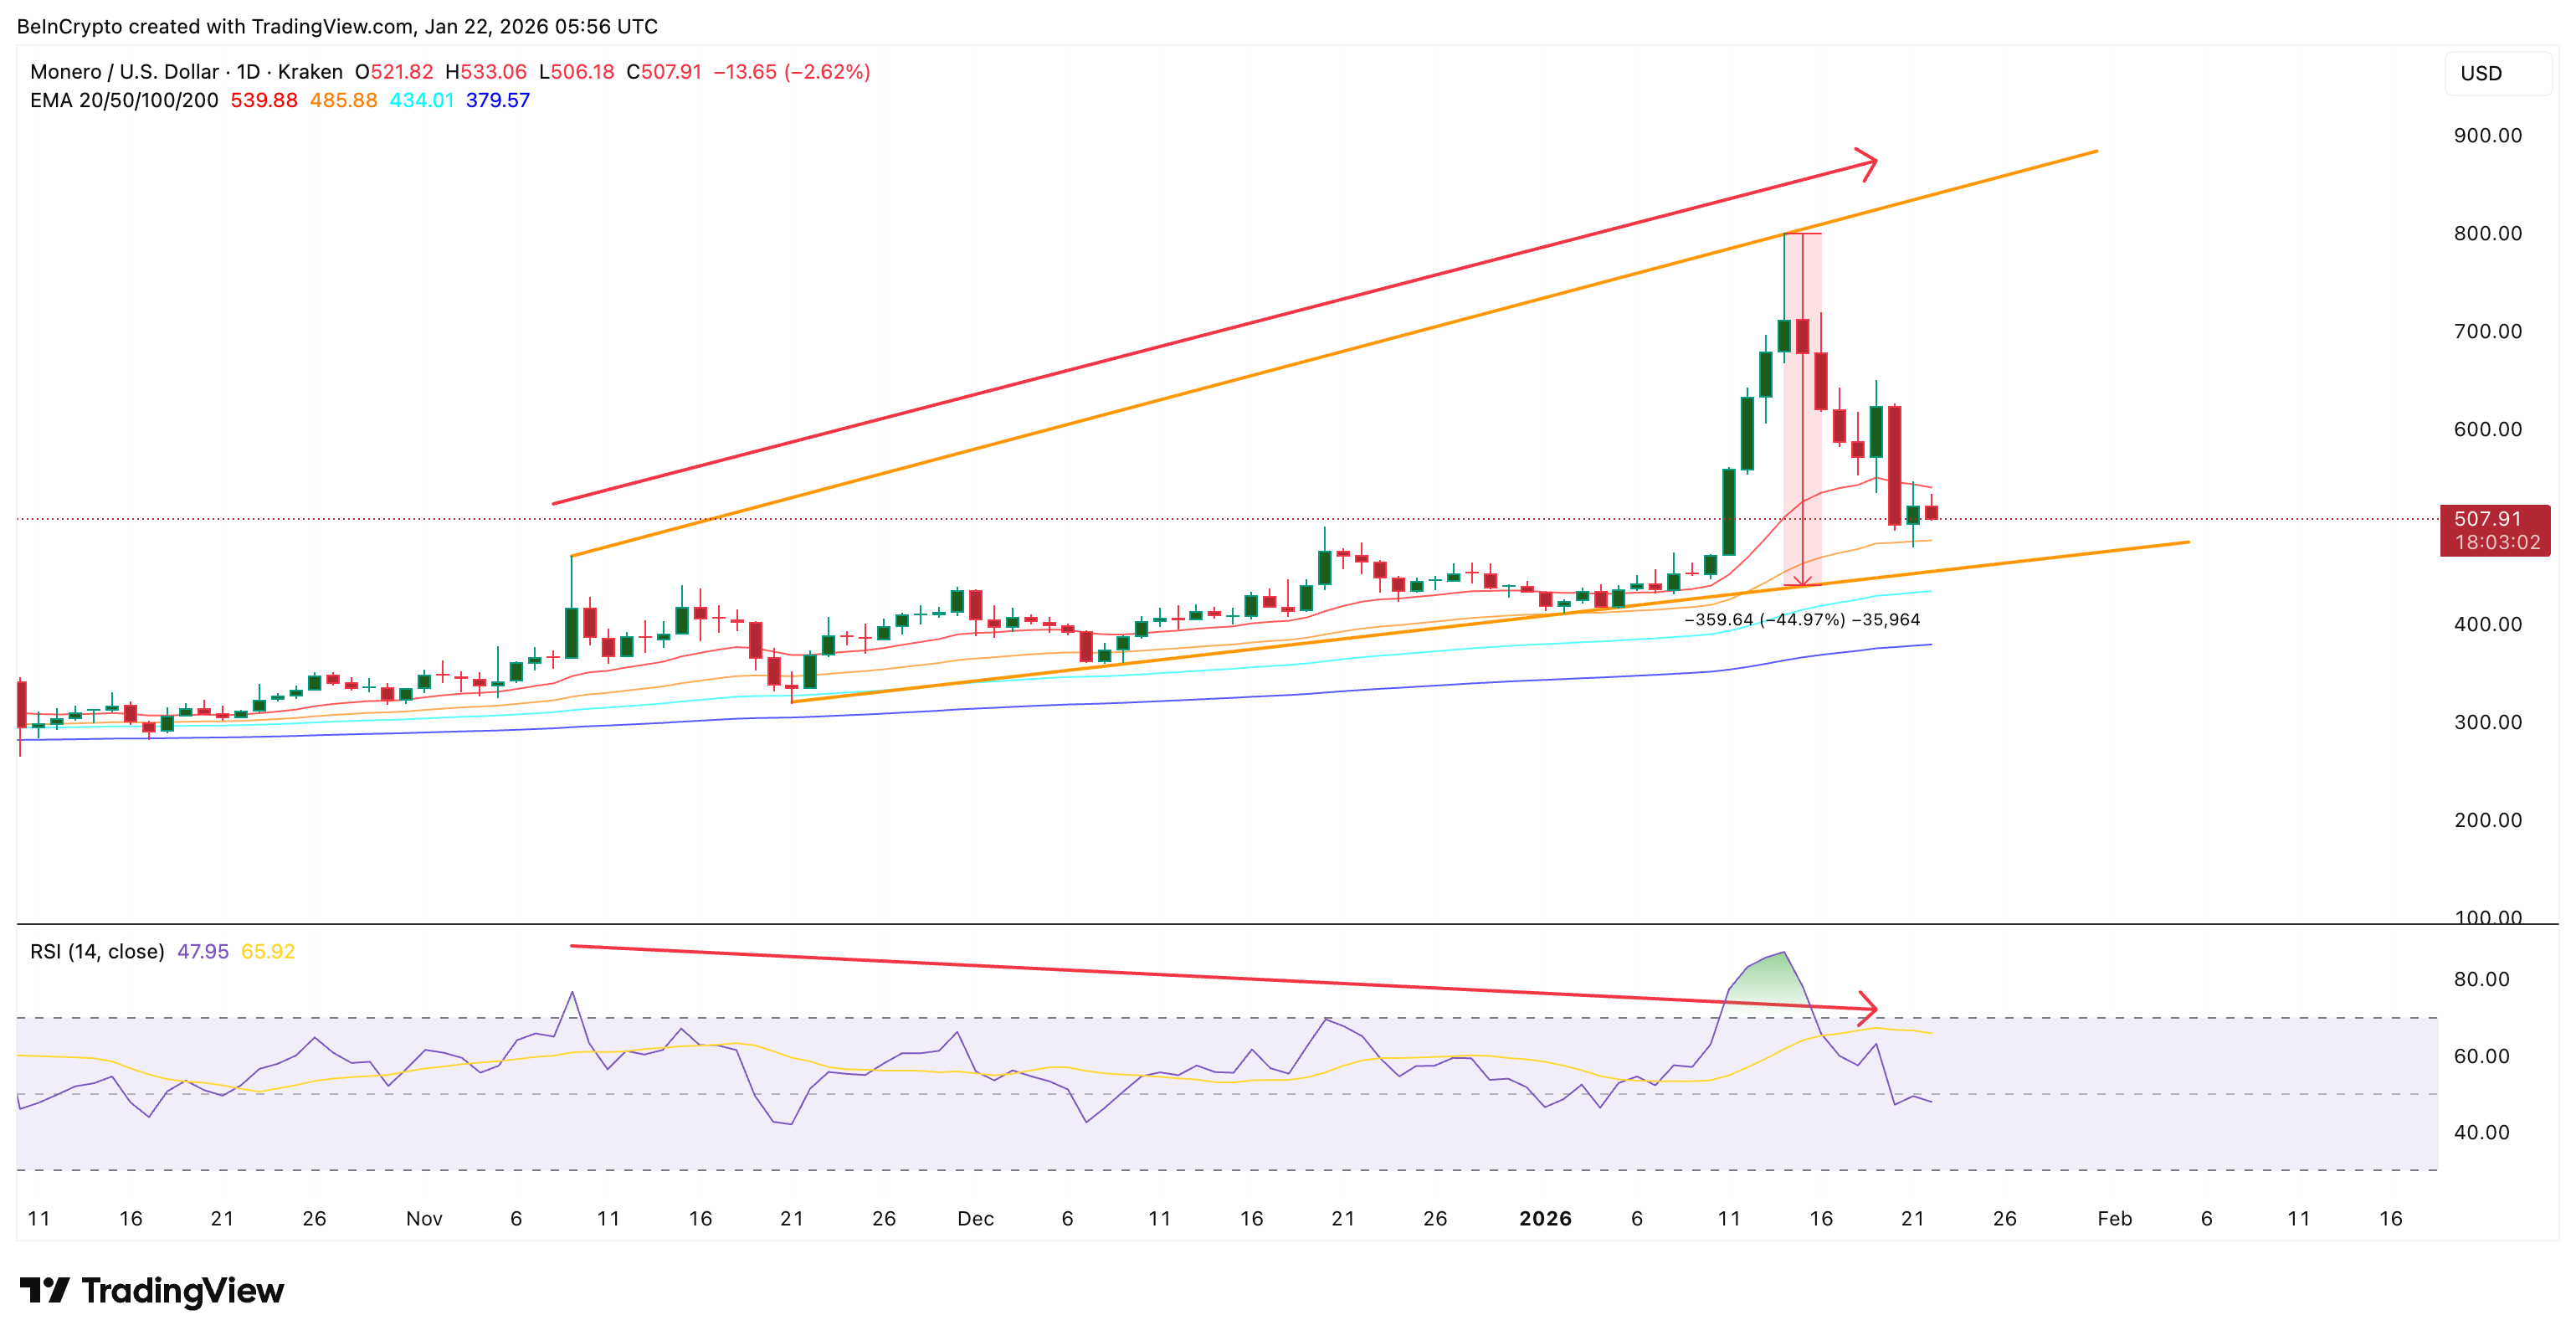
Capital flow data adds another warning.
The Chaikin Money Flow (CMF) indicator has moved below zero, showing that money is flowing out of Monero rather than into it. CMF is now pressing against its rising trendline that has held since early December. A clean break below that line would confirm sustained capital outflows.
 Weak Capital Flows: TradingView
In simple terms, momentum is fading, trend support is weakening, and capital is starting to leave. That combination rarely resolves upward without a decisive reclaim.
The Monero (XMR) Price Levels That Decide The Next Leg
The bearish scenario activates if Monero loses $479 on a daily close. That level is close to the lower boundary of the rising wedge, which again stands just 10% away. A confirmed break opens the path toward $360, followed by $318, starting the projected 44% move.
The bullish invalidation is equally clear.
Monero must reclaim the 20-day EMA and hold above it. The last clean reclaim of this level on January 6 triggered an 84% rally. A sustained move back above $591 would weaken the bearish divergence and significantly reduce the breakdown risk.
 Monero Price Analysis: TradingView
Until that happens, Monero remains vulnerable.
January strength has not fully disappeared, but the structure supporting it is cracking. With February historically unfriendly and momentum rolling over, the next 6–10% move will likely decide whether this is a temporary pullback or the start of a deeper “red February” unwind.
Recommended Articles


