


Is The 180% Axie Infinity (AXS) Rally Just Exit Liquidity For Holders? Charts Have The Answer
Axie Infinity is having a strong day. AXS is up about 17% today, confirming the breakout that was flagged earlier. With this move, the token is now up roughly 180% month-on-month, putting it among the top performers in the GameFi space.
But big rallies often raise one uncomfortable question. Is this strength real demand, or is it providing exit liquidity for larger holders? The charts and on-chain data point to a more complex answer.
Breakout Confirms, but Momentum Starts to Cool
The AXS price breakout itself was clean.
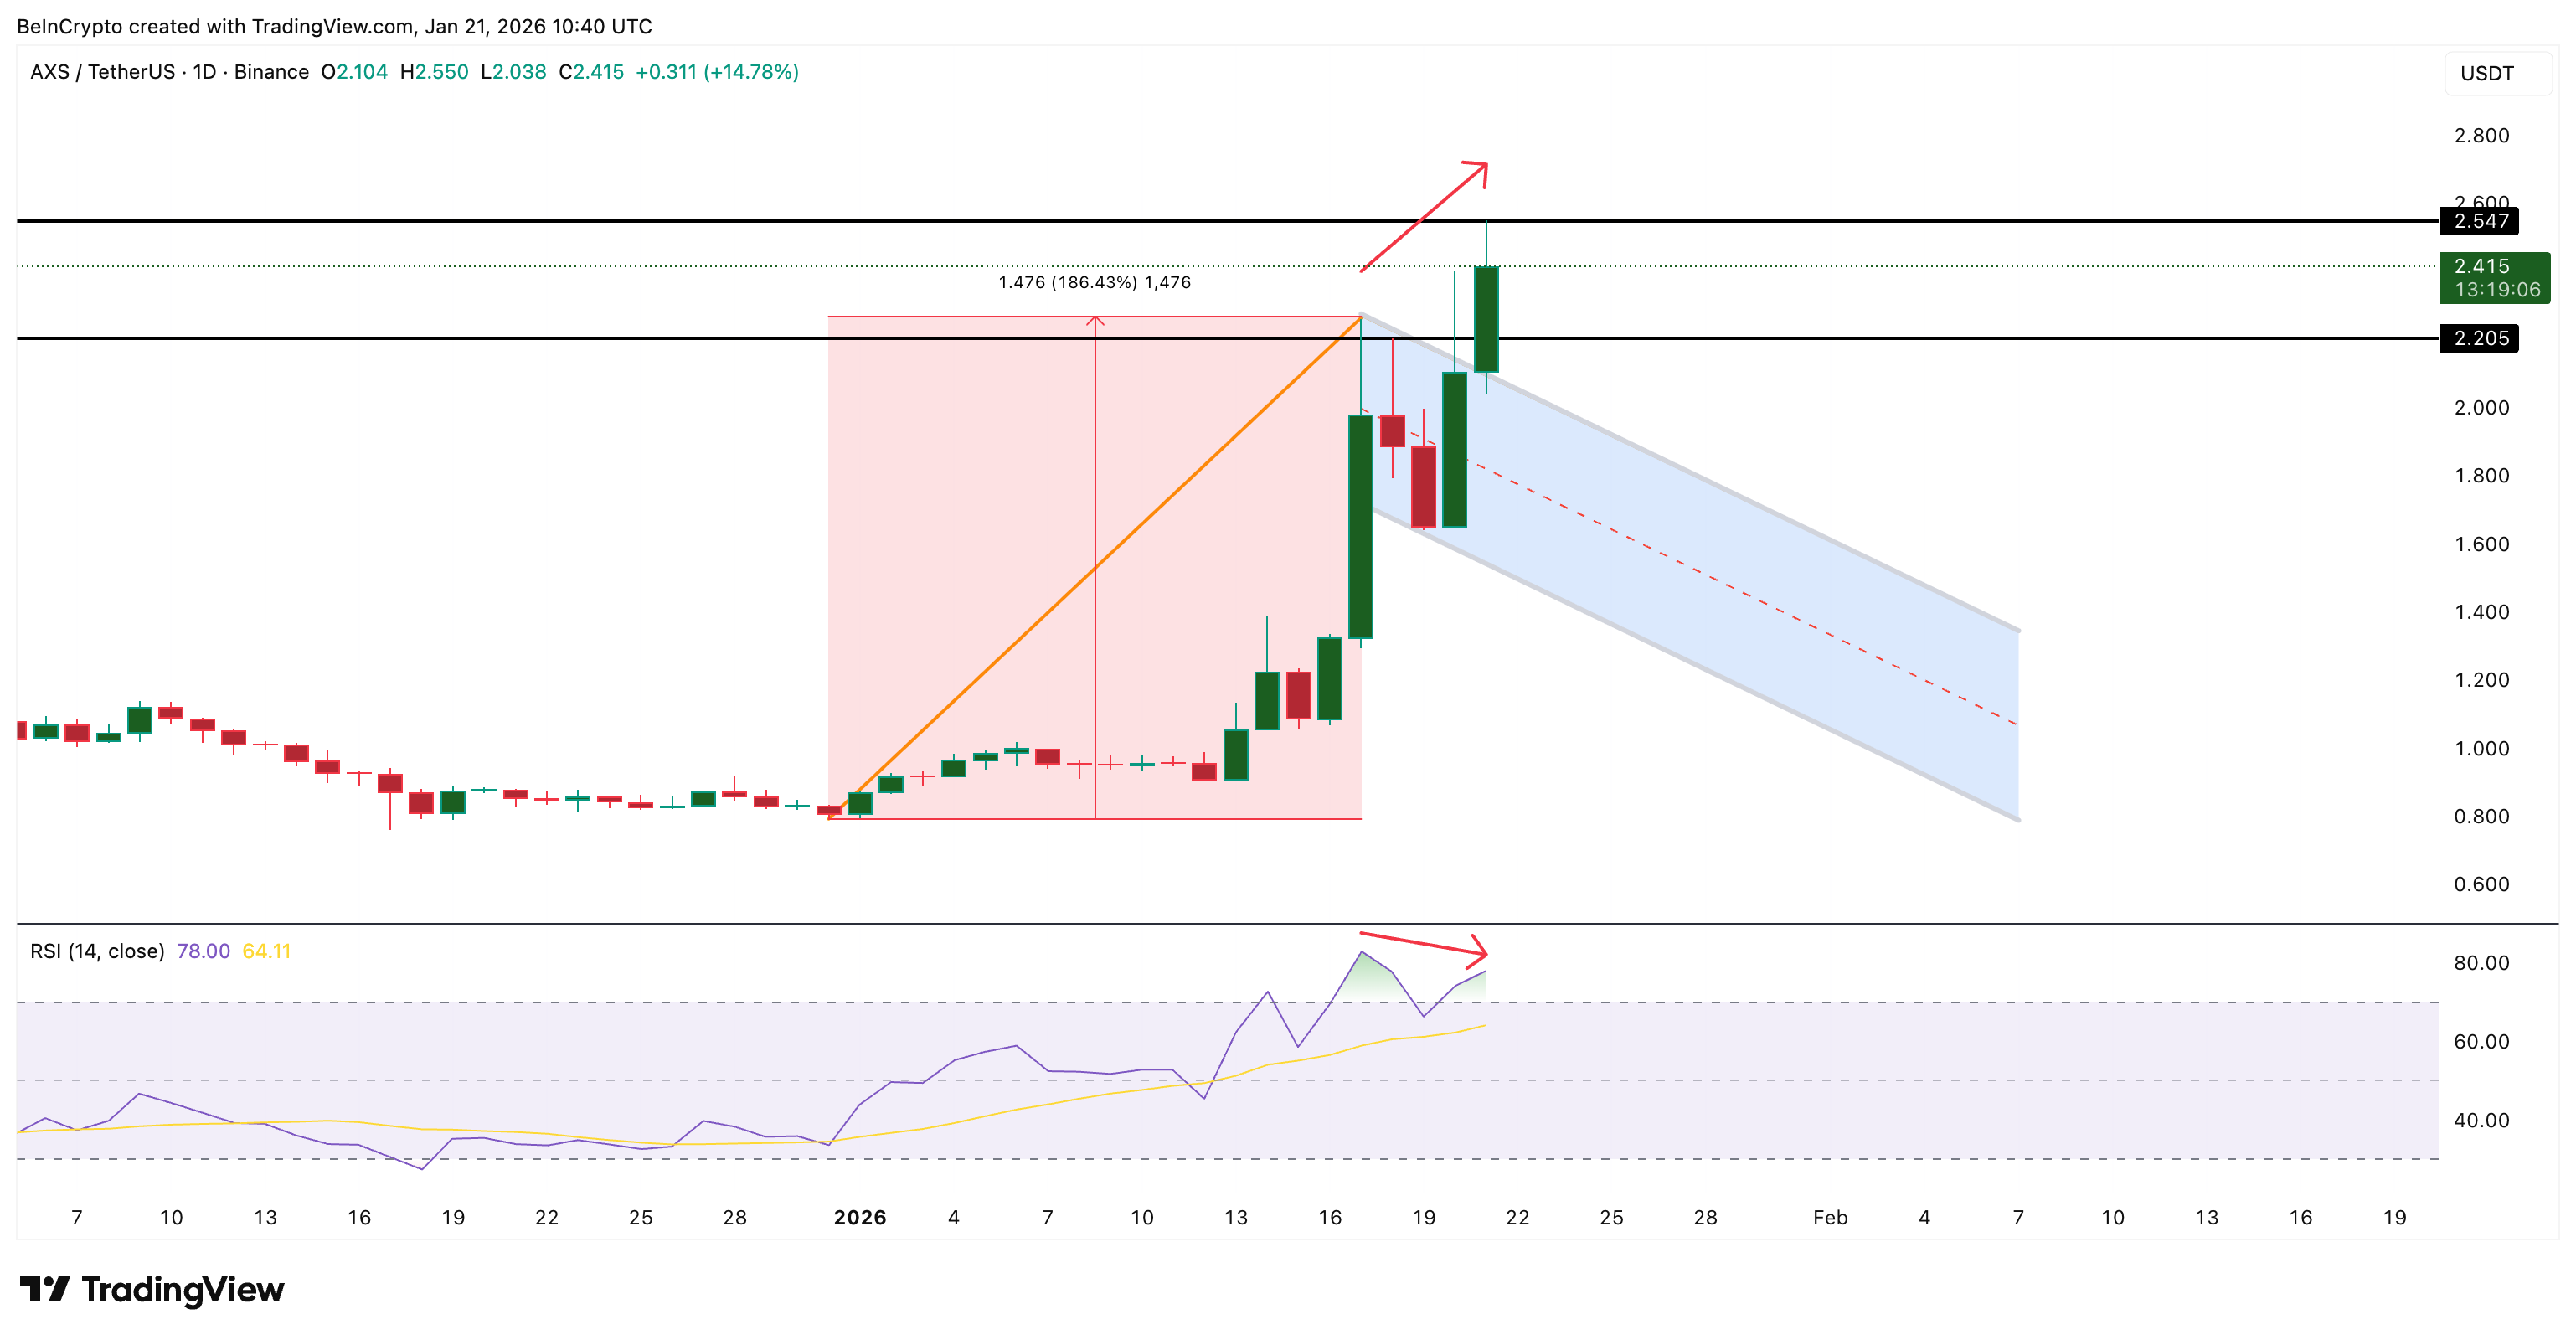
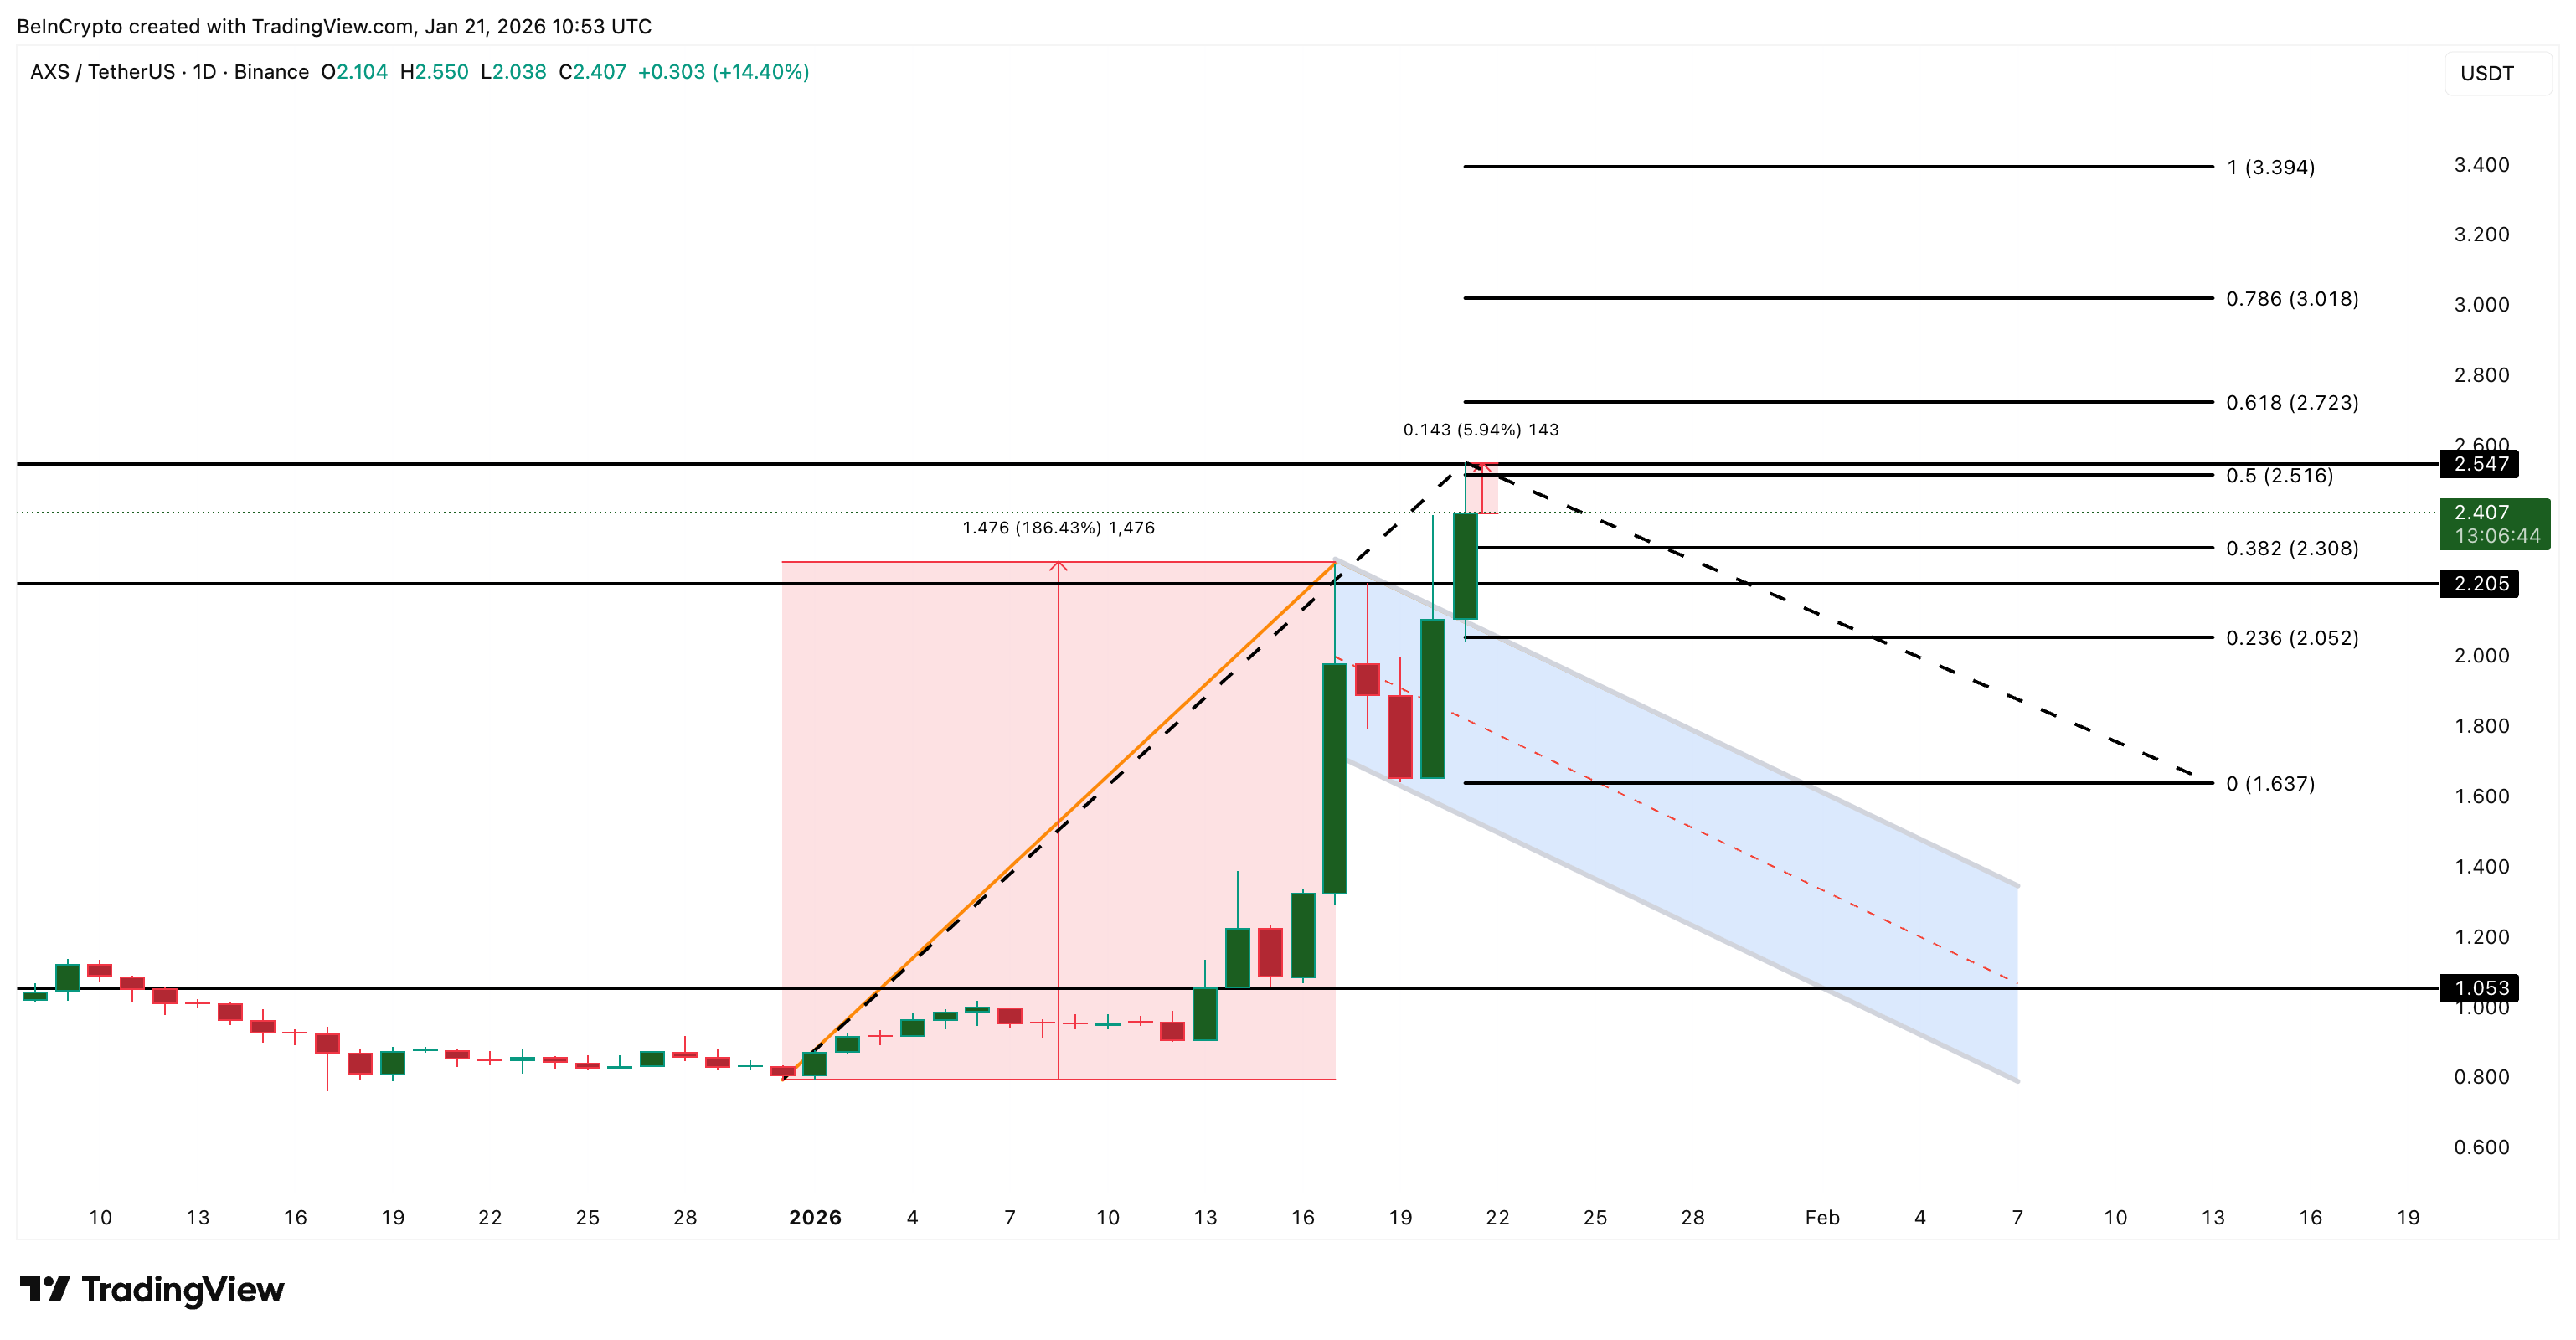
AXS broke out of a bullish flag after a few sessions of consolidation. Price rallied to a high near $2.54, a move of roughly 168% from the base. But the reaction at $2.54 matters.
Price was sharply rejected, leaving a long upper wick. That wick signals active selling, not passive profit-taking. It establishes $2.54 as a real supply level.
Momentum now adds a warning.
Between January 17 and January 21, the AXS price seems to be printing higher price highs while RSI is forming a lower high. RSI measures momentum by comparing recent gains and losses. When the price rises, but the RSI weakens, upside strength is fading, a pattern known as bearish divergence. For divergence confirmation, the next candle needs to form below $2.54, while the RSI stays lower than the last peak.
 Axie Infinity Pattern: TradingView
Want more token insights like this? Sign up for Editor Harsh Notariya’s Daily Crypto Newsletter here.
This developing bearish divergence does not invalidate the breakout.
It suggests that continuation now requires new demand, not just the momentum of earlier buyers. Without it, the rally is vulnerable to a pullback, pause, or even reversal.
Big Holders Sell Into Strength While Short-Term Buyers Chase
On-chain data explains why the rally looks unstable.
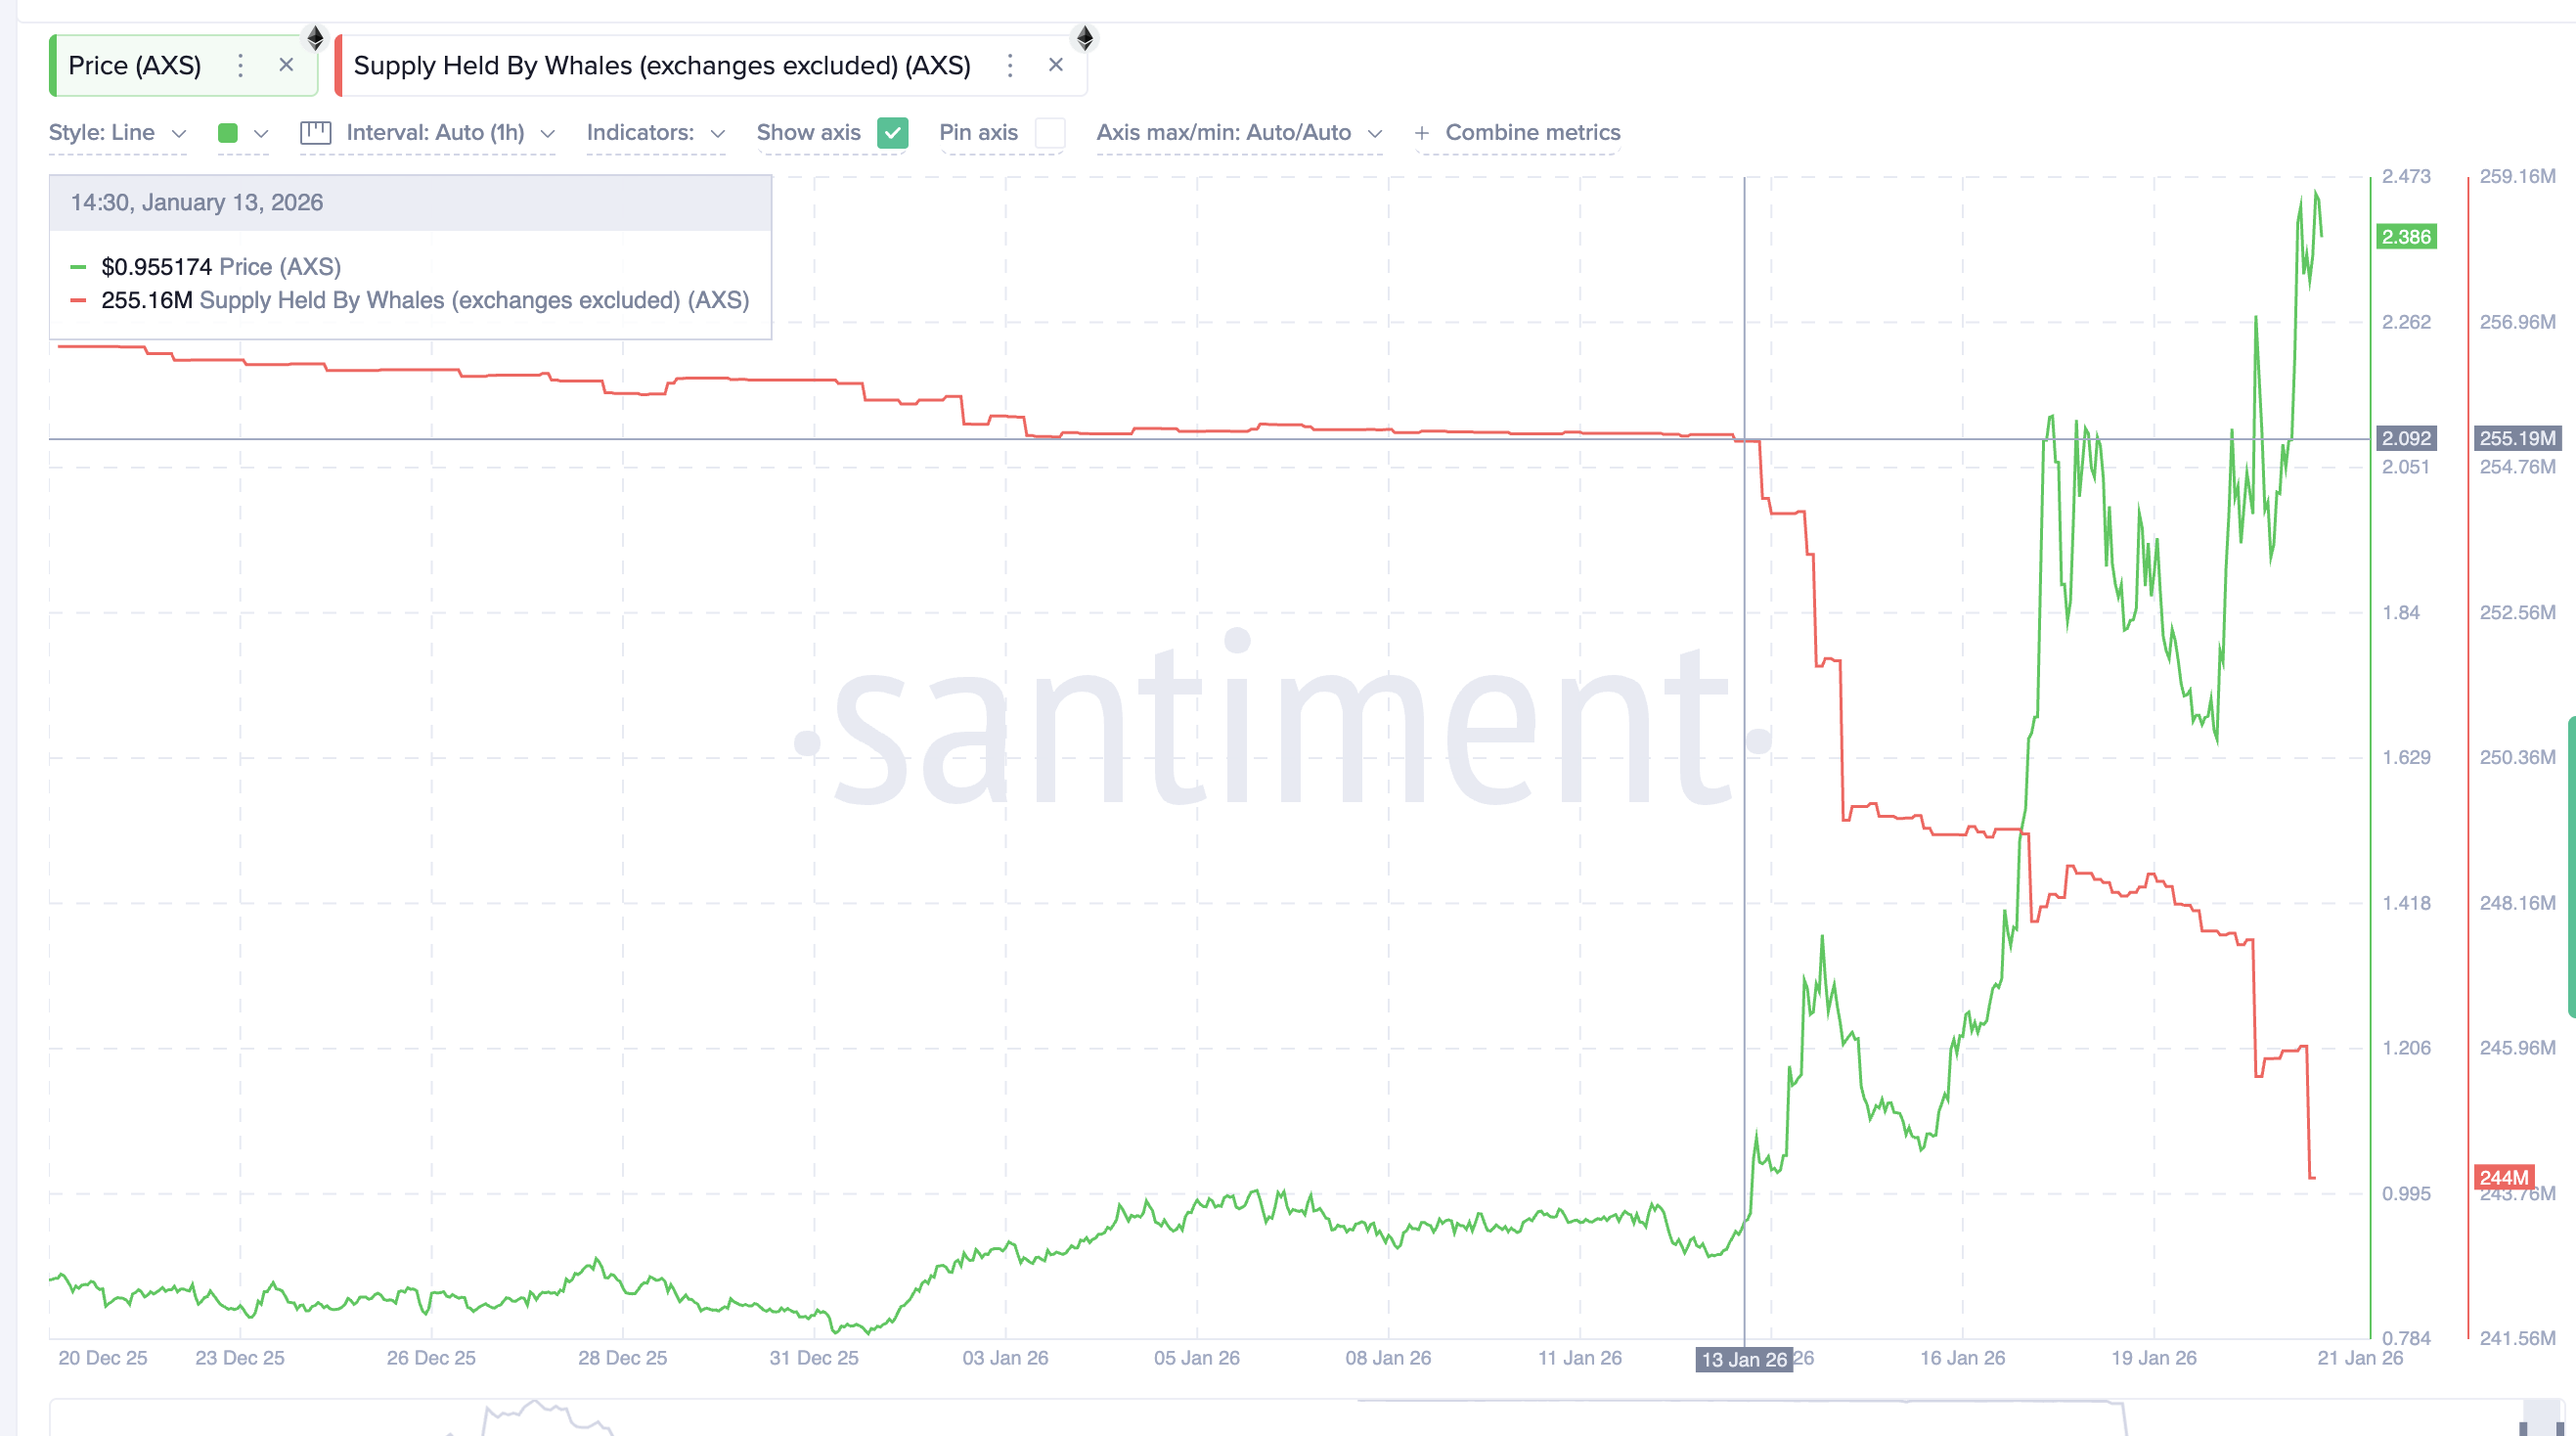
Since January 13, AXS price climbed from about $0.95 to $2.39, a gain of roughly 151%. Over the same period, whale supply fell from 255.16 million AXS to about 244 million AXS. That means whales sold roughly 11.2 million AXS, or about 4.4% of their holdings, directly into rising prices.
 AXS Whales: Santiment
HODL waves confirm this behavior.
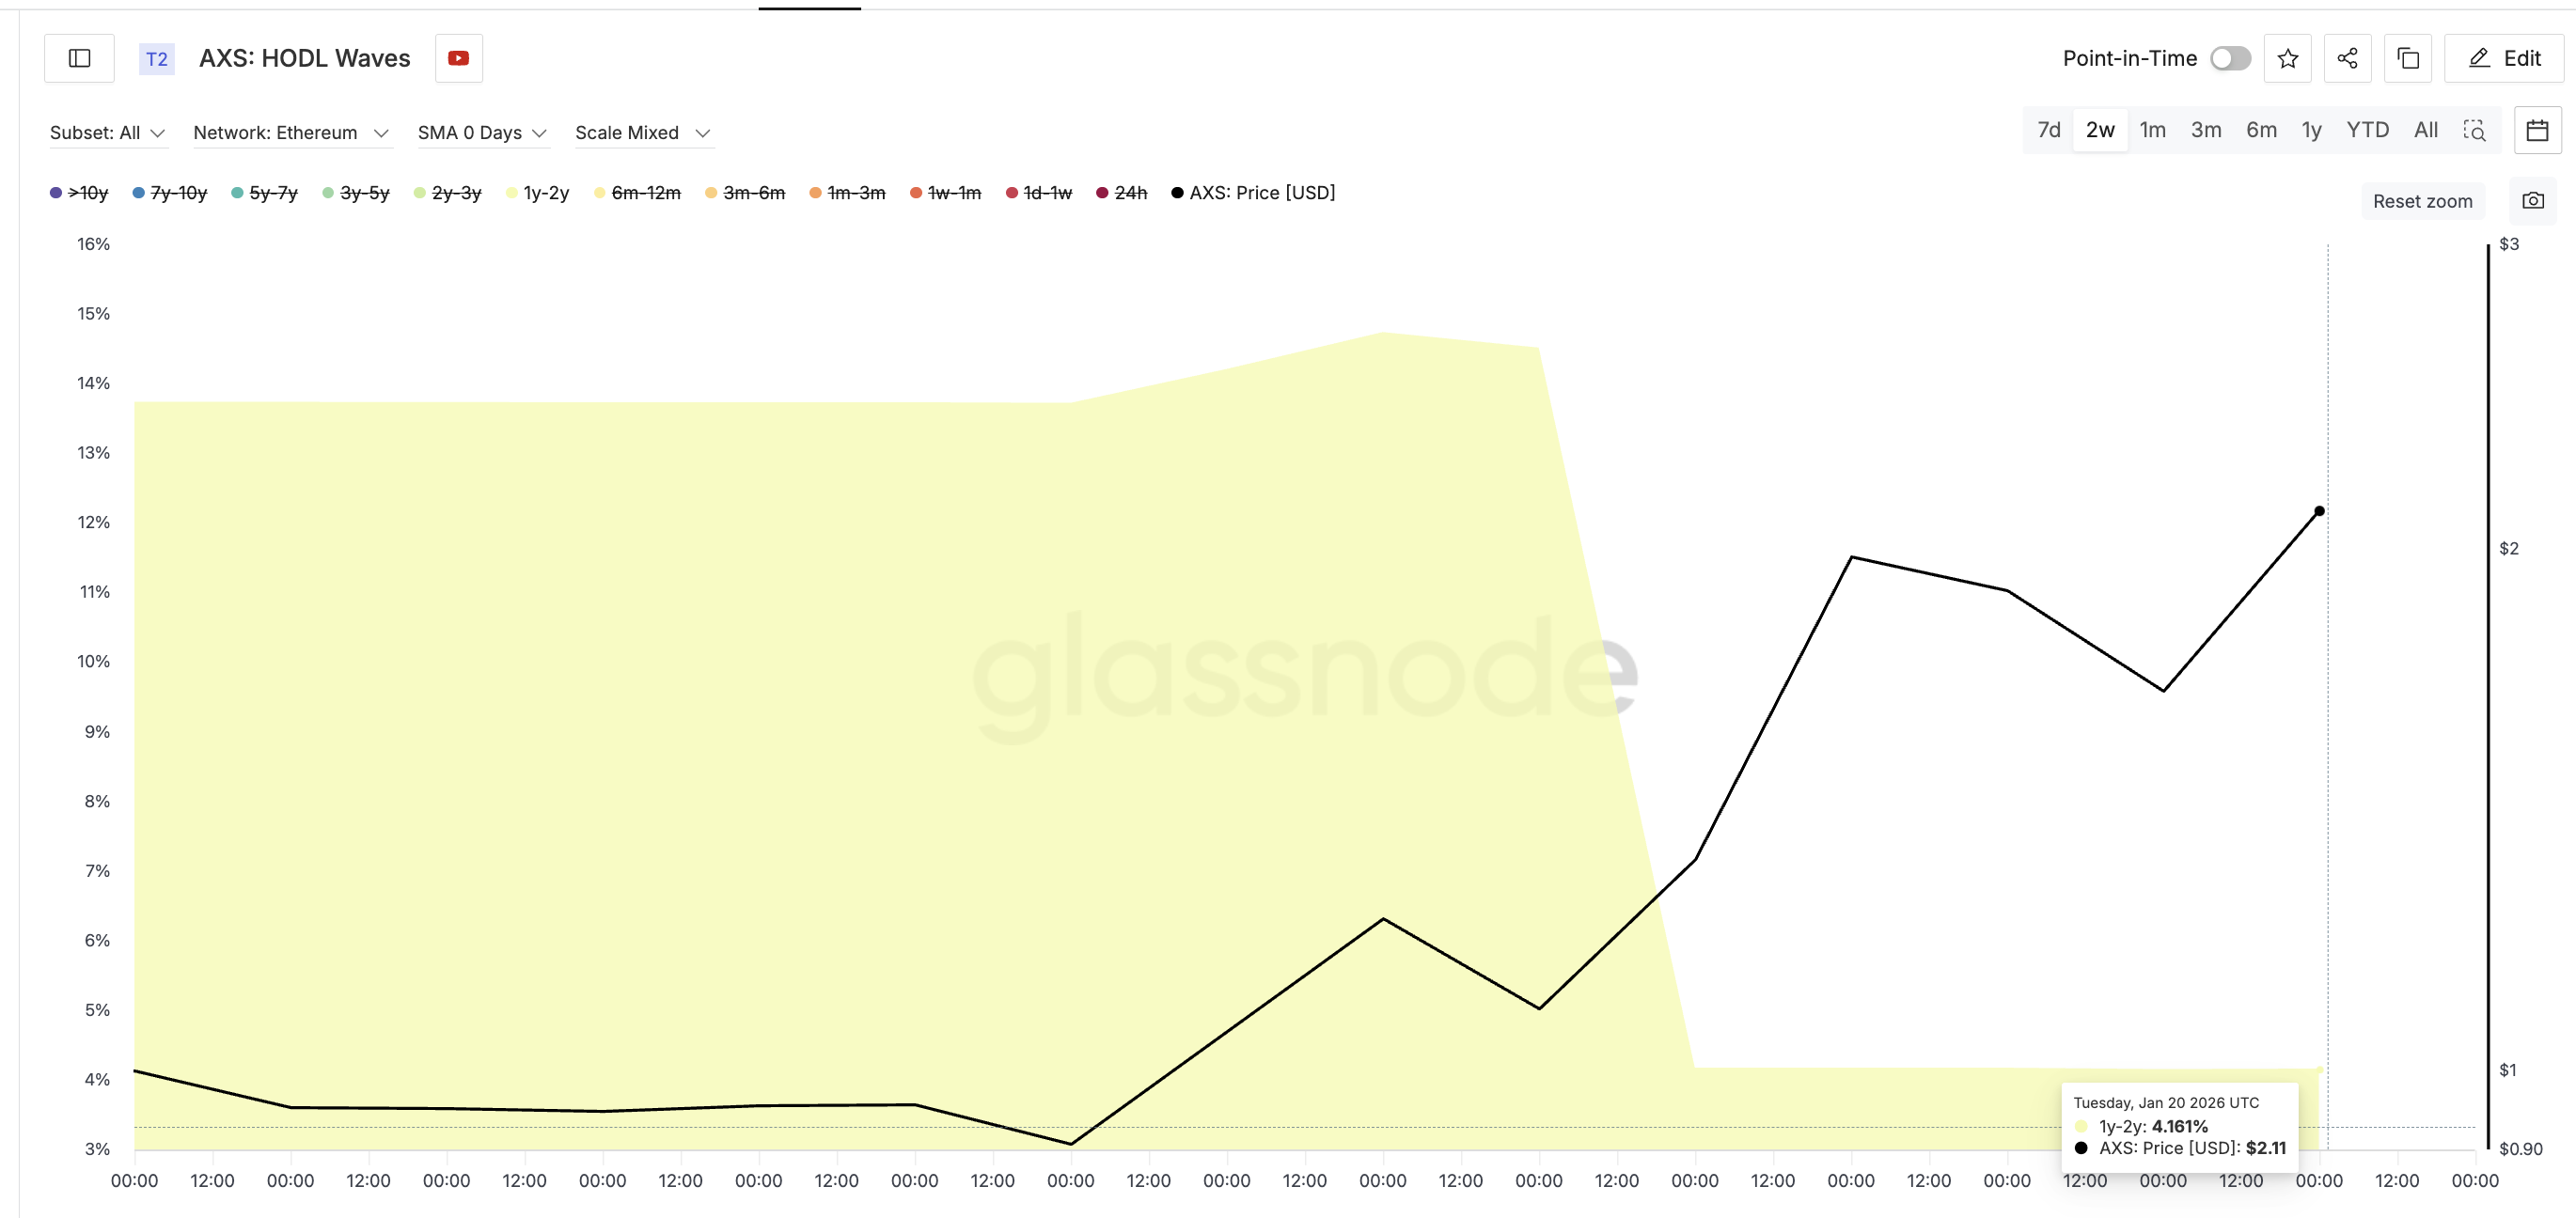
HODL waves track how long coins have been held and show which holder groups are increasing or decreasing supply. The 1-year to 2-year cohort dropped sharply, falling from 13.73% of the total supply to about 4.16%. Long-term holders are using this rally to reduce exposure, not build it.
 Long-Term Holders: Glassnode
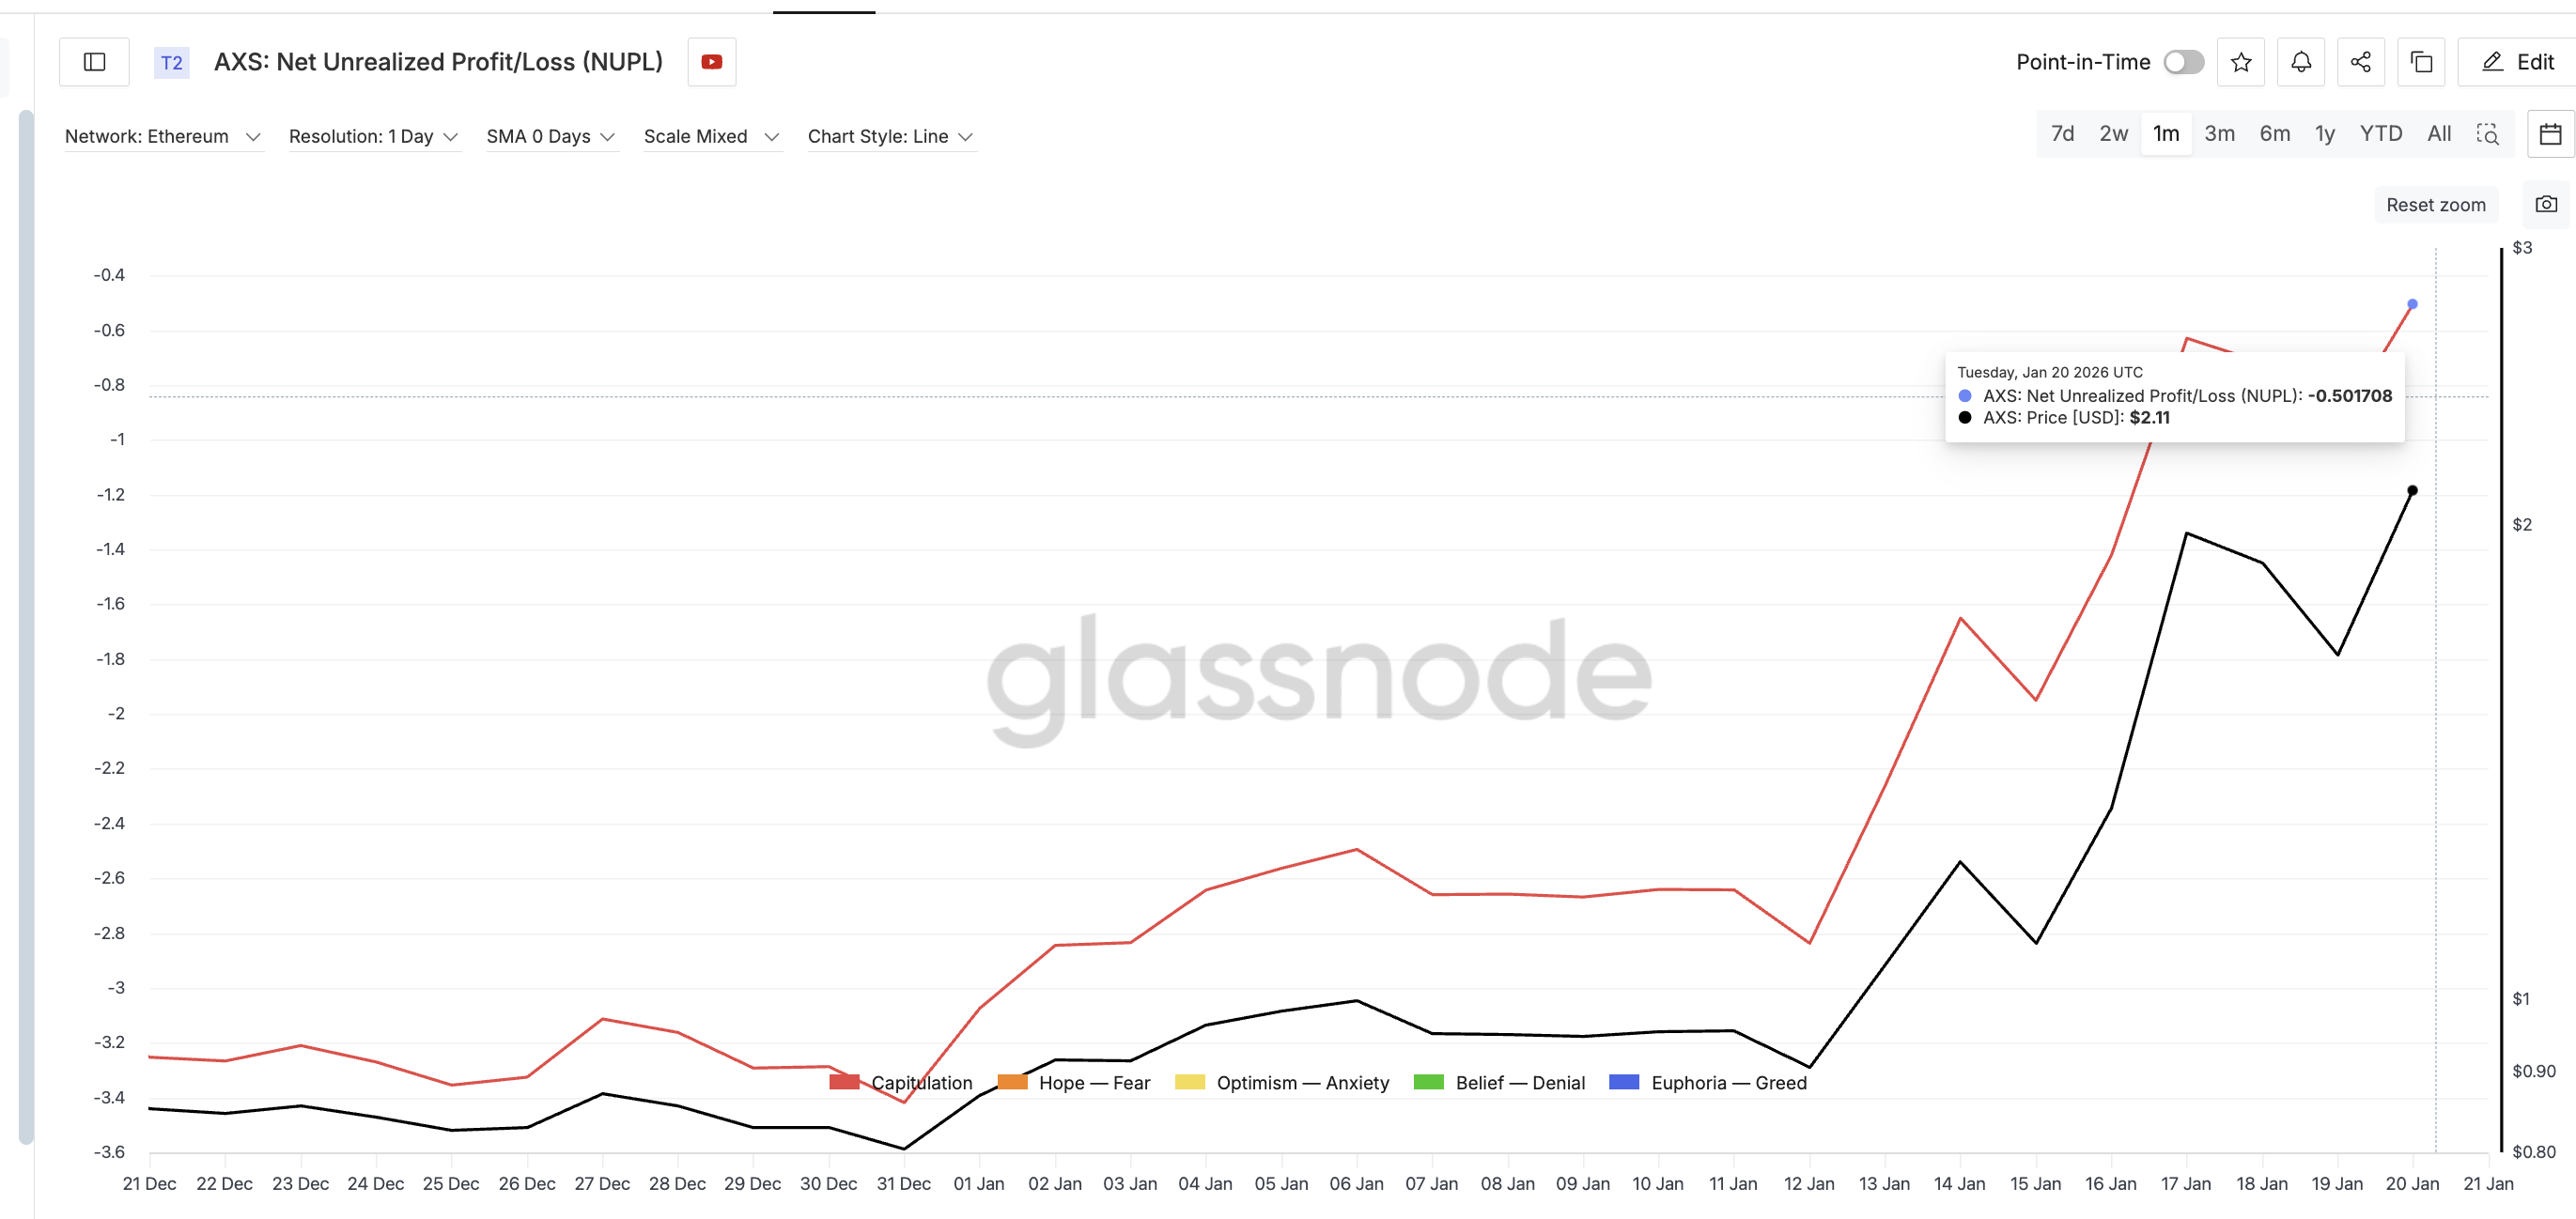
NUPL explains why this is happening now. Net Unrealized Profit/Loss (NUPL) measures whether holders are sitting in profit or loss. A negative value means holders are still underwater. For AXS, NUPL remains deep in the capitulation zone, but the intensity of losses is easing.
Since late December, NUPL has improved from roughly −3.4 to around −0.5. In simple terms, holders are still selling at a loss, but each price rally reduces that loss. That creates strong incentives to sell into strength to recover capital.
 Losses Going Down: Glassnode
Short-term holders are doing the opposite. The 1-month to 3-month cohort increased its share from 2.64% to 4.76%, an increase of over 80%. These buyers are chasing momentum, not recovering losses.
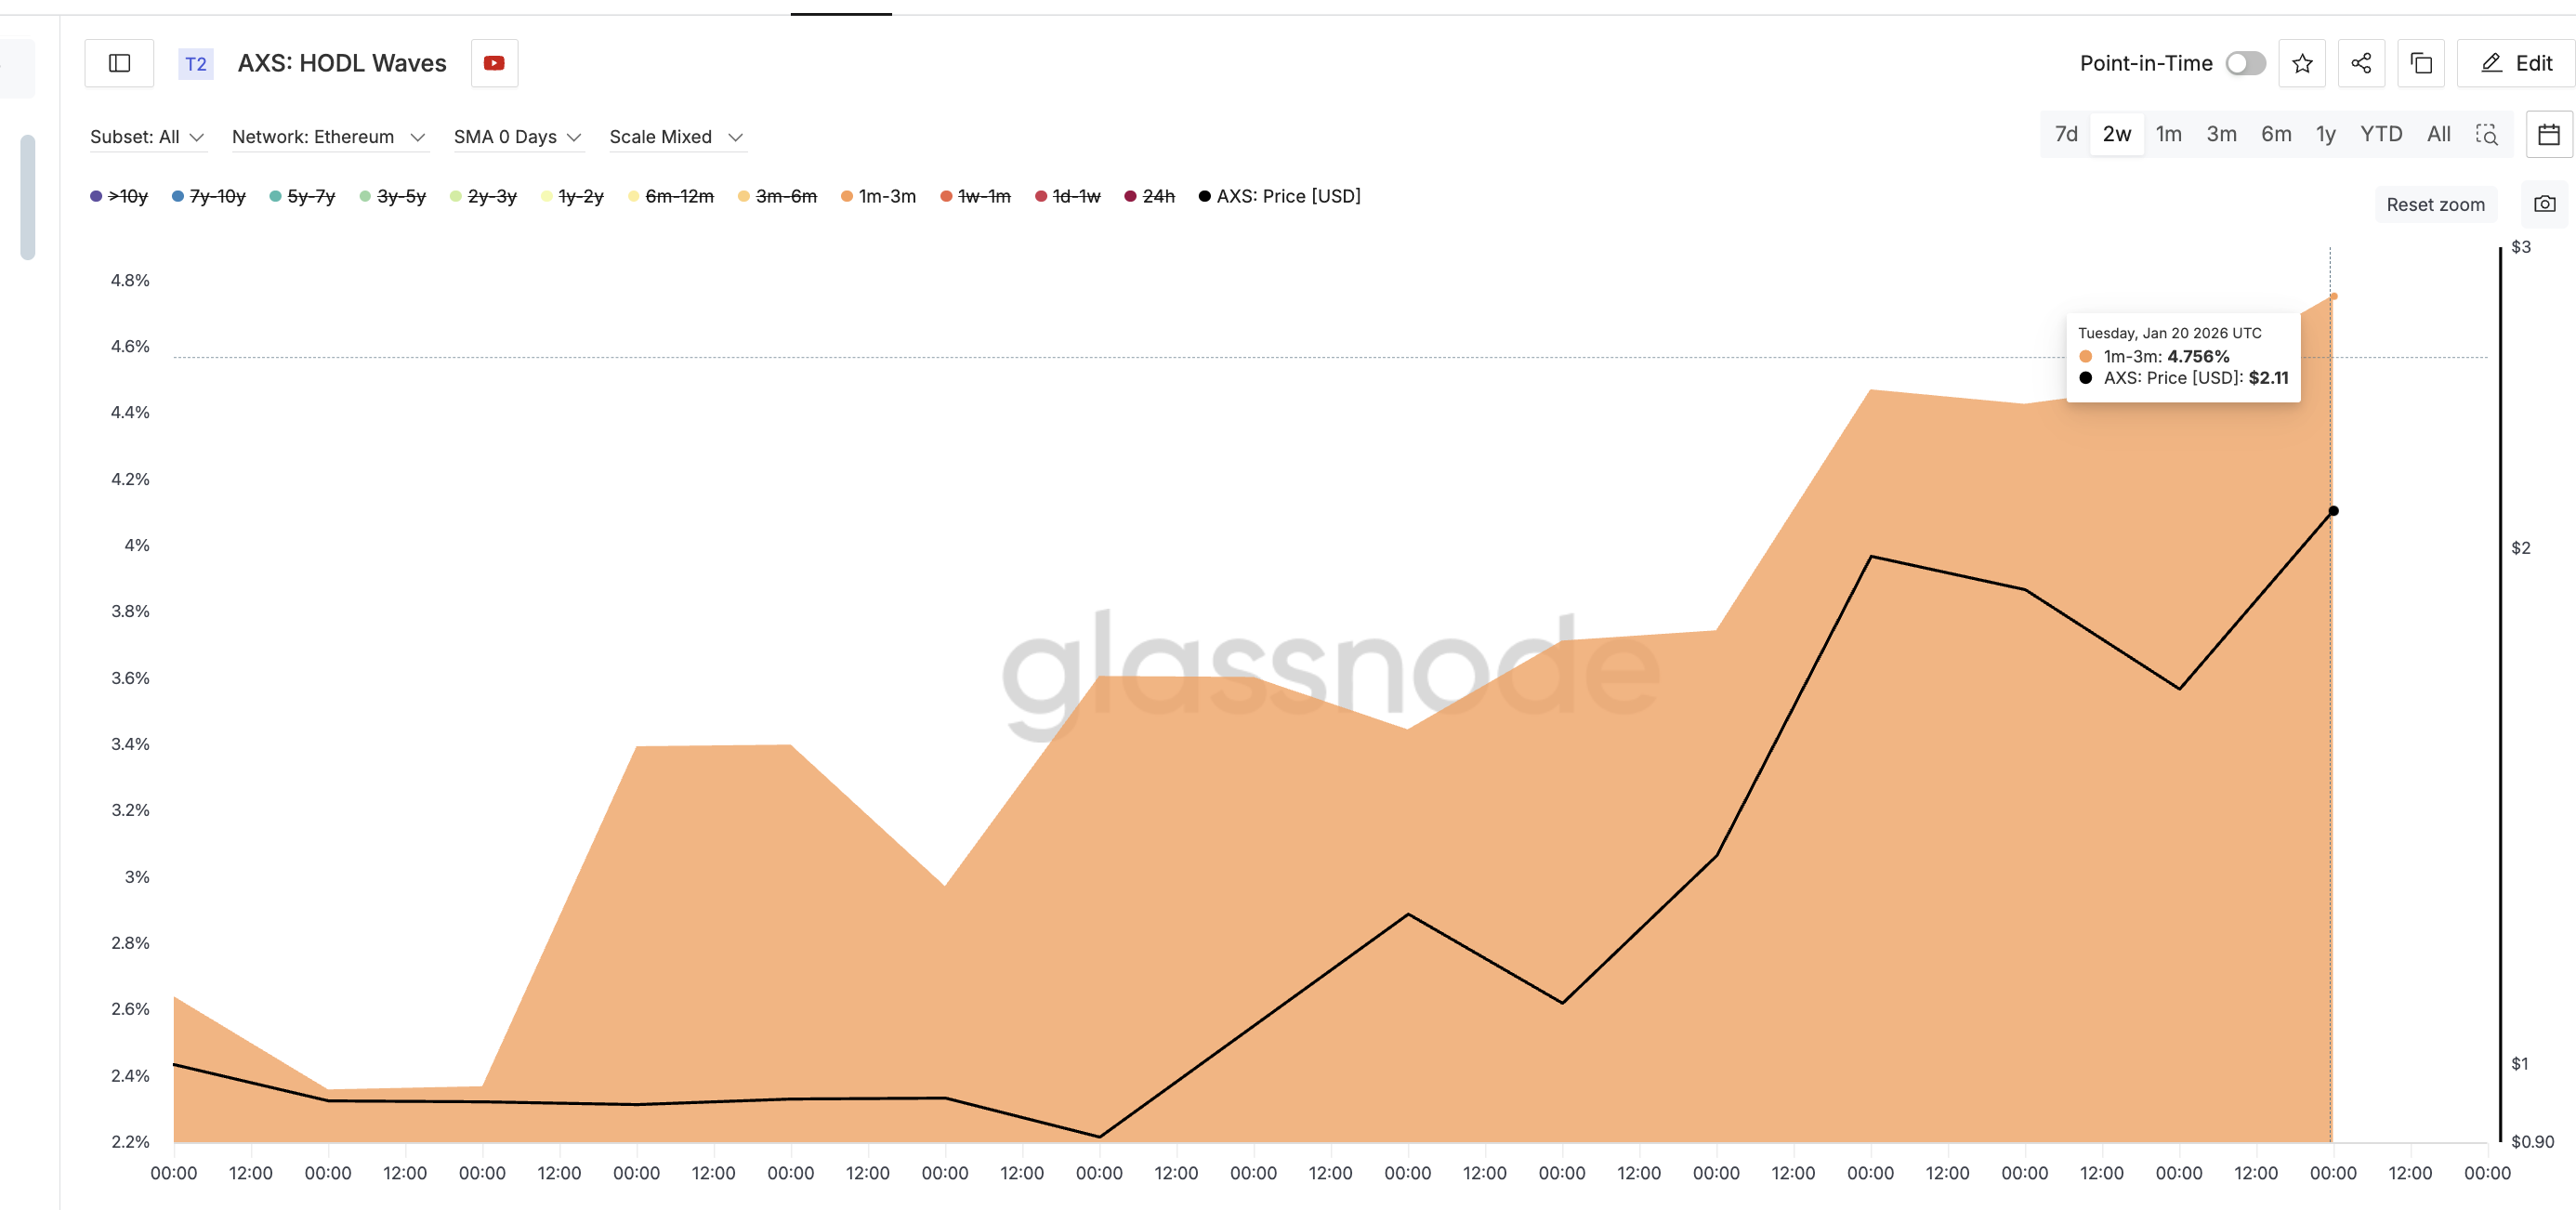 HODL Waves: Glassnode
This is the classic exit-liquidity structure. Long-term holders and whales sell as losses shrink, while short-term traders buy, expecting a fast continuation.
Cost Basis And AXS Price Levels Show Where Exit Liquidity Turns Risky
Cost basis data shows where this GameFi setup holds or breaks.
The most important near-term support sits at $2.17–$2.20, a level also on the price chart. Roughly 1.99 million AXS were accumulated in this range. As long as price holds above it, pullbacks remain corrective.
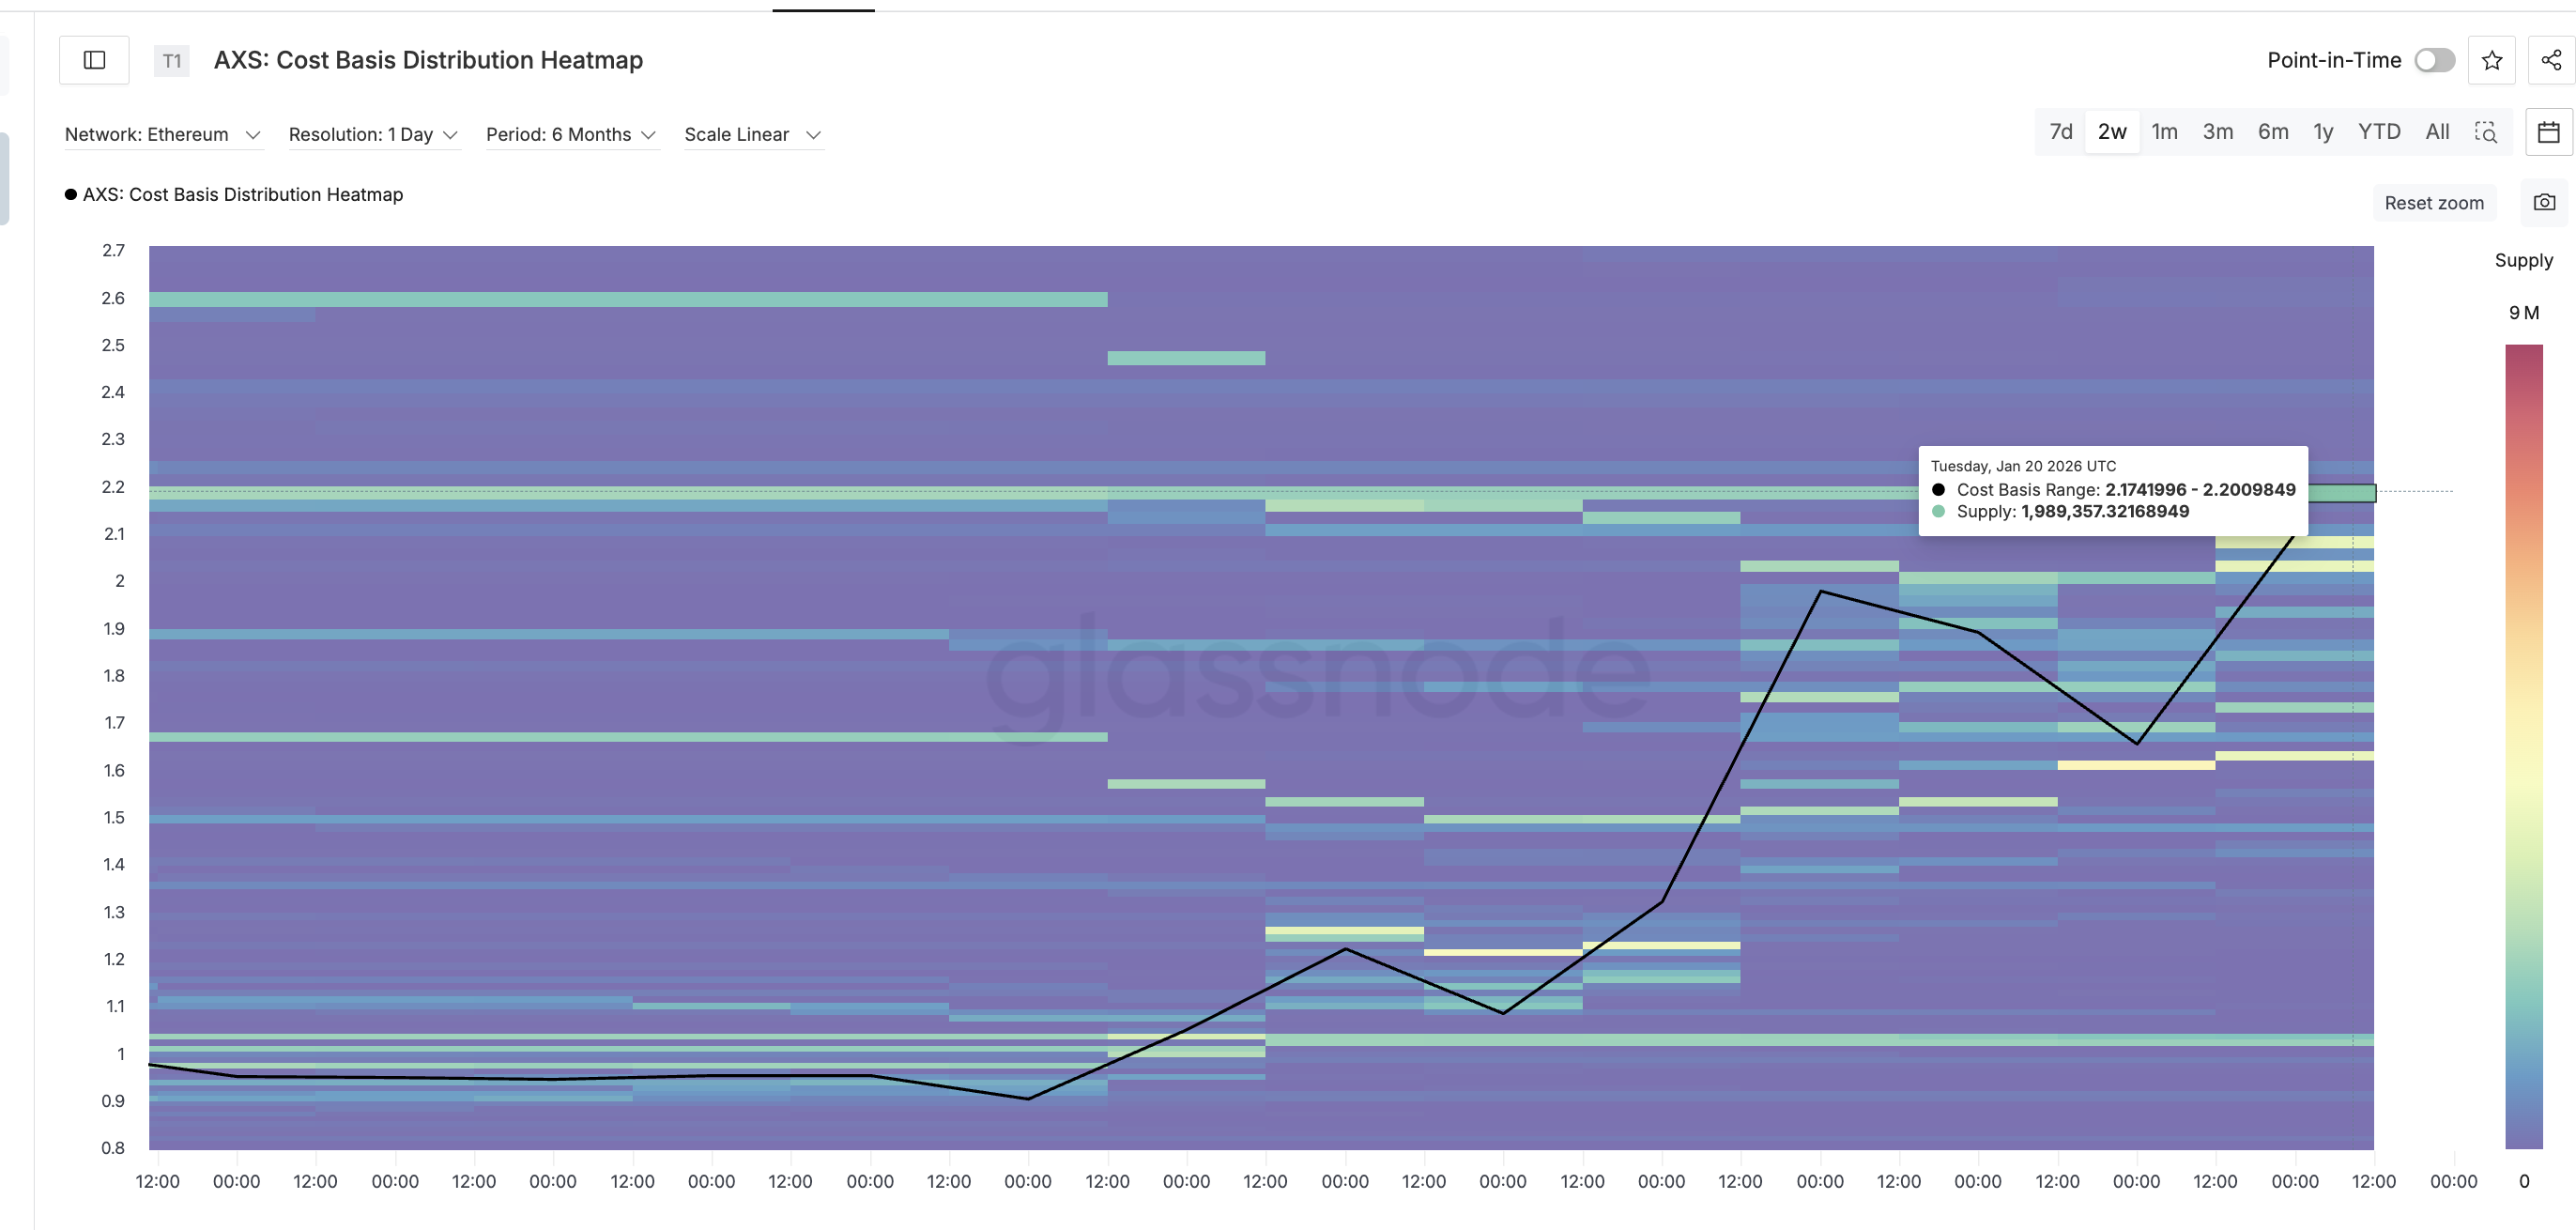 Key AXS Price Clusters: Glassnode
Below that, the strongest structural support lies at $1.62–$1.64, where about 3.50 million AXS were accumulated. A break below $1.63, a level on the price chart, would signal that short-term buyers are trapped and the breakout structure is failing.
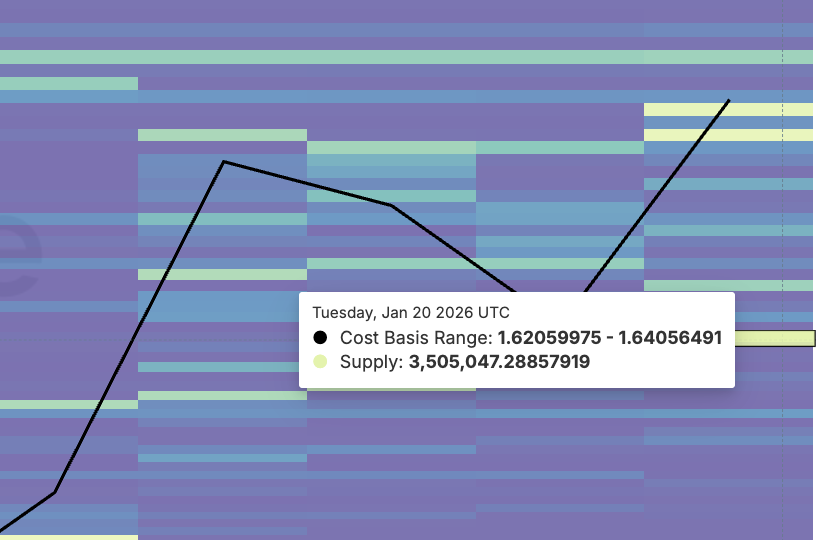 Strongest Support If Price Corrects: Glassnode
On the upside, bulls need a clean daily close above $2.54, roughly 6% above current levels, to reopen the path toward $2.72 and potentially $3.01.
 AXS Price Analysis: TradingView
Until that happens, upside moves are likely to meet selling pressure rather than acceleration.
Recommended Articles


