


Zcash’s 34% Breakdown Triggered — Why It Could All Be A Setup To Trap The Bears
Zcash has officially confirmed a bearish breakdown. The price lost a major long-term trendline and activated a technical pattern that points to a potential 34% downside move. Under normal conditions, that kind of confirmation attracts aggressive sellers. Instead, the opposite happened. Large holders stepped in, exchange balances dropped sharply, all while the leverage positioning became heavily skewed to the short side, with bears expecting more downside.
That combination rarely appears during clean breakdown moves. It usually appears when the market is setting up to punish one side of the trade.
A Confirmed Breakdown After Losing a Critical Trend Level
From a technical perspective, the breakdown is real.
Zcash is still down roughly 55% from its early November peak near $745. More importantly, the ZEC price has now lost the 100-day exponential moving average (EMA). An EMA is a trend indicator that gives more weight to recent prices, making it useful for spotting shifts in market direction.
This level mattered before. In early December, Zcash briefly dipped below the 100-day EMA, then reclaimed it the next day. That reclaim triggered a sharp 71% rally. This time, the level has not been reclaimed yet, keeping the broader trend pressure bearish.
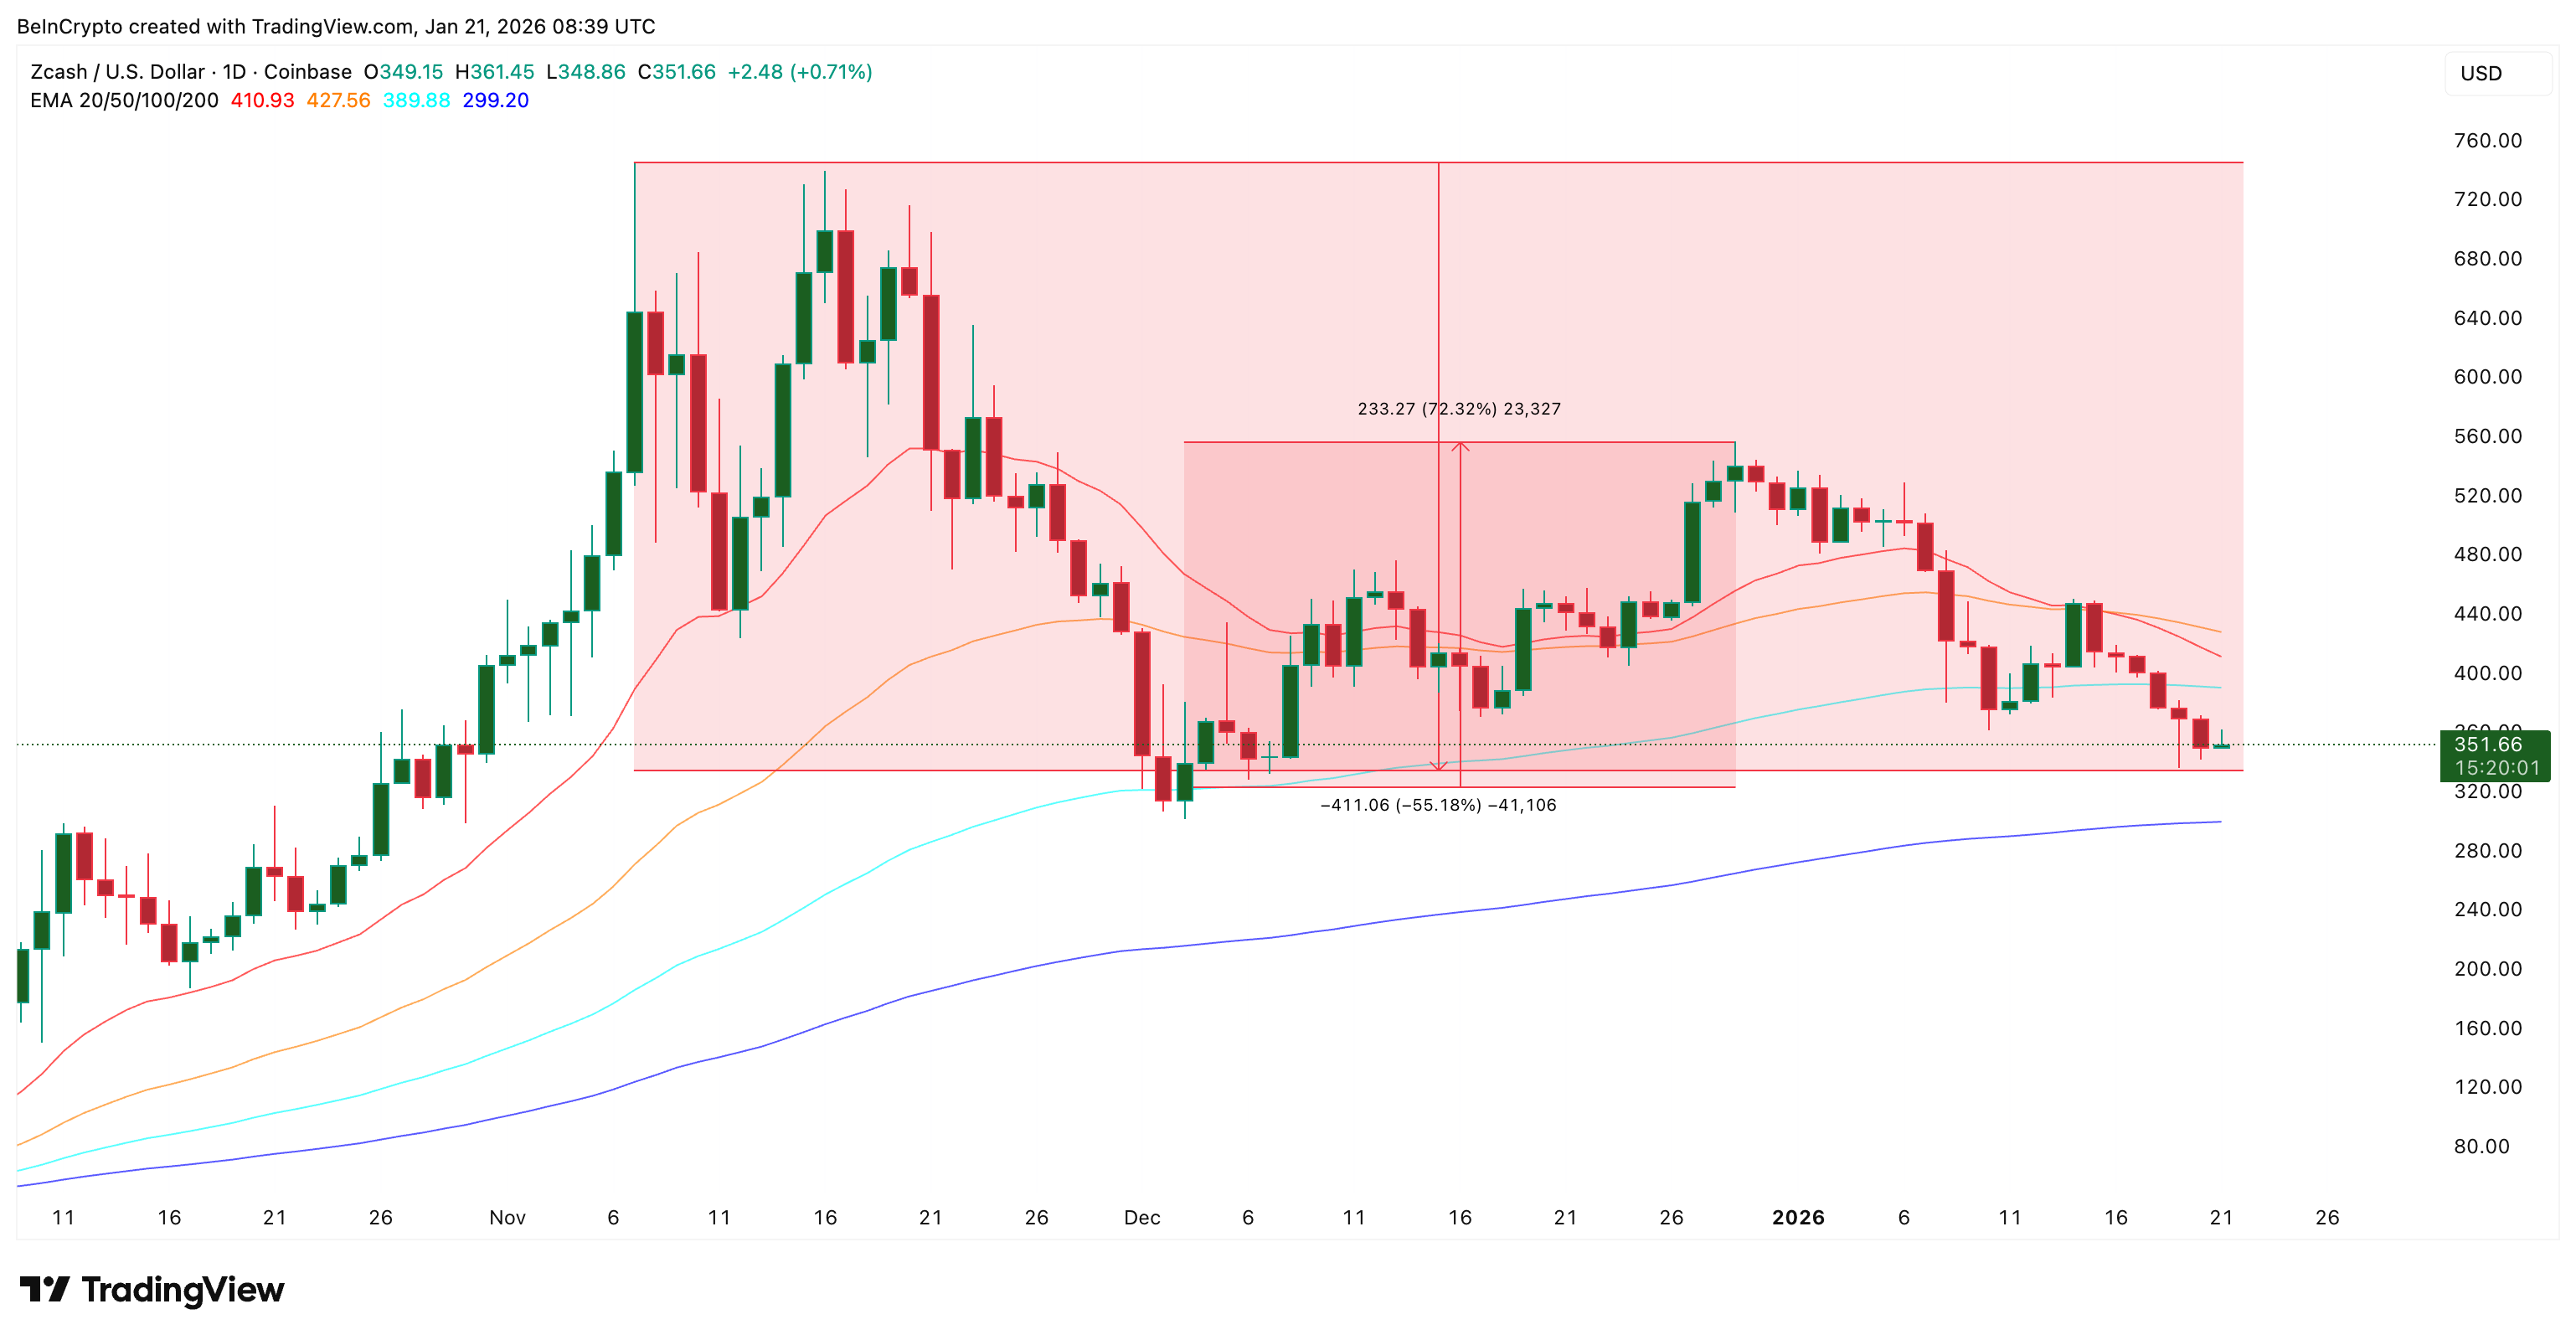 Zcash Price History: TradingView
Want more token insights like this? Sign up for Editor Harsh Notariya’s Daily Crypto Newsletter here.
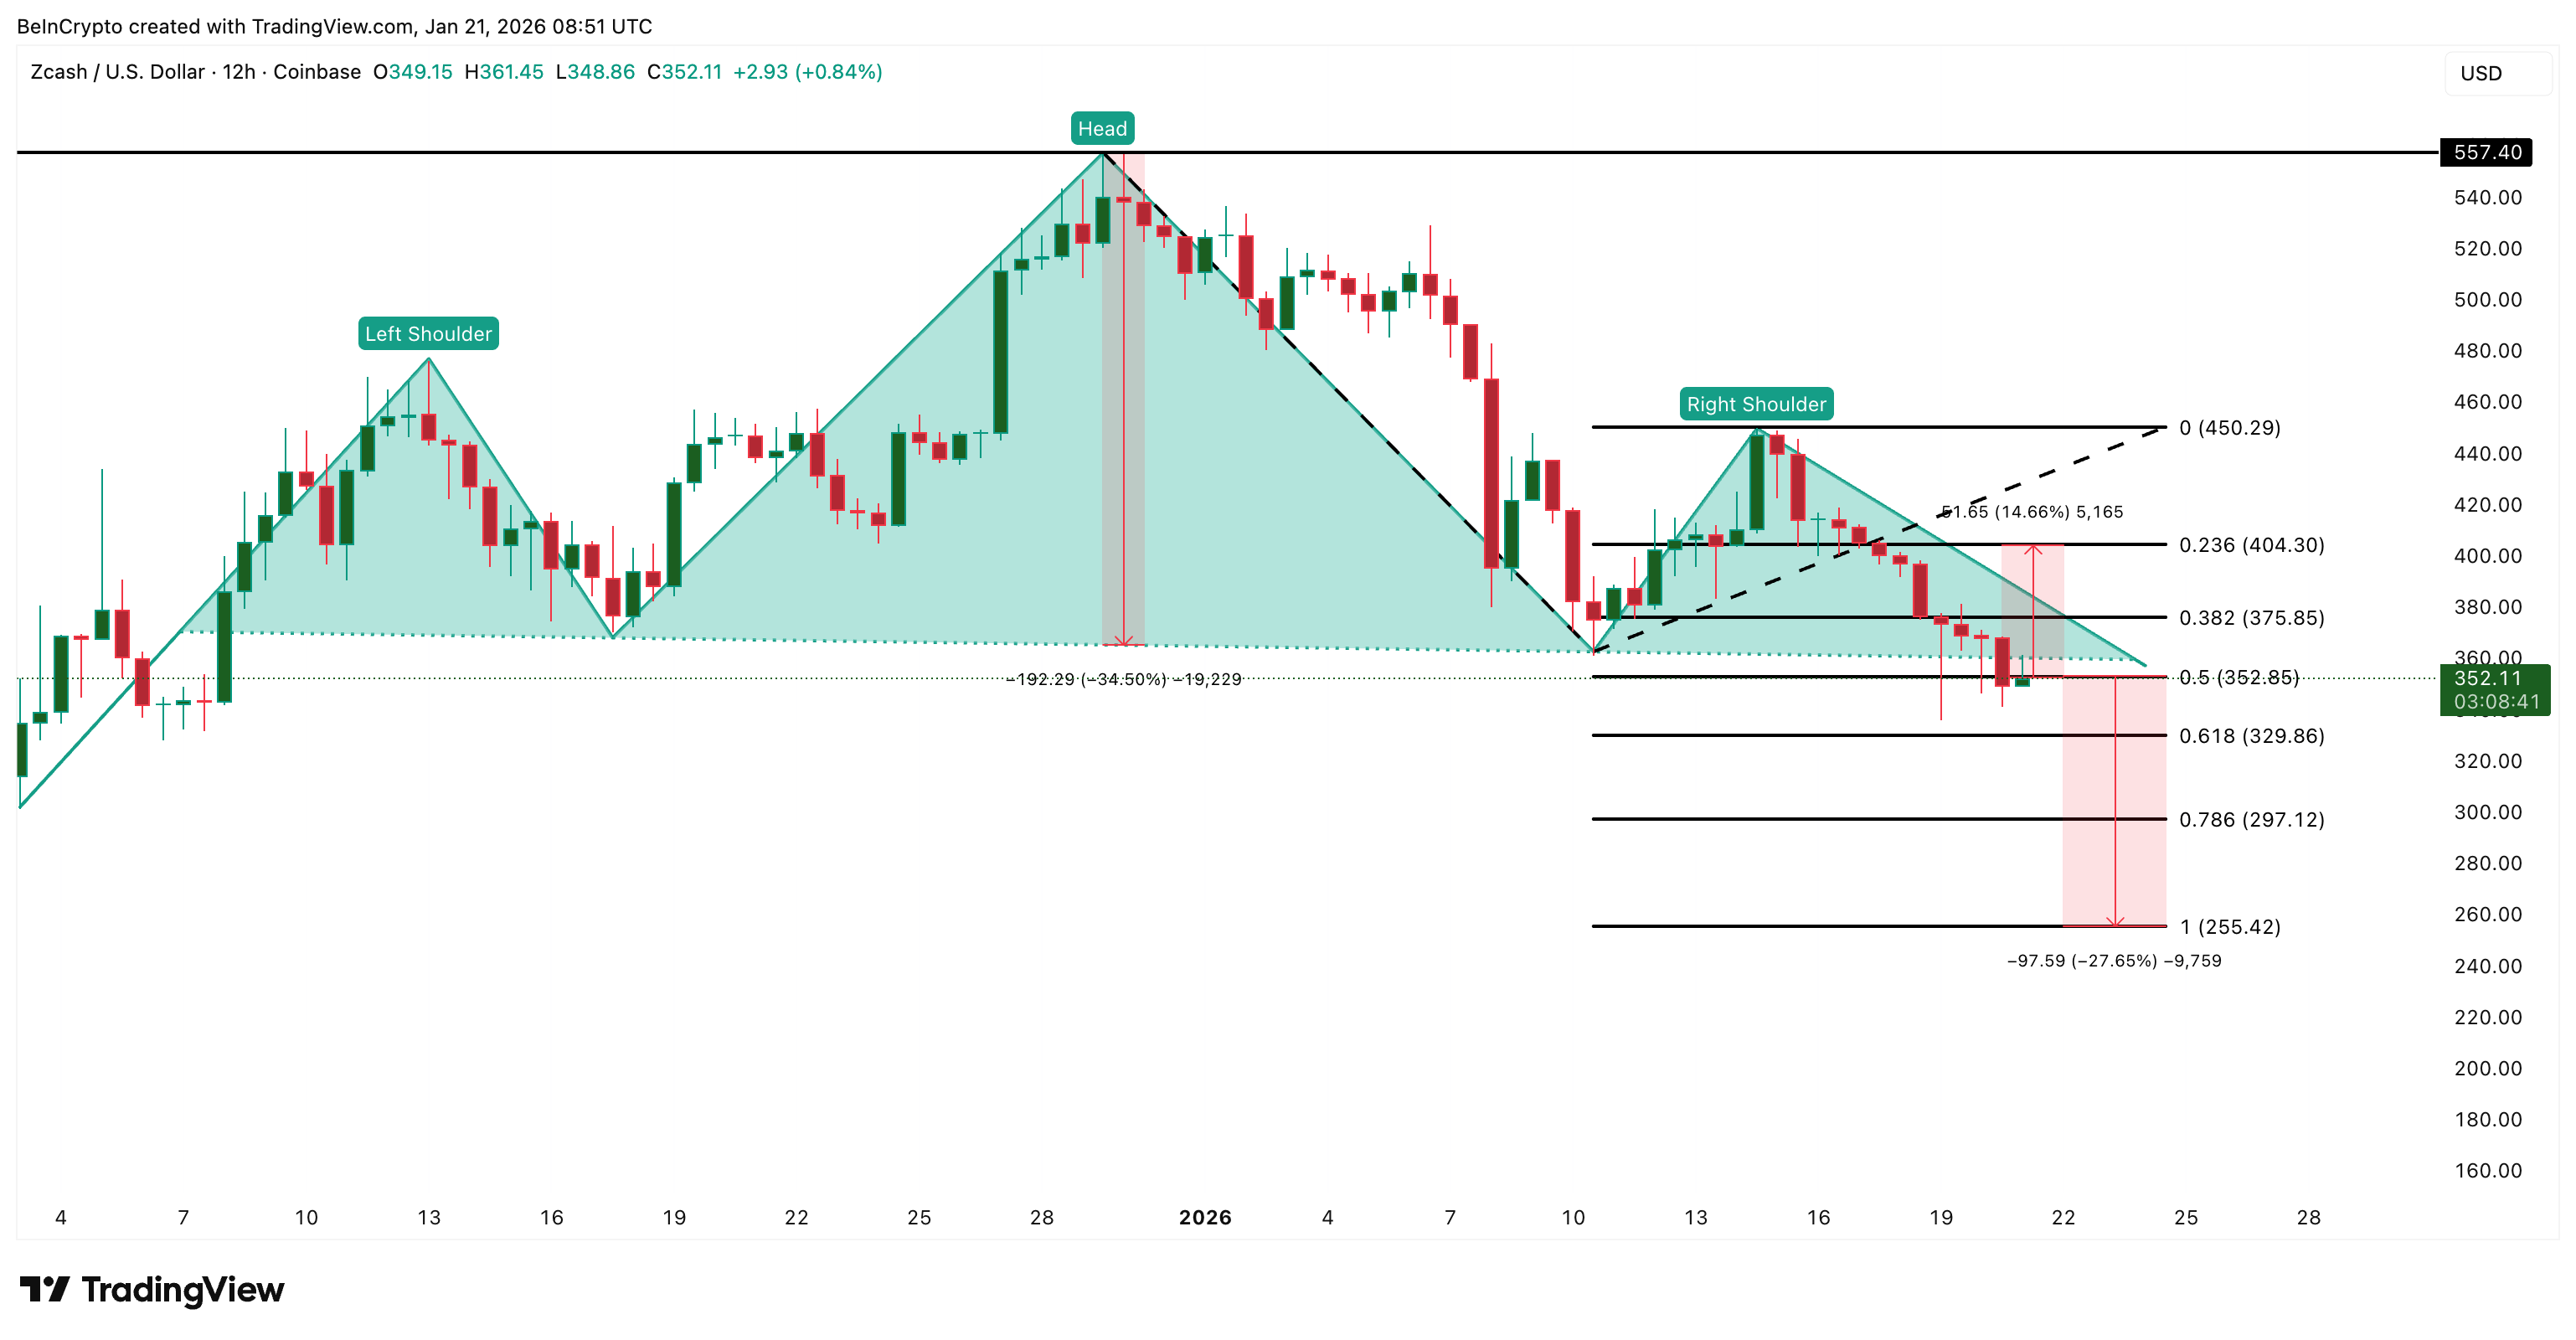
On the 12-hour chart, Zcash also confirmed a head-and-shoulders breakdown on January 20. This is a reversal pattern that forms after an uptrend and typically signals a deeper move lower once the neckline breaks. The measured downside from this structure points to a roughly 34% decline, which is now supposedly active.
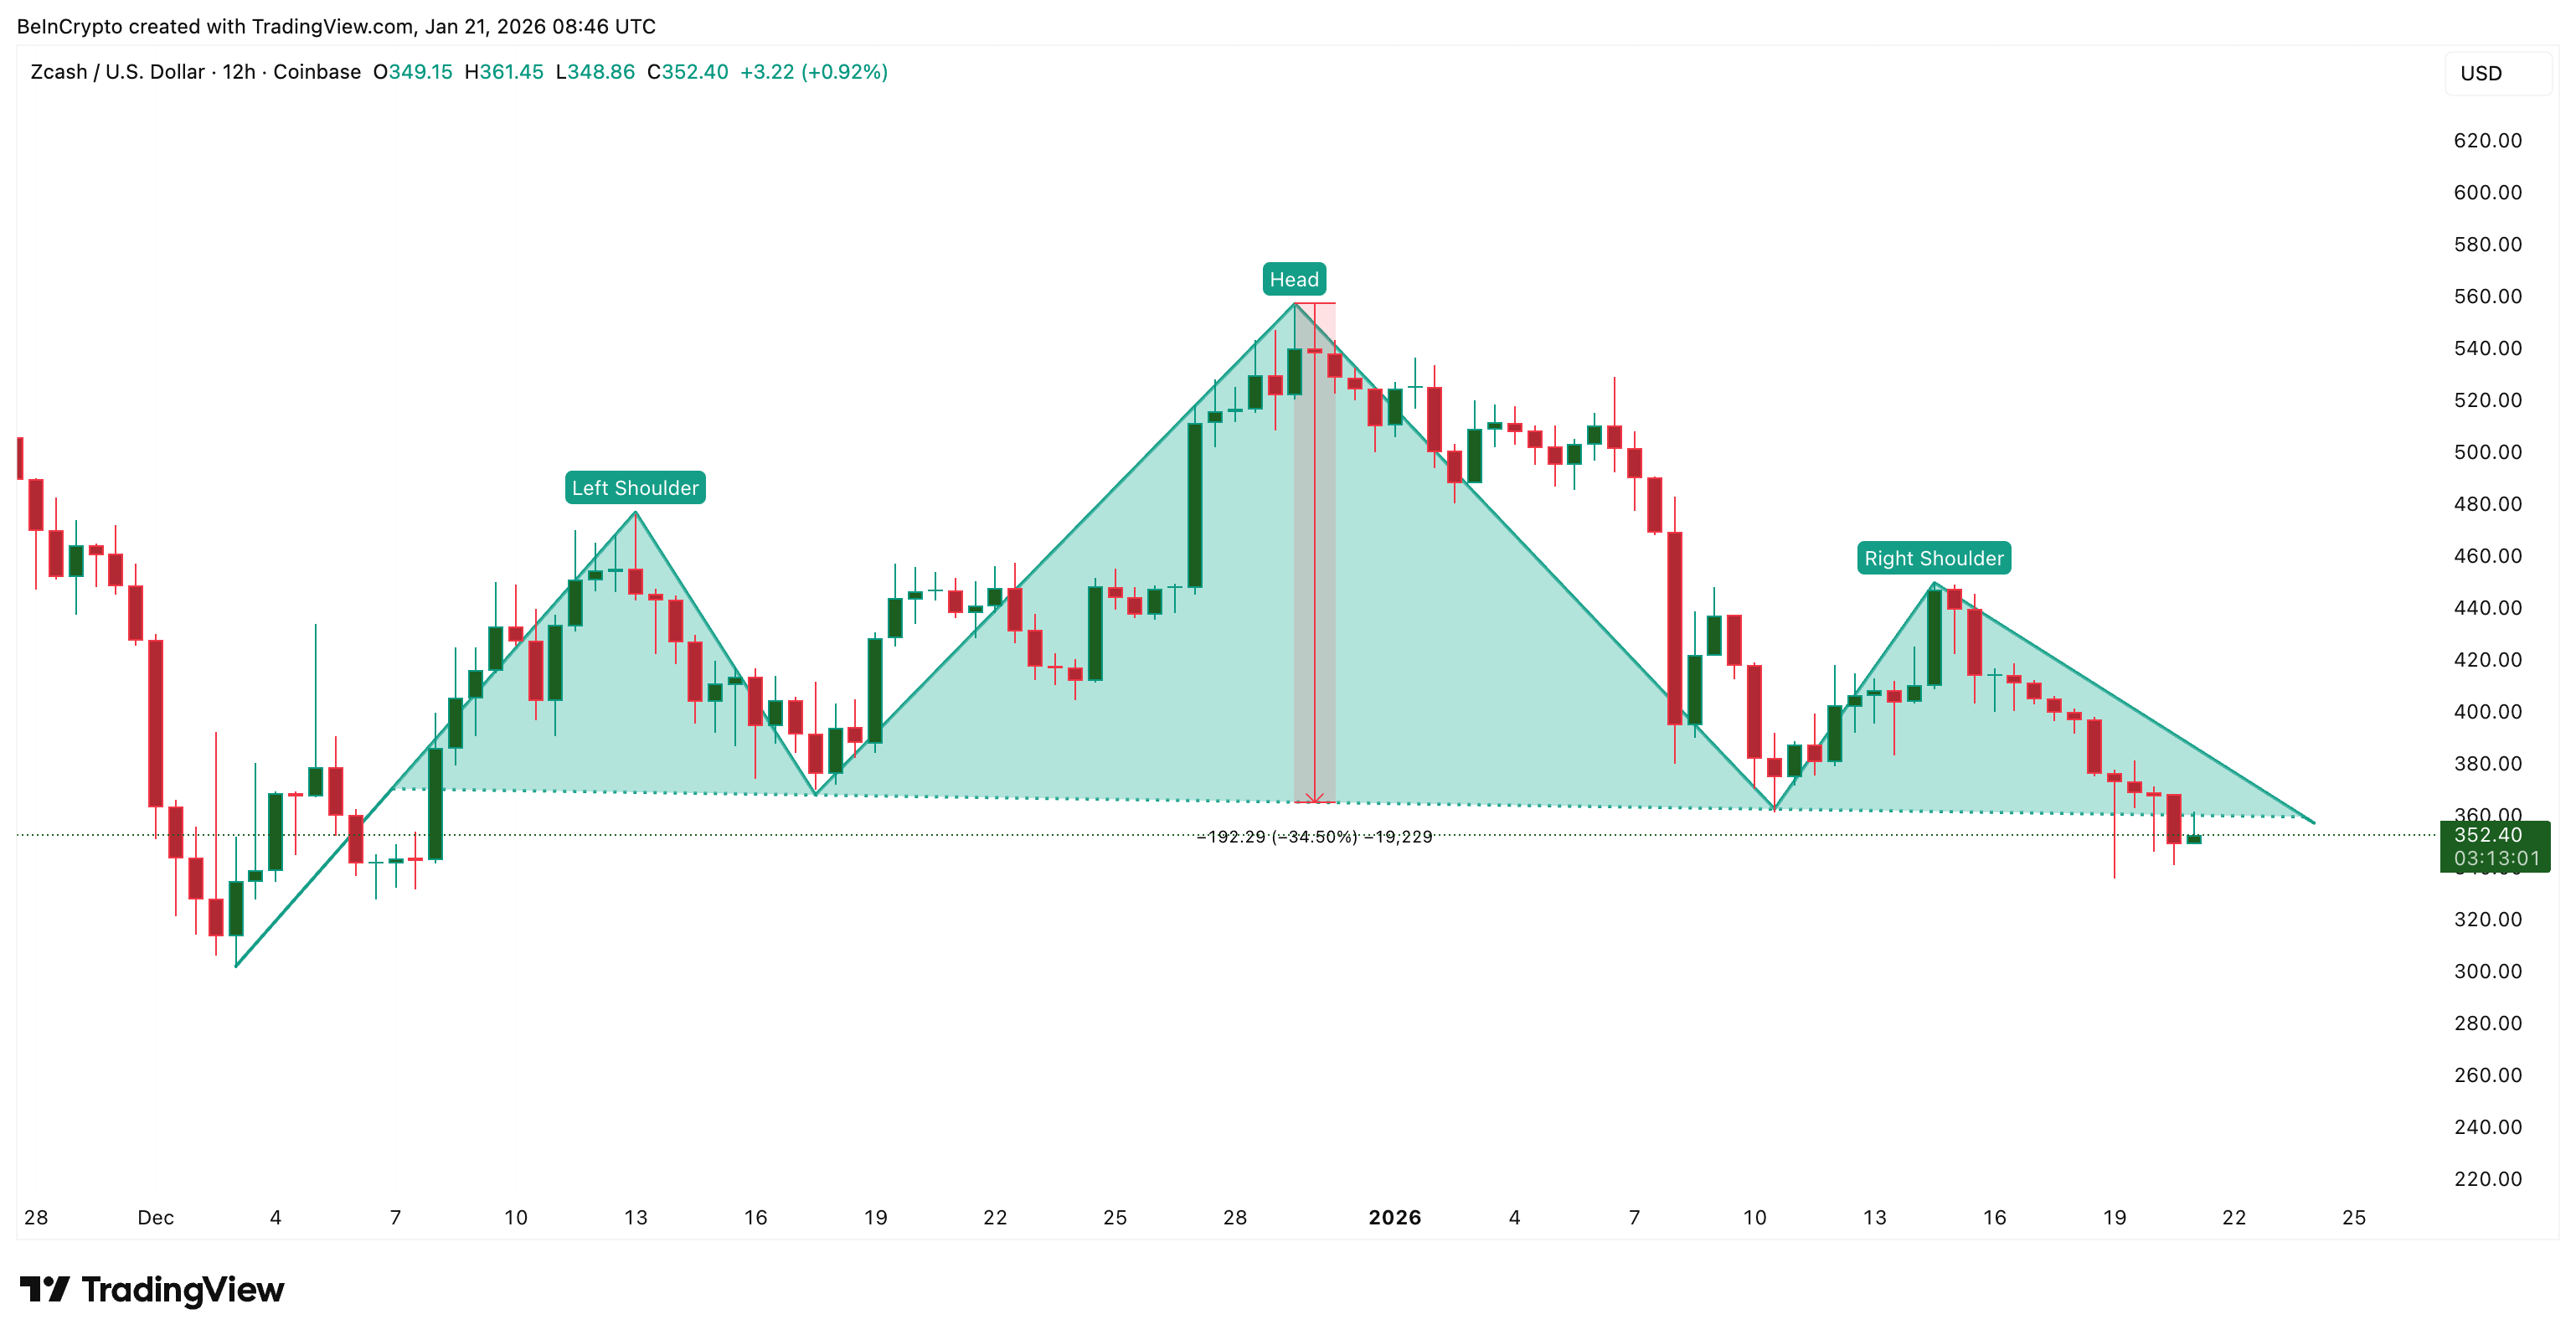 Key Breakdown: TradingView
Technically, bears have what they want. The reaction afterward is what makes this setup unusual.
Buying Appears After Weakness, Not Before It — But Why
On-chain data explains why the breakdown response matters.
Exchange balance tracks how many coins are held on trading platforms. Rising balances usually suggest selling pressure, while falling balances suggest coins are being moved into private wallets for holding.
During the breakdown itself, exchange balances rose, showing active selling. That fits the bearish narrative.
Then the behavior flipped.
Over the next 24 hours, exchange balances dropped by roughly 17%. At the same time, large holders increased exposure. Whale wallets added about 2.44% to their holdings, while the top 100 addresses (mega whales) expanded their positions by nearly 4%.
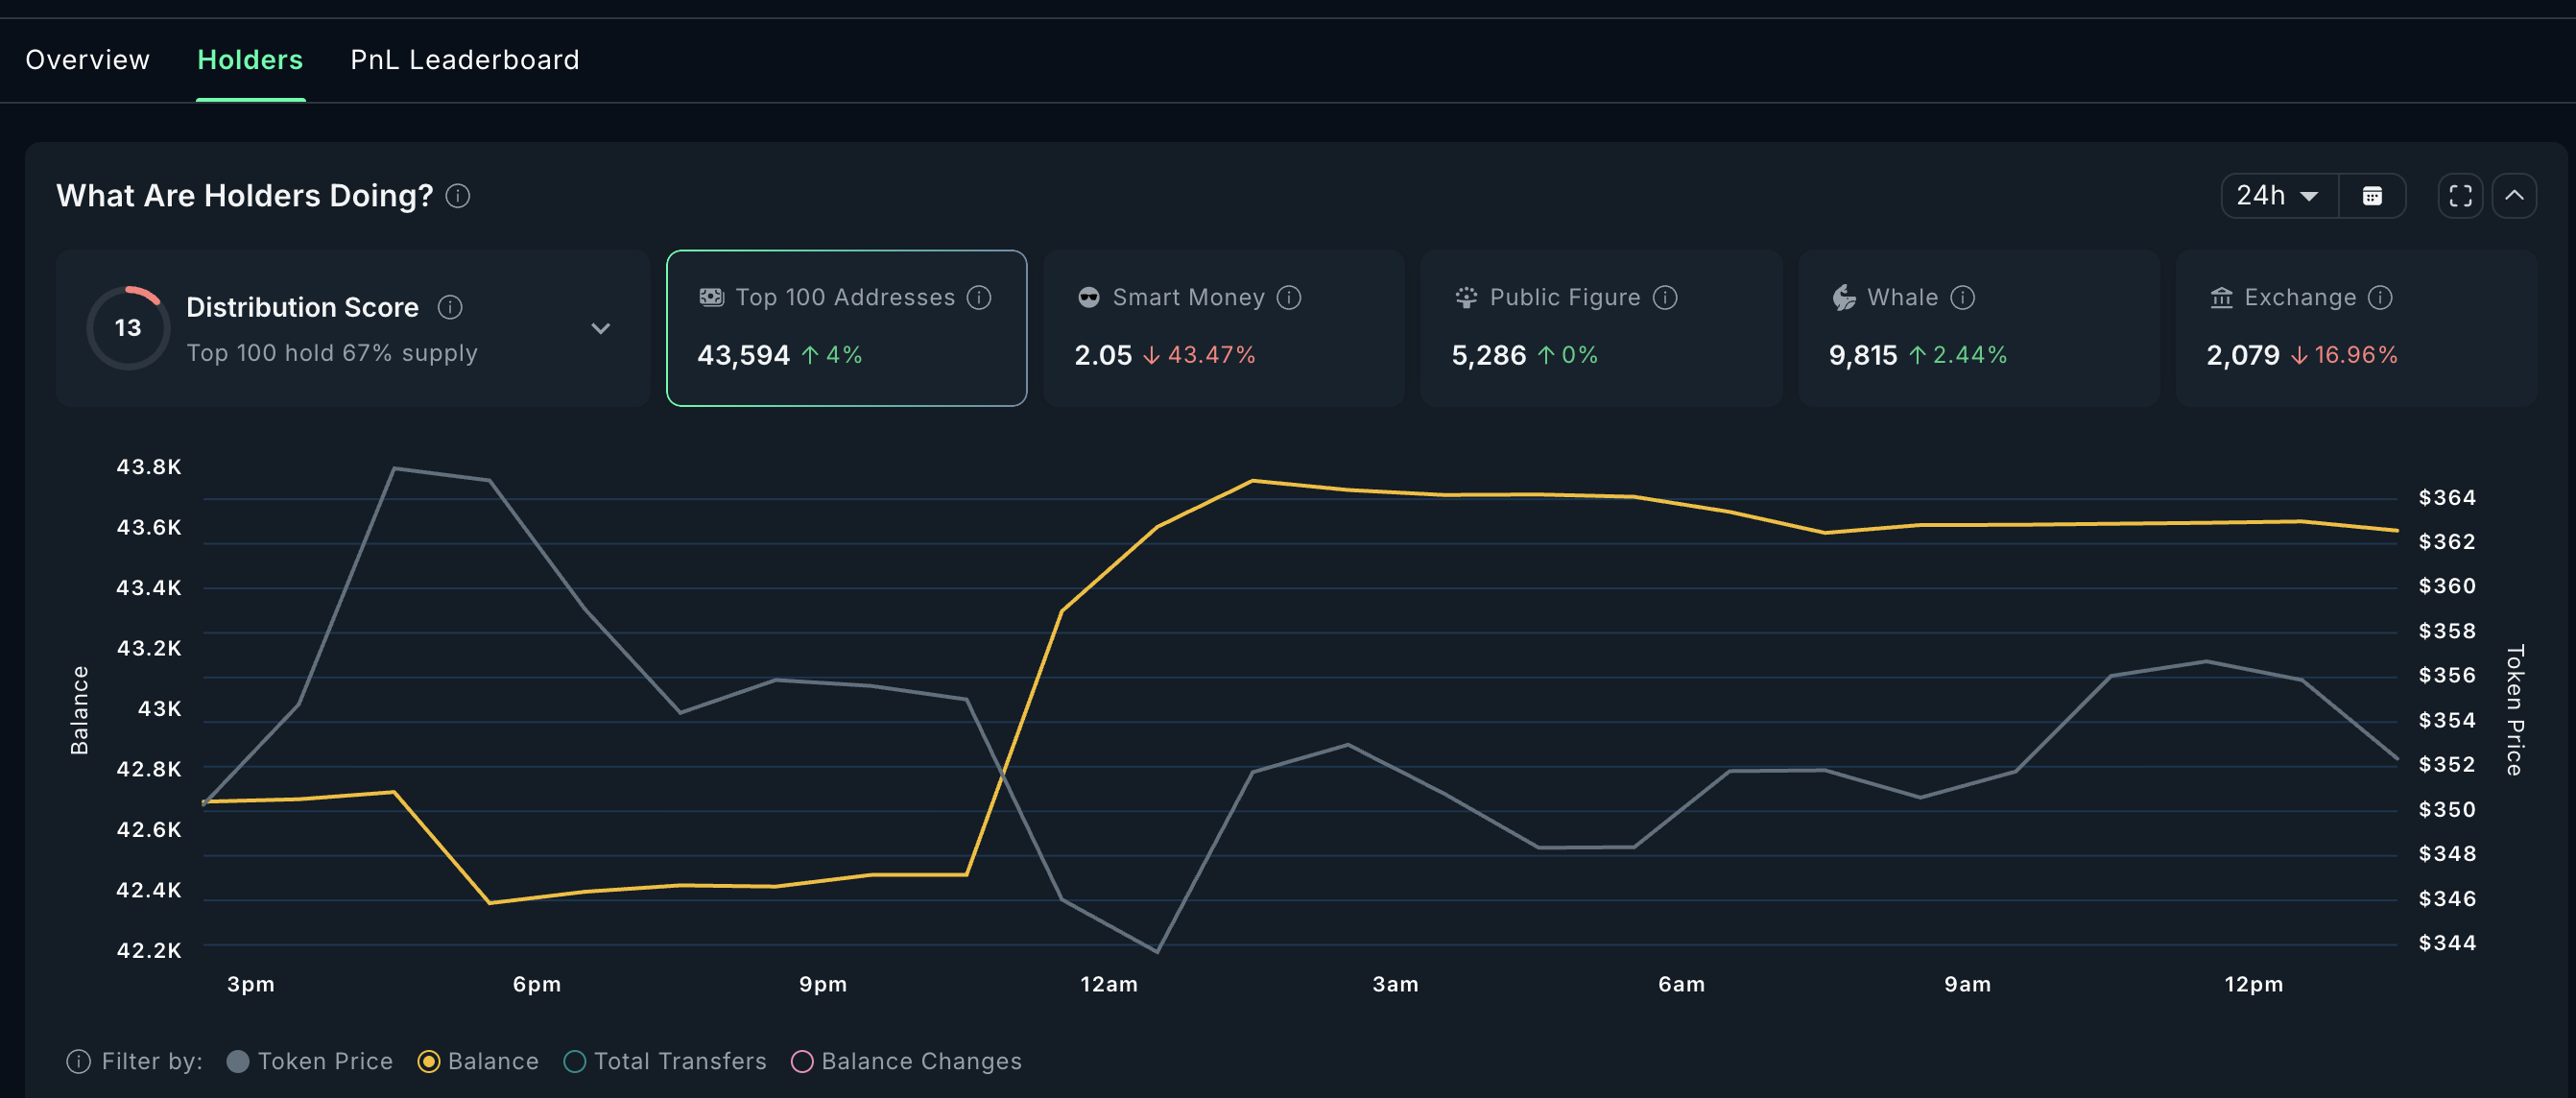 Zcash Buyers: Nansen
This is accumulation after confirmation, not speculative dip buying ahead of it.
When large holders buy into confirmed weakness, they are usually positioning for either a fast reclaim of key levels or a volatility event driven by forced liquidations. Derivatives data strongly supports the second scenario.
Short Positioning Creates the Conditions for a Squeeze With Key Zcash Price Levels In Focus
The liquidation map shows where leveraged traders would be lose out if the price moves against them.
Liquidation levels represent price zones where traders using leverage would be automatically closed by exchanges. When many positions cluster on one side, price moves toward those levels can accelerate quickly.
For Zcash, short liquidation exposure over the coming days sits near $15.4 million, while long liquidation exposure is closer to $7.8 million. That means the market is heavily tilted toward short bets, nearly a 2:1 short bias.
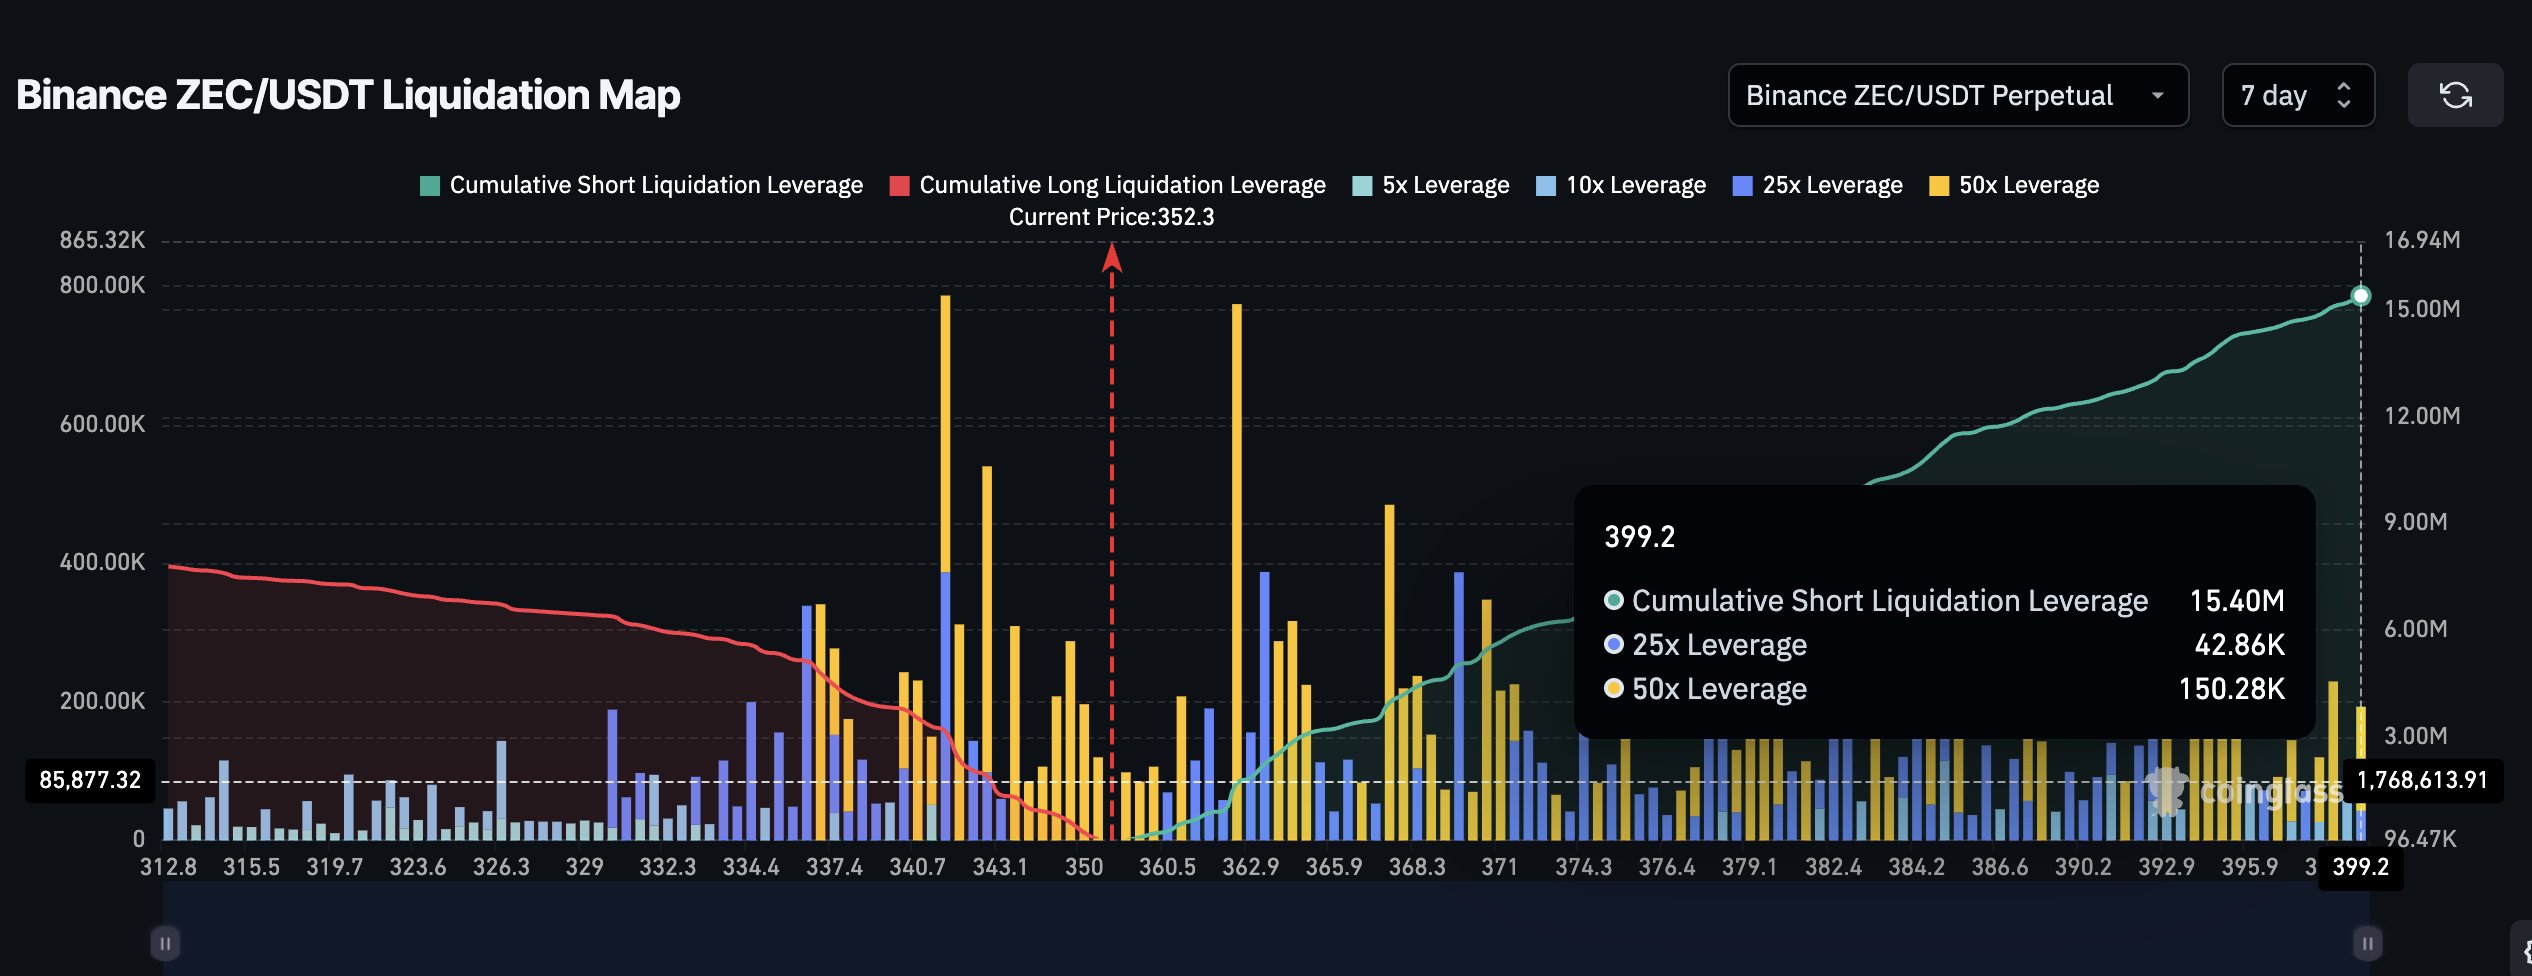 Liquidation Map: Coinglass
This imbalance matters. Zcash does not need a trend reversal to cause damage. Even a moderate bounce can begin liquidating short positions, forcing buy orders that push the price higher.
A move into the $375 to $400 range would trigger most short positions, trapping the bearish side of the market. A push above $450 materially weakens the bearish structure. Also, if the ZEC price manages to reclaim the 100-day EMA, history shows upside can expand rapidly rather than stabilize slowly.
 Zcash Price Analysis: TradingView
The trap theory fails if the price continues lower. A sustained break below $329 on the 12-hour timeframe keeps the 34% downside path intact and opens the door toward $255 and even lower.
Recommended Articles


