


Zcash Dodges a 34% Crash as Dip Buyers Step In — Clean Save or Temporary Pause?
Zcash came close to triggering a major breakdown, but buyers stepped in at the last moment. On the 12-hour chart, a bearish pattern nearly confirmed, pointing to a deep Zcash price correction.
Instead, strong dip buying created a long lower wick, delaying the breakdown. But the bigger question is whether this was a real conviction or just a temporary defense, stalling the inevitable.
A 34% Breakdown Nearly Triggered — Until Buyers Stepped In
On the 12-hour chart, Zcash formed a clean head-and-shoulders pattern. The breakdown level sat near $359, and the price briefly traded below it. That move threatened to activate the full pattern, which projects a 34% drop.
However, the breakdown did not confirm.
Buyers stepped in aggressively, pushing the price back above support before the candle closed. The result was a long lower wick, a classic sign that demand appeared exactly where sellers expected continuation. For now, that wick represents a saved breakdown, not a reversal.
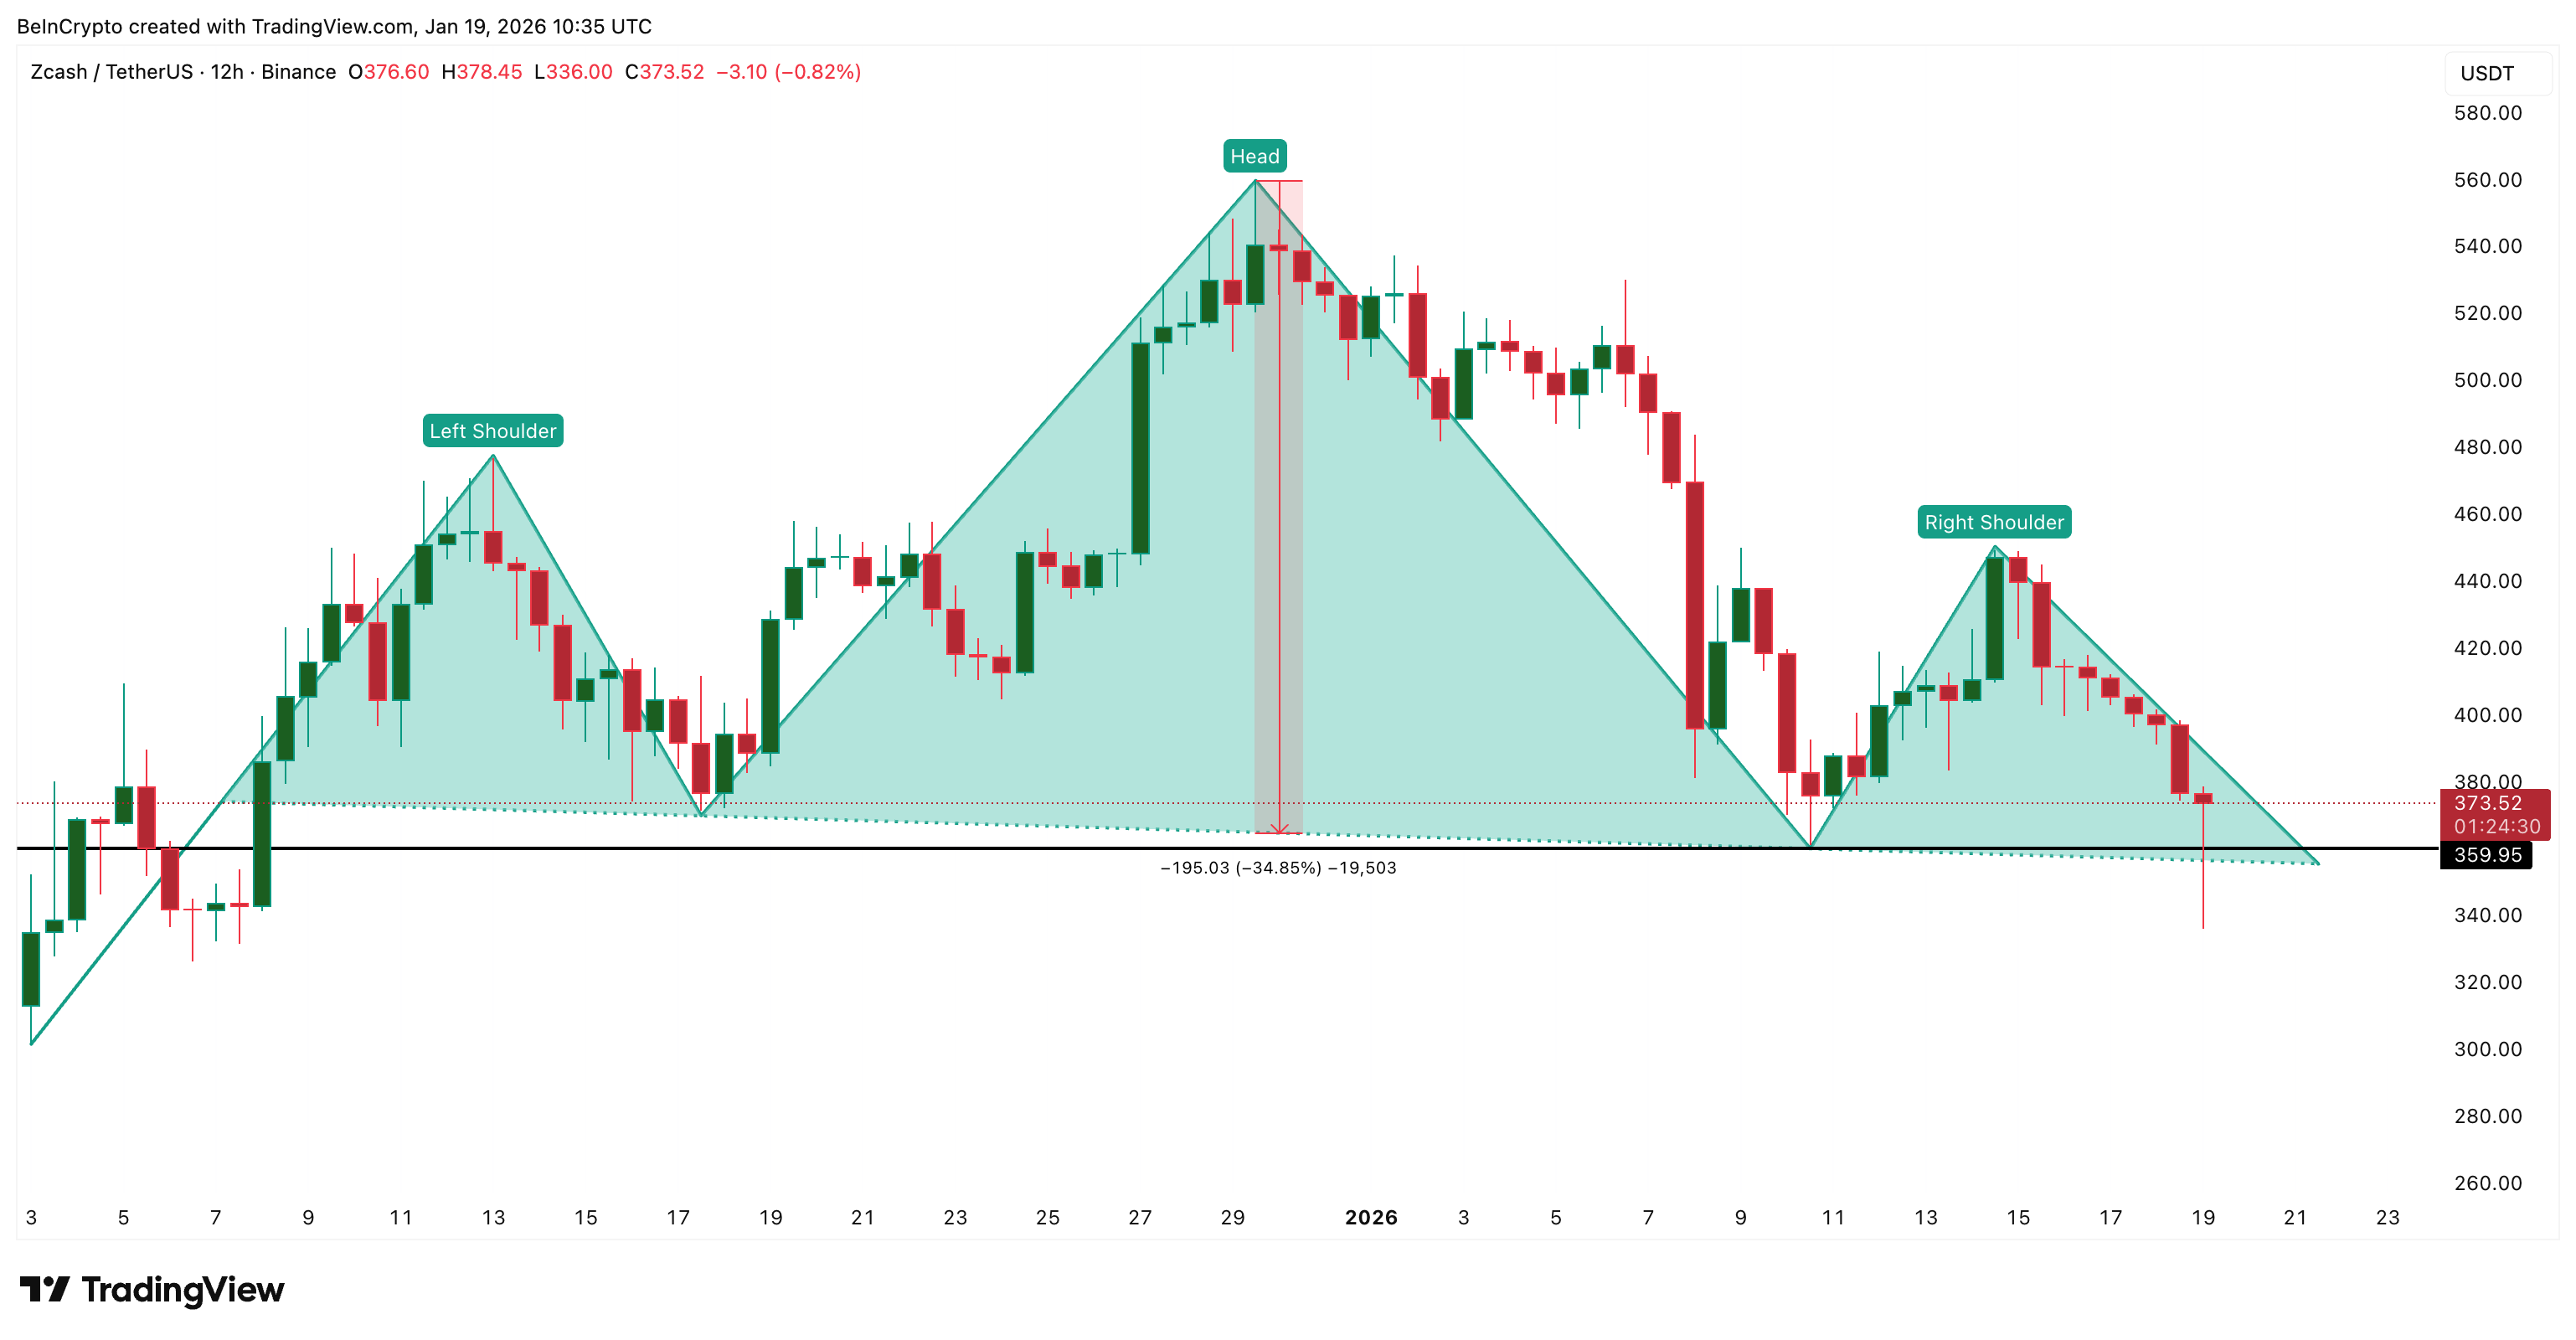 Bearish Pattern: TradingView
Want more token insights like this? Sign up for Editor Harsh Notariya’s Daily Crypto Newsletter here.
Momentum adds a small layer of support. Between January 10 and January 19, Zcash appears to be forming a lower low in price, while the RSI (Relative Strength Index), a momentum indicator, is forming a higher low. This is a standard bullish divergence on the 12-hour timeframe. It often signals a short-term bounce, especially after sharp declines.
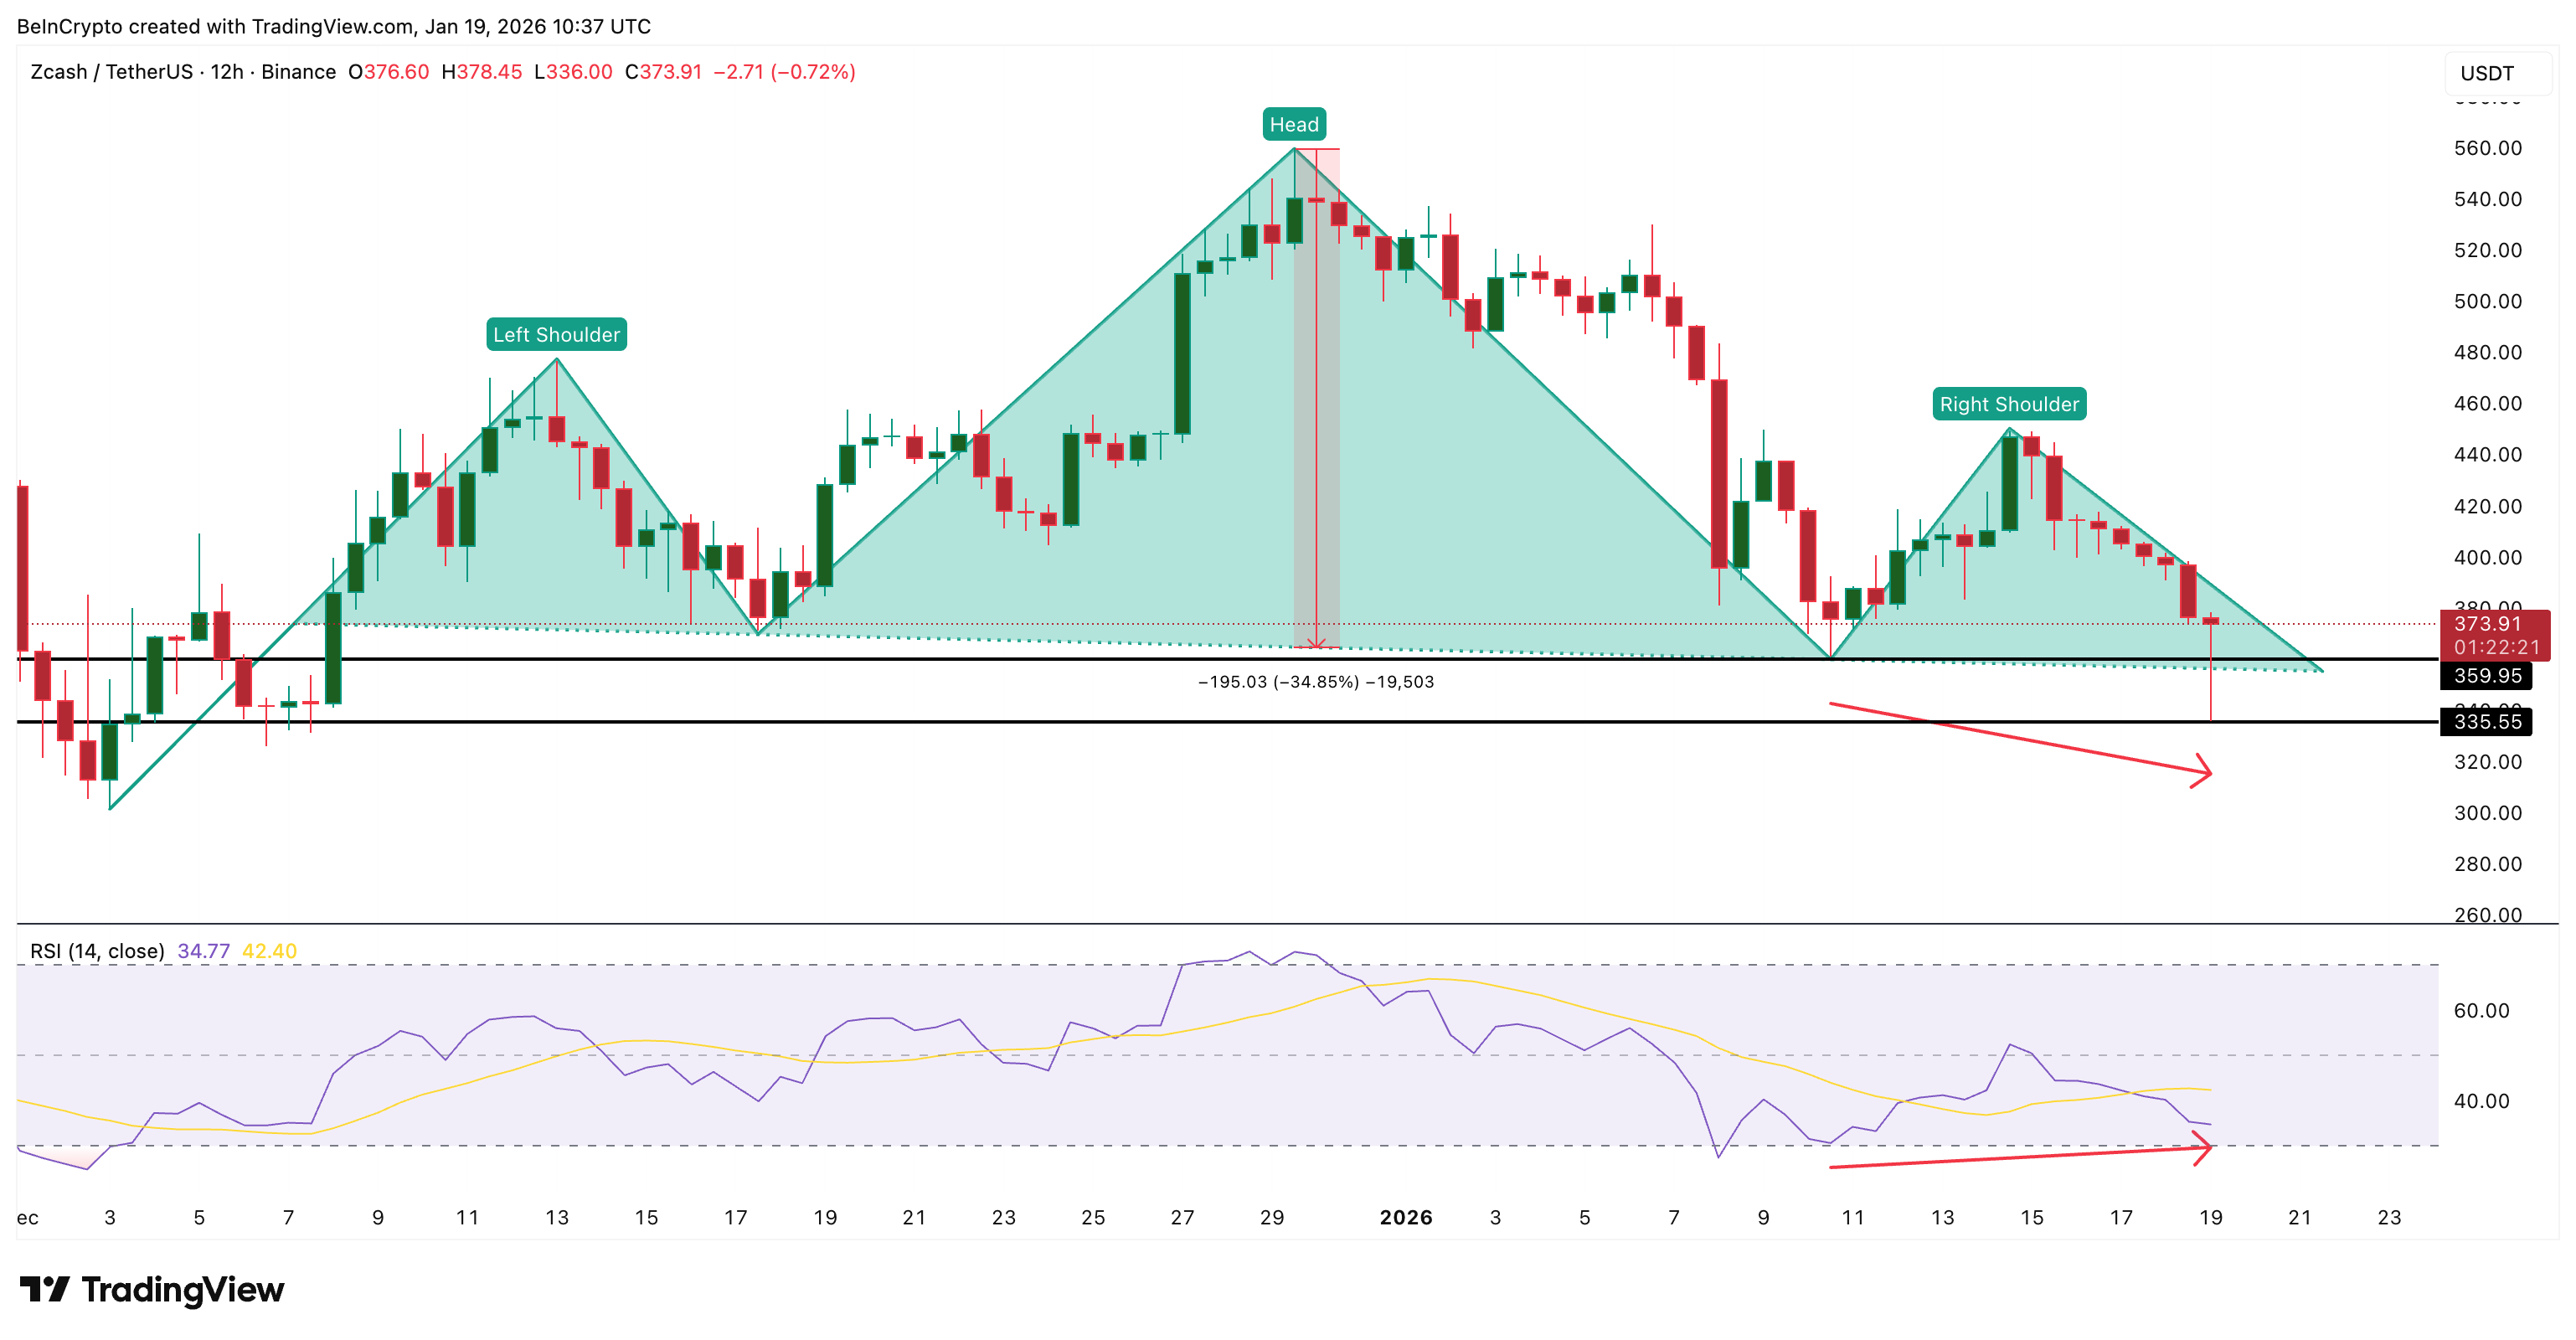 Bullish Divergence Forming: TradingView
Still, this divergence is fragile. For it to remain valid, the Zcash price must continue to hold above $335 on the 12-hour timeframe. A close below that level would weaken the signal and reopen the downside path. In short, buyers delayed the damage. They did not remove it.
Whale Buying And Spot Flows Are Slowing
Looking under the hood explains why the breakdown stalled.
Over the past seven days, whales increased their Zcash holdings by 12.65%, lifting whale-held supply to roughly 9,950 ZEC. This group provided the strongest support during the selloff. In contrast, the top 100 addresses (mega whales) did not meaningfully add, suggesting large long-term holders are still cautious.
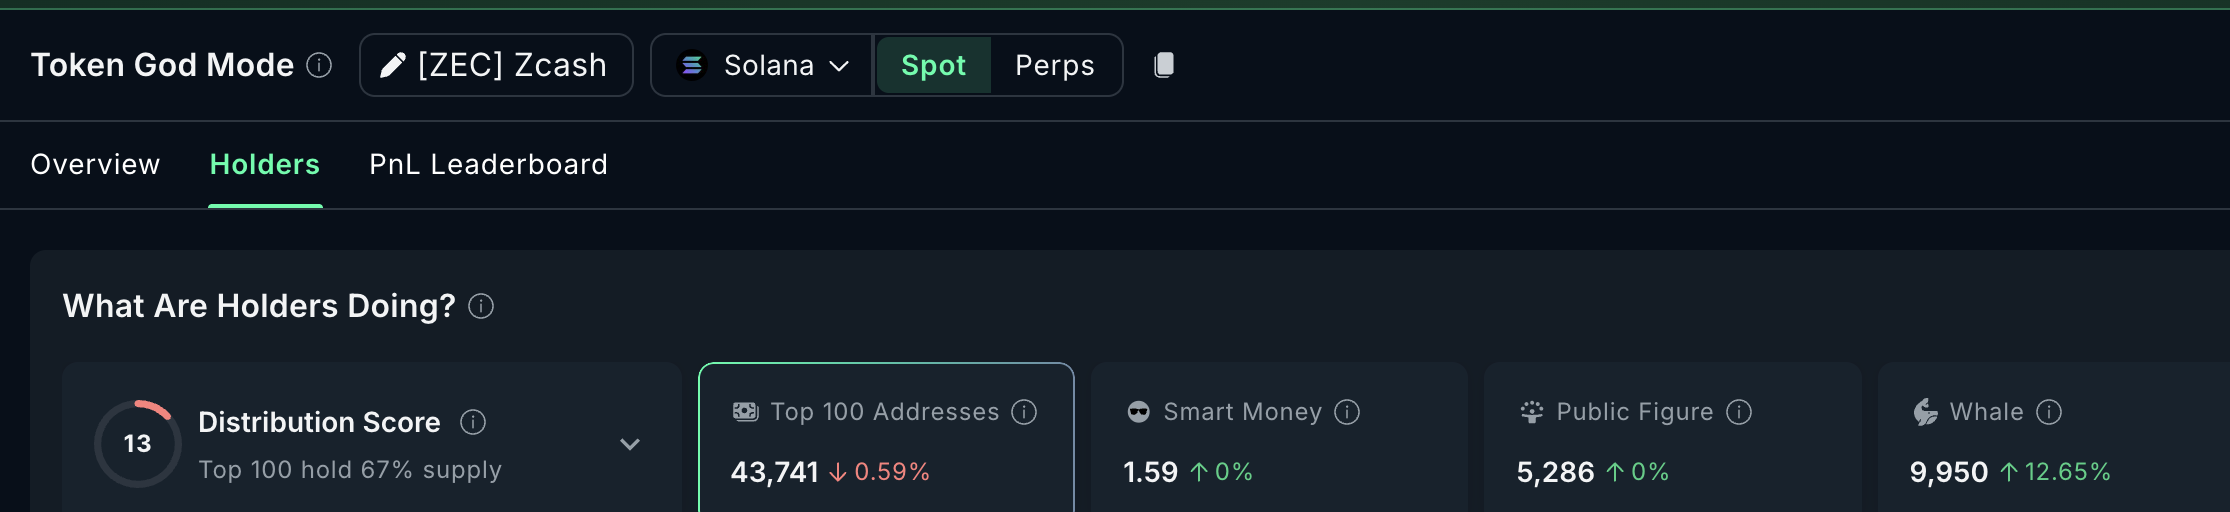 Zcash Whales: Nansen
Spot market data reinforces this idea.
In late November, Zcash saw peak daily exchange outflows near $61 million, signaling strong conviction buying. That level of demand is gone. On January 18, net outflows measured $15.7 million. By January 19, that figure dropped sharply to $7.68 million. This is an 87% decline from peak accumulation levels.
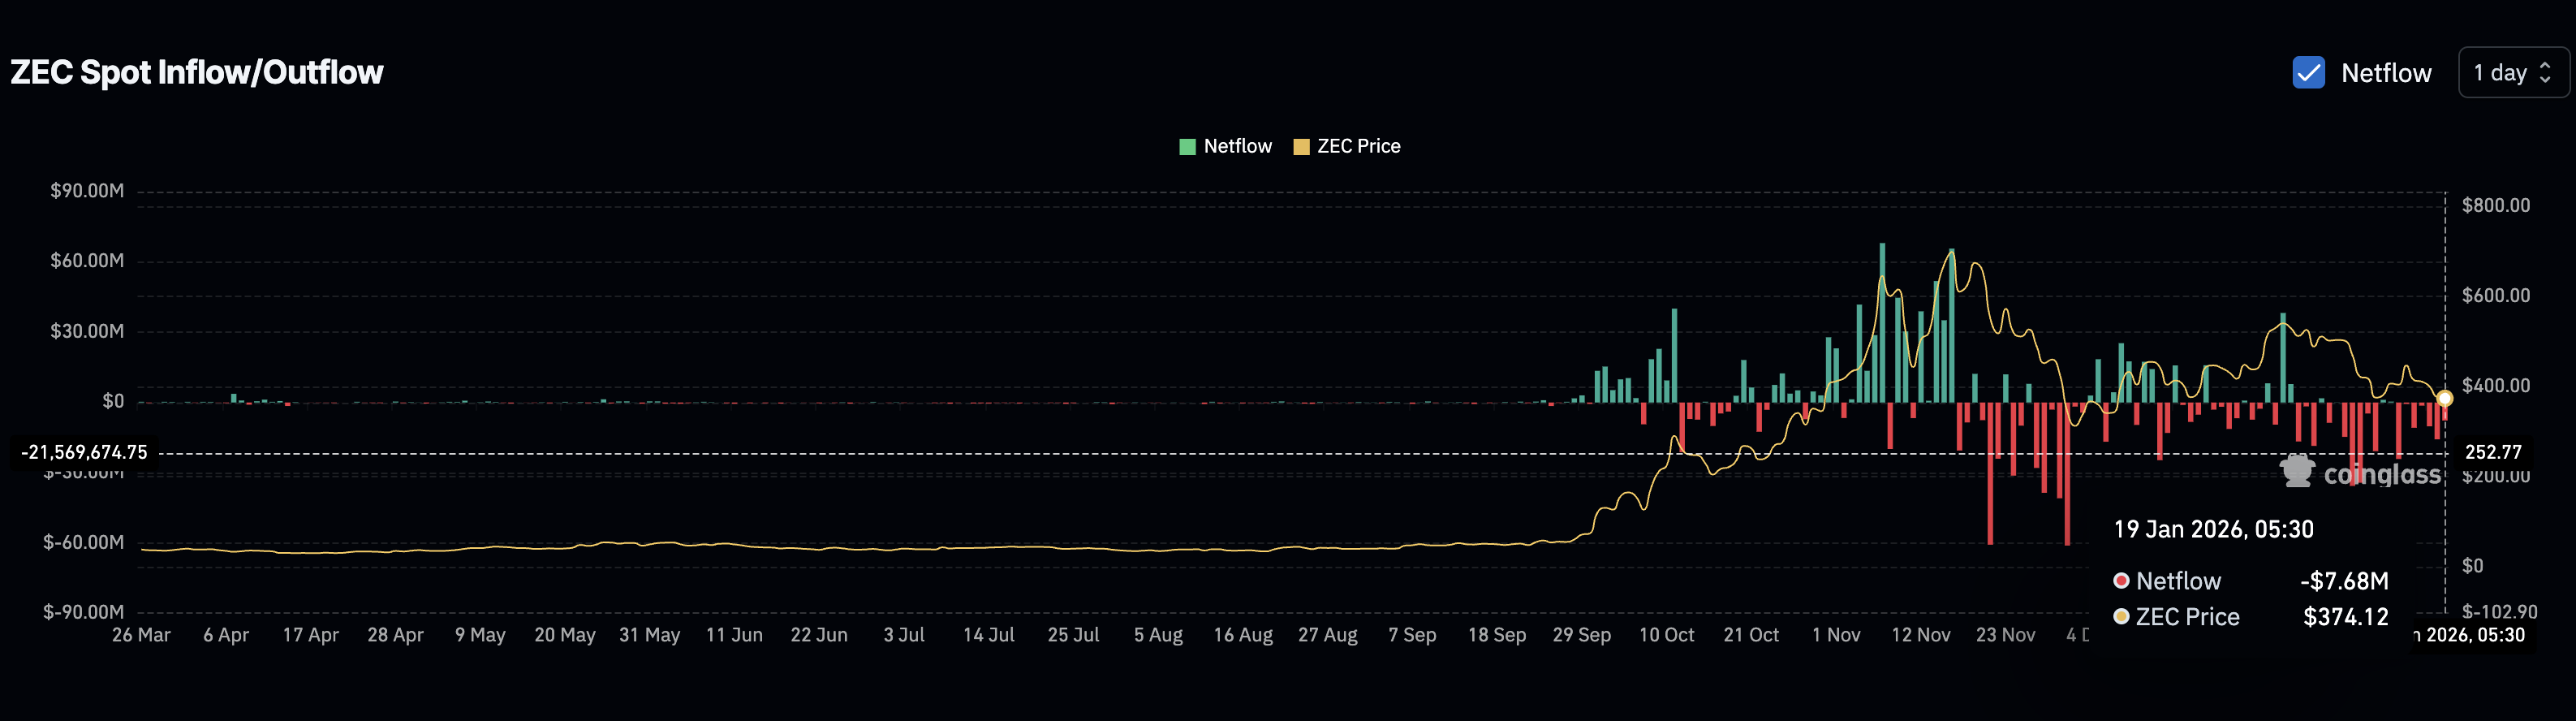 Spot Exchange Netflows: Coinglass
Buying is still happening, but at a much slower pace.
The Money Flow Index (MFI) helps explain the type of demand in play. MFI blends price and volume to show whether buying pressure is aggressive or defensive. On the 12-hour chart, MFI formed a higher low even as the Zcash price trended lower.
That behavior points to dip buying, not breakout chasing. Buyers are stepping in only after weakness appears, rather than committing at higher prices.
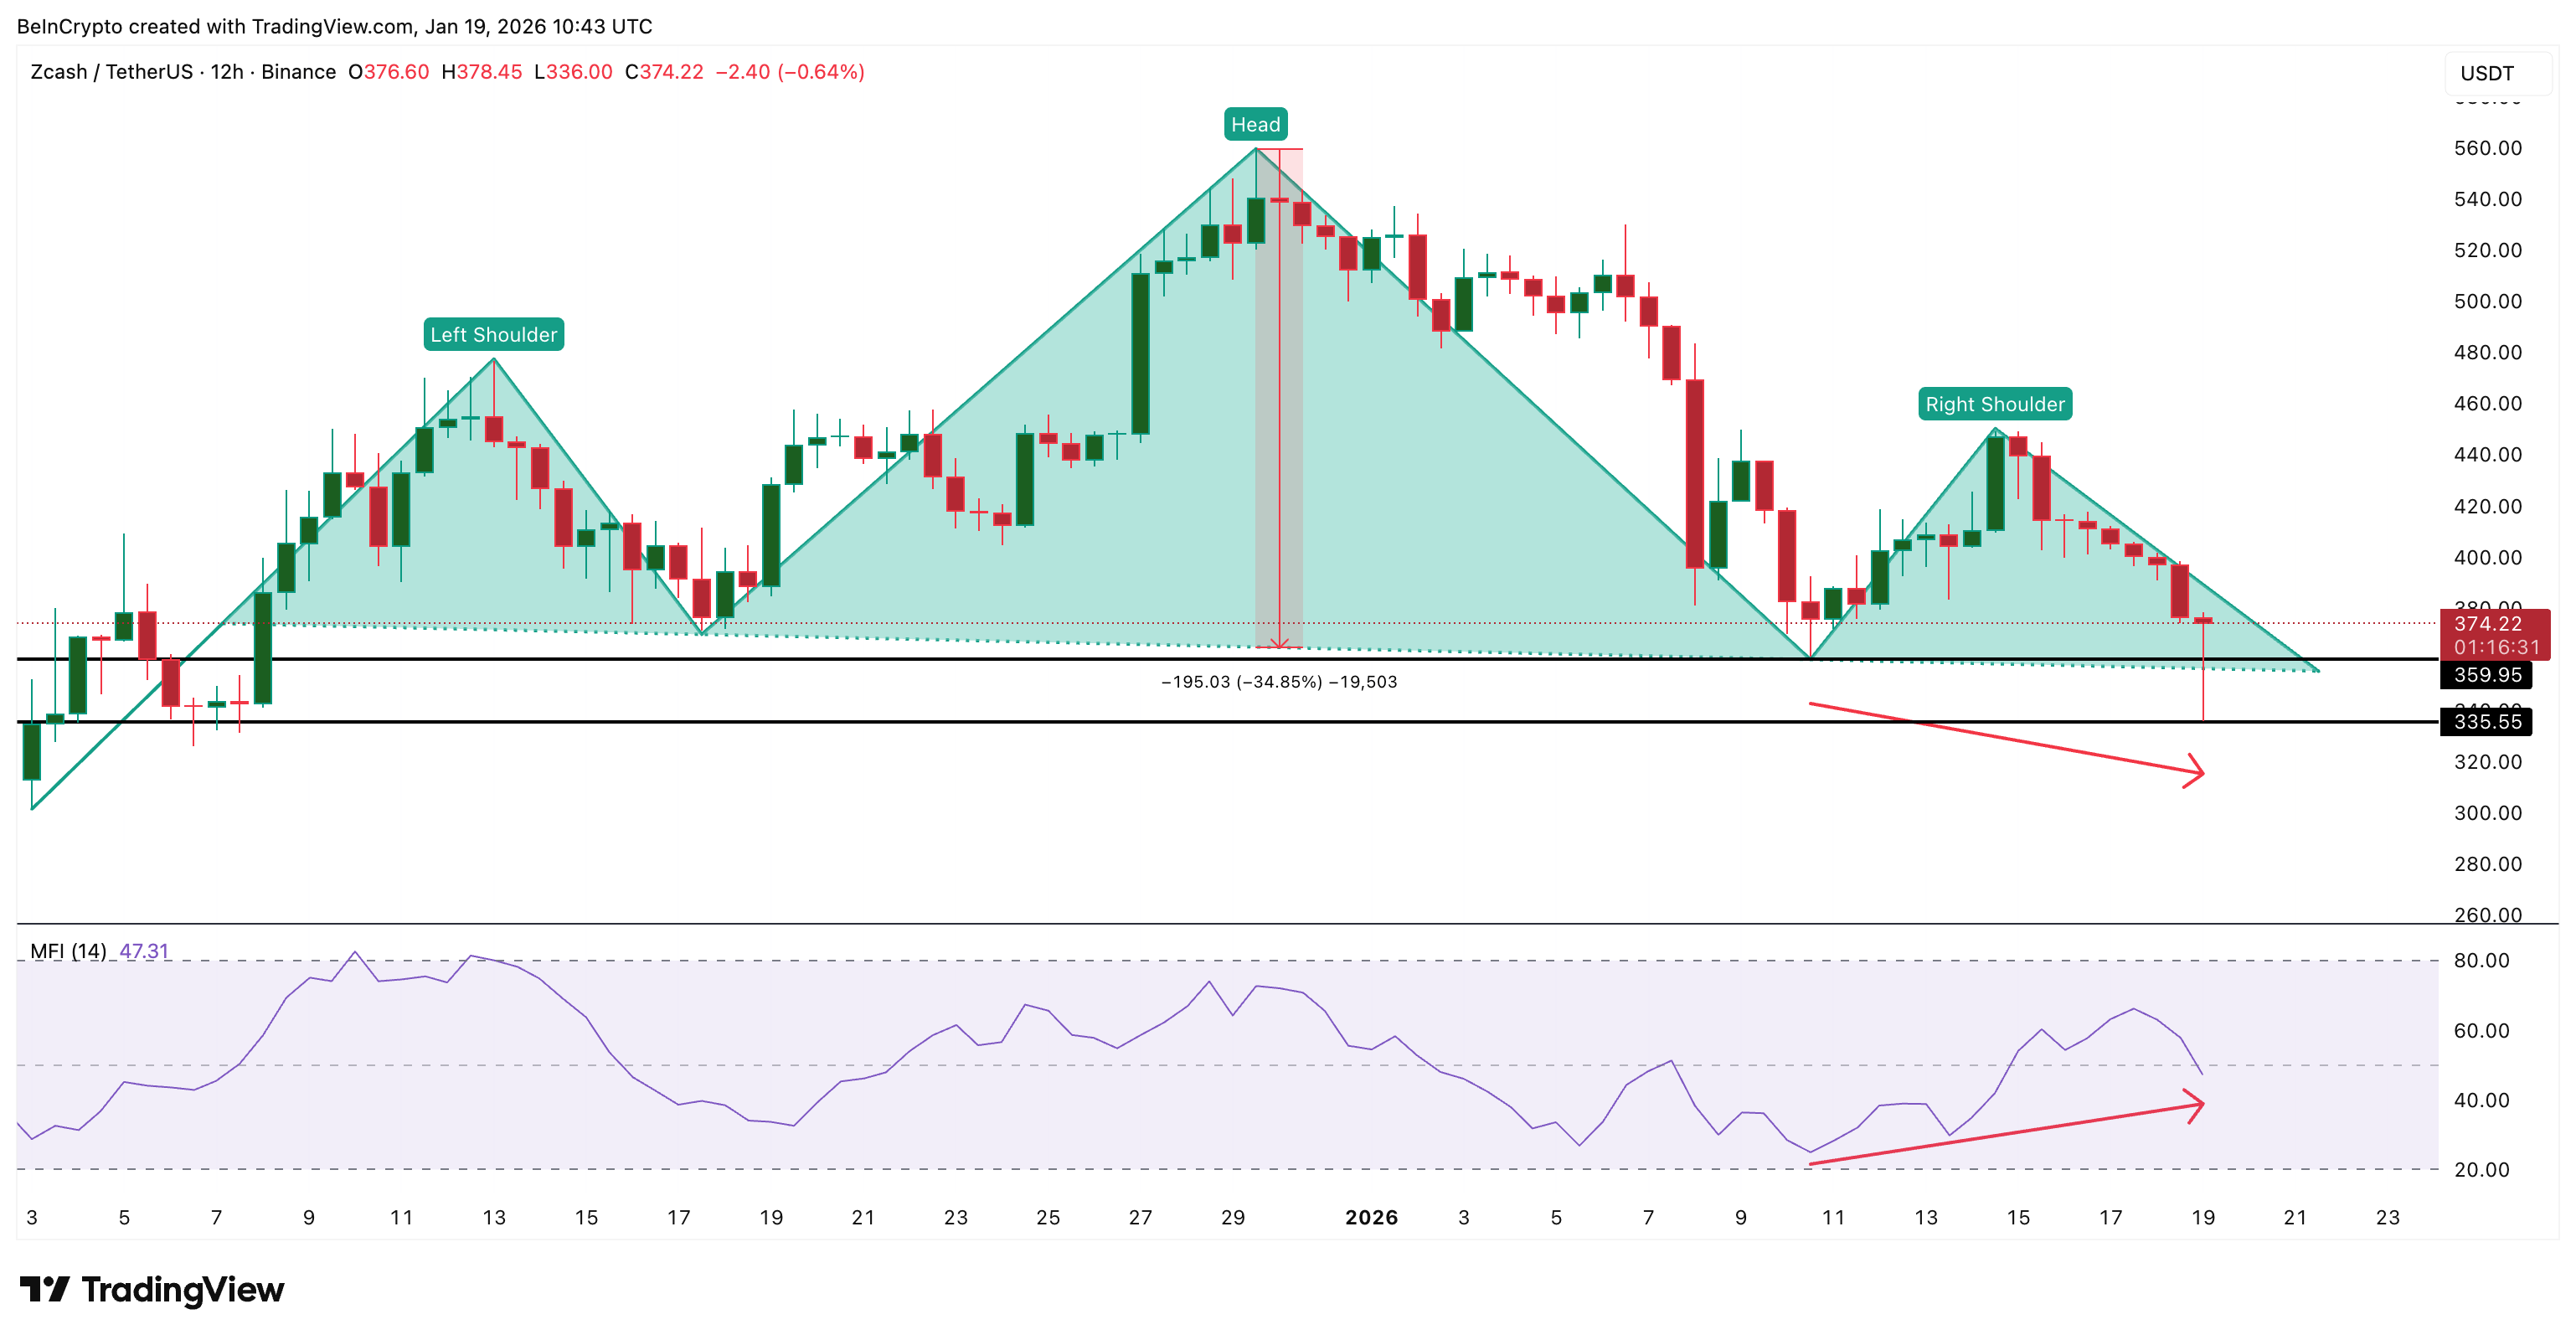 Dip Buyers Continue To Come In: TradingView
This distinction matters. Dip buying can stop sharp declines, as it just did near the breakdown level. But without stronger follow-through, it rarely drives sustained rallies on its own.
For now, Zcash demand exists. But it remains cautious, selective, and reactive rather than urgent.
Zcash Price Levels That Decide Whether the Save Turns Into a Reversal
With the breakdown delayed, price levels now matter more than indicators.
The first critical zone remains $359 to $350. If Zcash loses this area on a 12-hour close, the head-and-shoulders pattern likely reactivates. That would reopen the path toward $250, almost completing the projected 34% move.
If buyers continue defending this zone, short-term stabilization remains possible.
On the upside, $450 is the first real test. This level marks the right shoulder of the bearish pattern. A sustained move above it would weaken the bearish structure and allow momentum to rebuild.
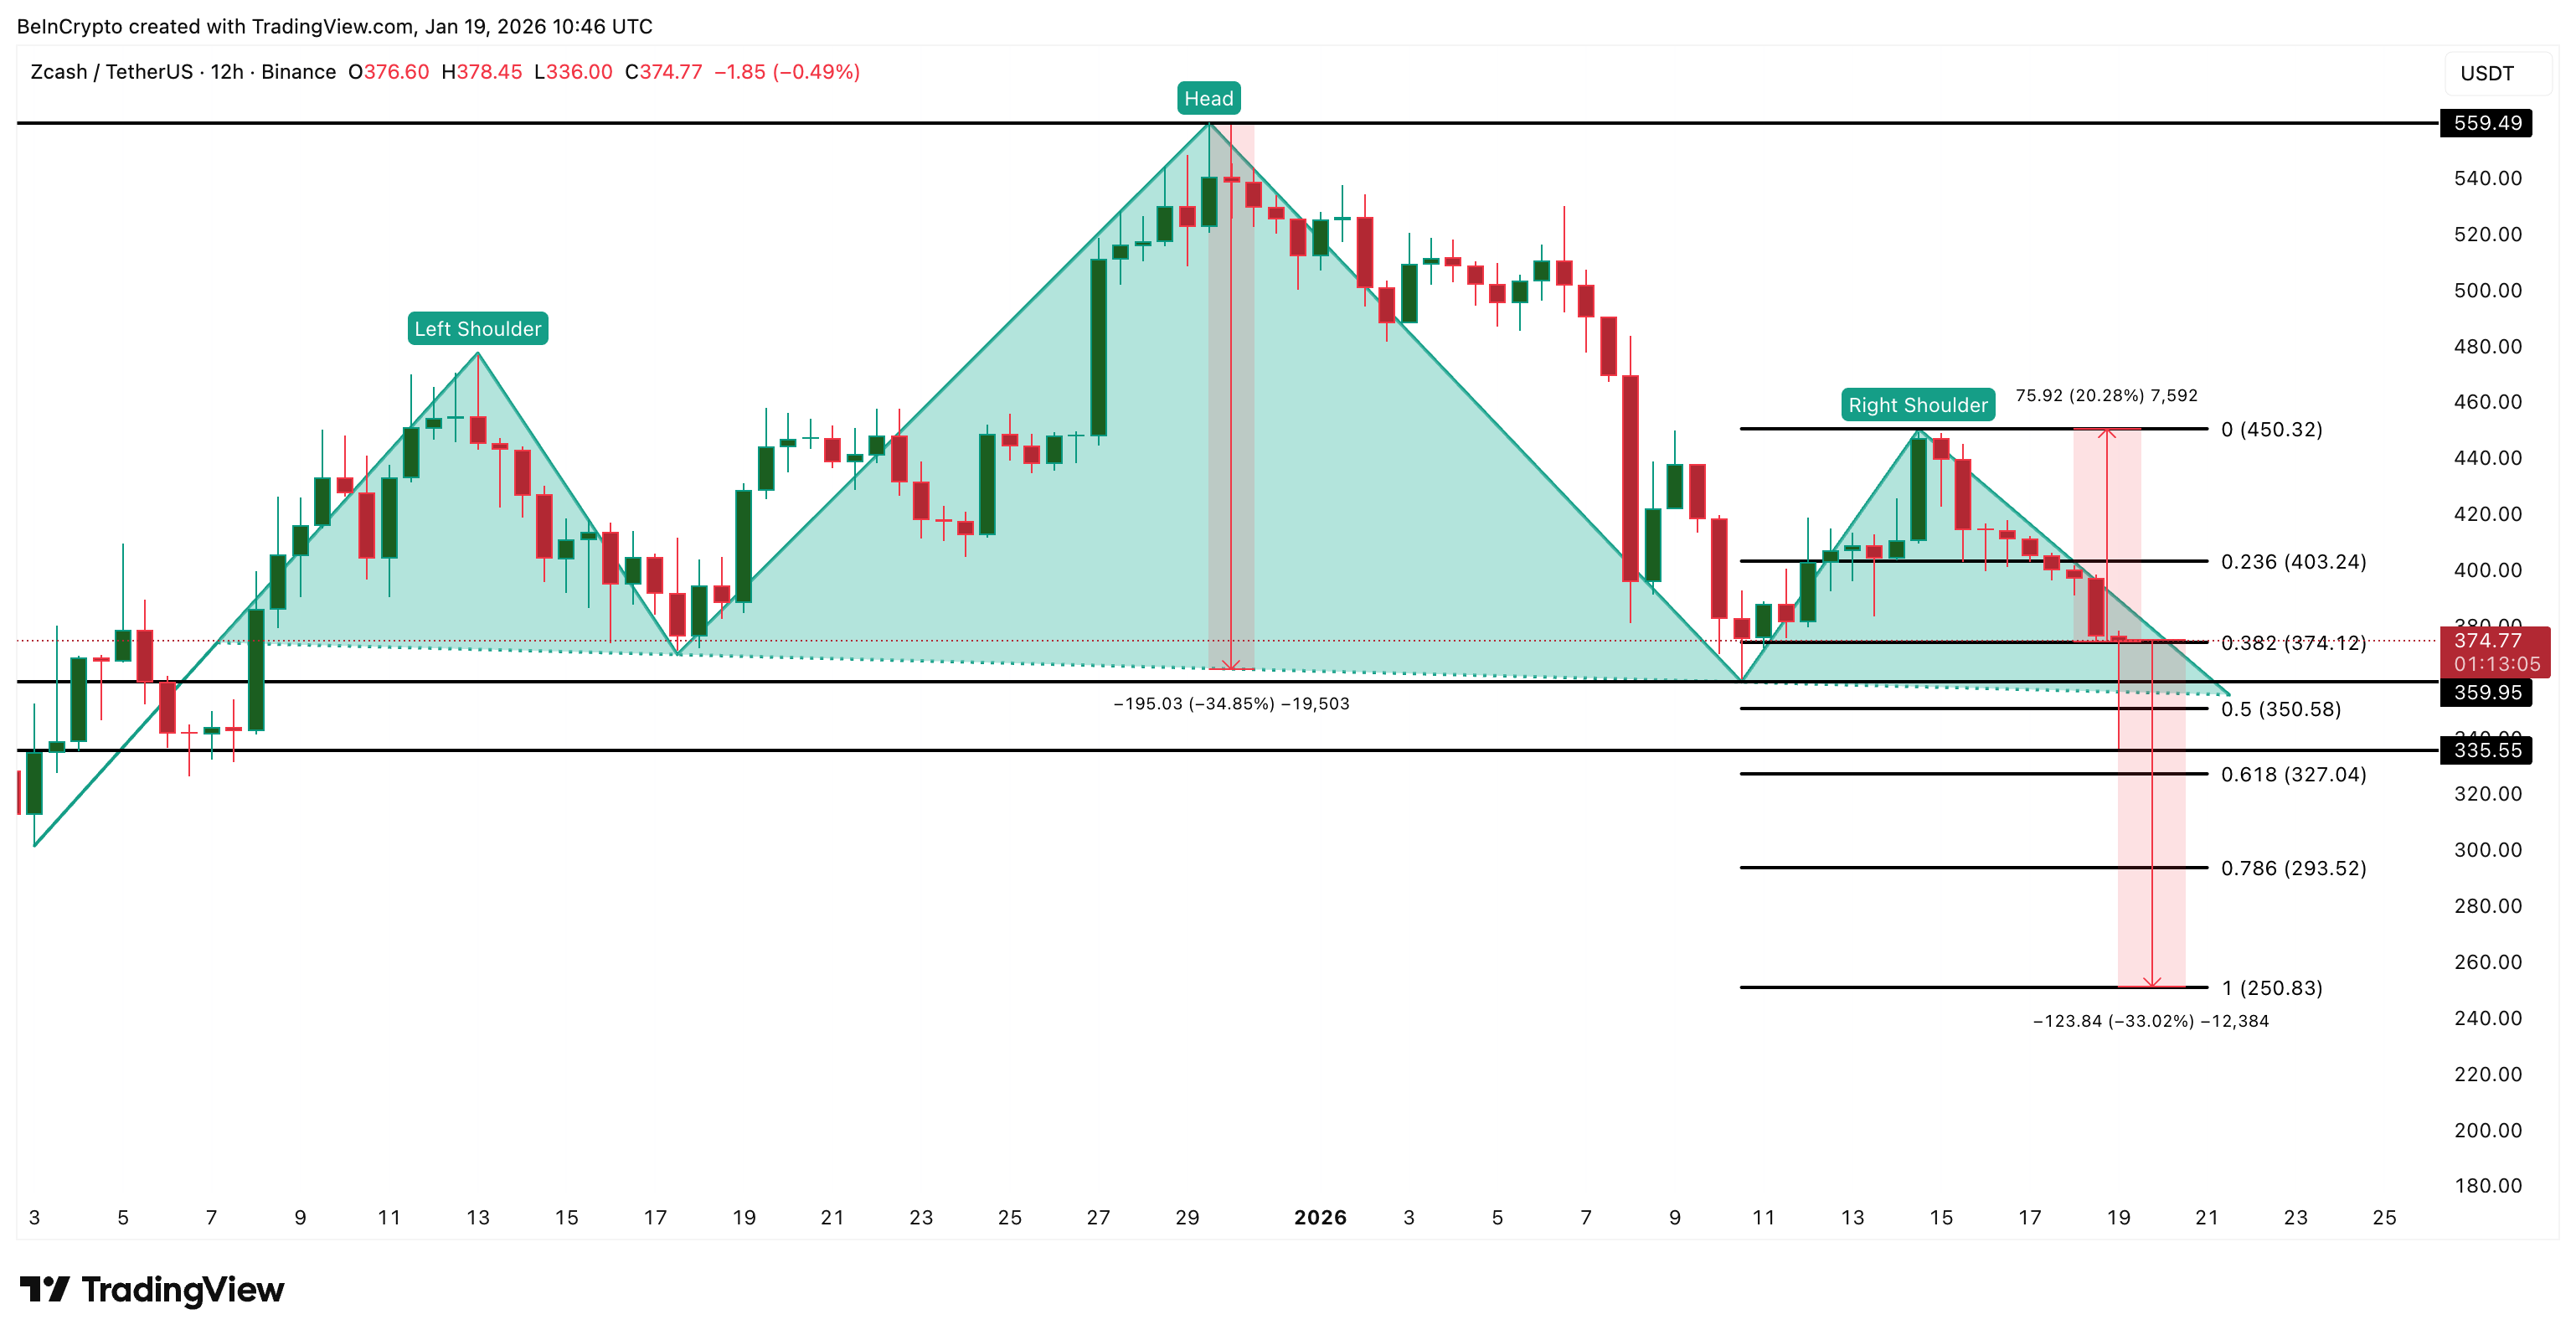 Zcash Price Analysis: TradingView
However, the bearish pattern only fully breaks above $559. Until then, any bounce remains corrective rather than trend-changing.
Zcash currently sits in between. Buyers proved they are willing to defend the price. Whales showed up. Dip buying remains active. But conviction is lower than it was during past accumulation phases.
The 34% crash was saved — for now. Whether it stays that way depends on what buyers do next, not what they just did.
Recommended Articles


