

Meme Coins Price Prediction: DOGE, SHIB and PEPE tumble with Bitcoin, as support levels come into focus

- Today’s Market Recap: US and Iran Signal Willingness to End Conflict, Three Major US Stock Indexes Surge, Dollar Ends Five-Day Winning Streak
- Trump Withdrawal Intent Reshapes Liquidity, Bitcoin Breaks $68,000 Mark
- Gold Price Forecast: XAU/USD opens lower around $4,450 on fears of widening Iran conflicts
- USD/JPY Hits 160.00 Mark, Will Japanese Government Intervene? Will the Currency’s Rally Be Contained?
- Seesaw Effect Continues. US Pre-Market Three Major Index Futures Weaken, Oil Prices Rise, Bitcoin Drops Below 68,000 Mark
- Brent: Forecast lifted with $150 risk – Societe Generale

Dogecoin is down more than 3% on Monday as MACD signals turn bearish and sellers keep pressure on price.
Shiba Inu is sliding about 3%, extending its losing streak to three straight days as momentum fades.
Pepe is down 4% and has fallen for a sixth day, with the drop accelerating as it slips below key moving averages.
Meme coins extend last week’s decline on Monday, with Dogecoin (DOGE), Shiba Inu (SHIB) and Pepe (PEPE) shedding roughly 3% on the day. All three tokens are trading below important moving averages, leaving the market leaning toward a test of nearby support zones as traders look for signs of stabilization.
The weakness in DOGE, SHIB and PEPE is tracking a broader pullback across crypto, with Bitcoin (BTC) falling below $93,000 on Monday after a leverage-driven rally failed to sustain momentum.
Dogecoin sellers tighten grip as price stays below key EMAs
Dogecoin is down 3% at press time on Monday, extending its pullback to a sixth consecutive session. The token remains capped beneath the 20-day Exponential Moving Average (EMA) at $0.1375 and the 50-day EMA at $0.1417. With both averages sloping lower, rebound attempts are being rejected, keeping the near-term setup tilted to the downside. The longer-term 200-day EMA at $0.1718 is also trending lower, reinforcing the broader bearish bias.
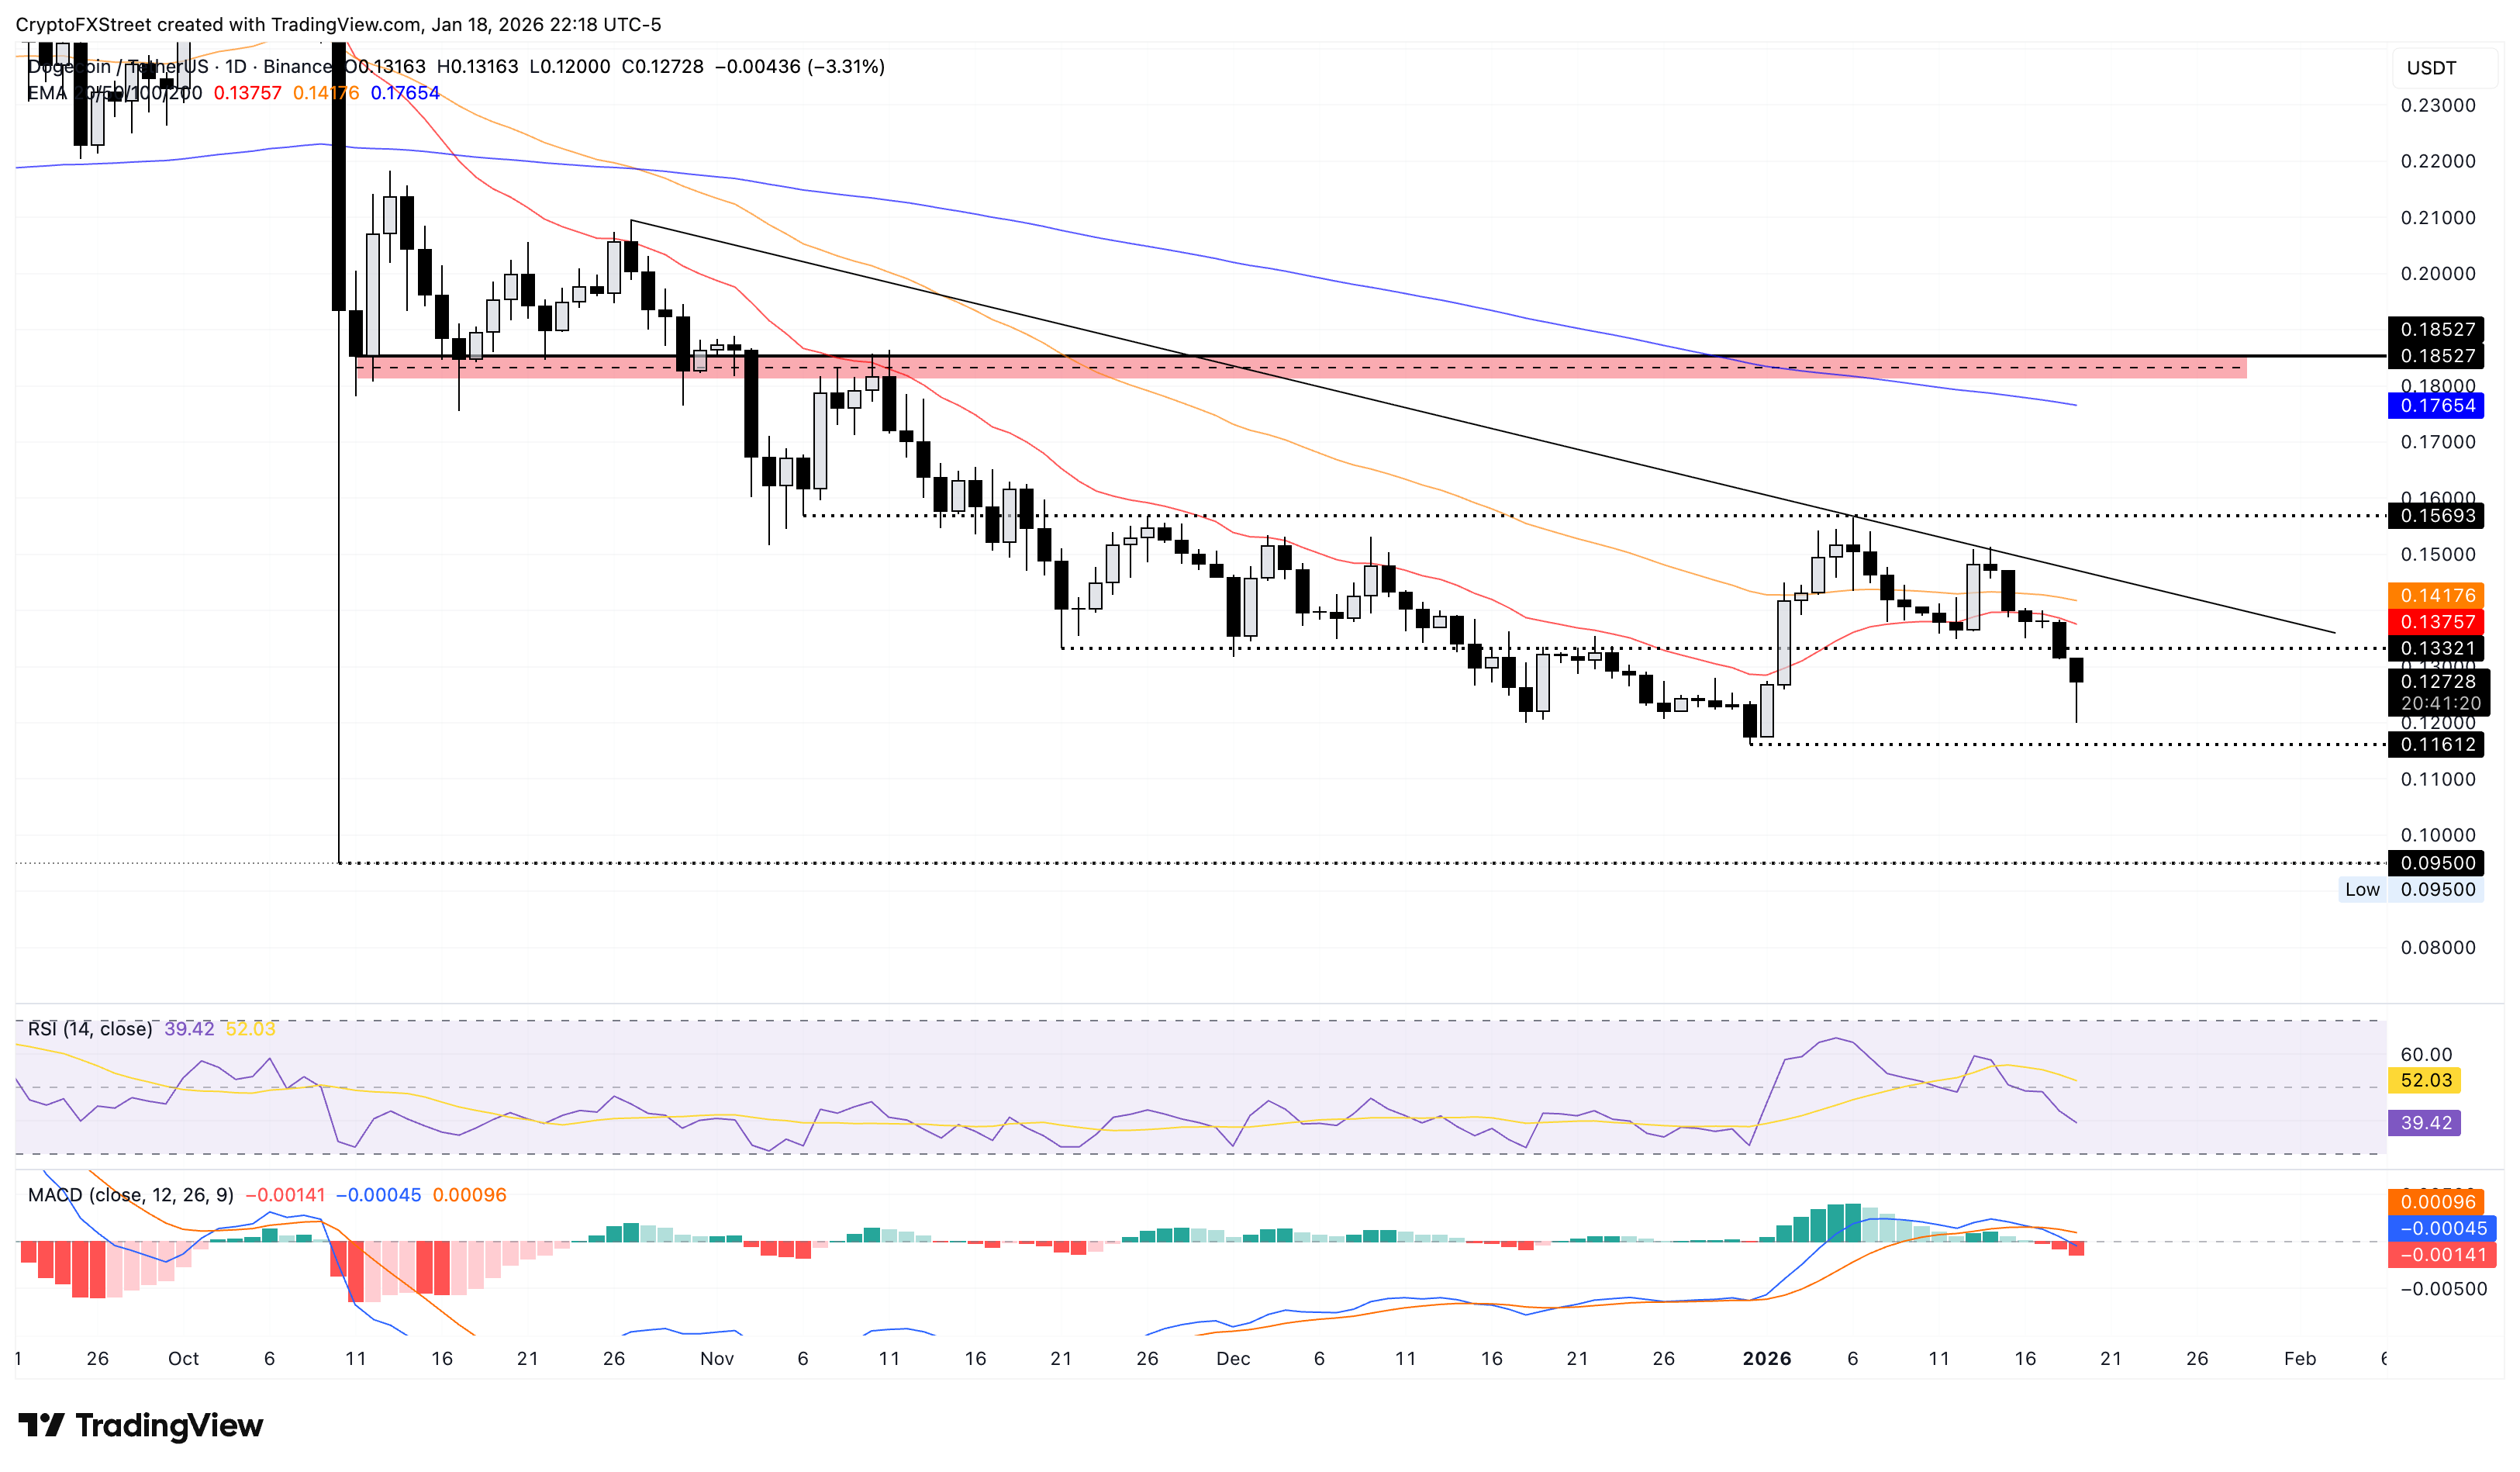
Momentum indicators are aligned with the selloff. The MACD histogram has moved into negative territory and is widening, while the MACD line is below the signal line near the zero area — a configuration that points to strengthening bearish momentum. The RSI is at 39, showing increasing selling pressure as it drifts toward oversold conditions.
For sentiment to improve, DOGE would need to log a daily close above the descending trendline that connects the October 27 and January 14 highs.
If the decline deepens, a break below the December 31 low at $0.1161 could expose the October 10 low at $0.09500.
Shiba Inu extends its slide as moving averages roll over
Shiba Inu is down nearly 3% at the time of writing on Monday, adding to last week’s 4% drop and extending the downtrend. The 20-day EMA has turned down from the 50-day EMA and is now overlapping near price — a technical signal that highlights a renewed bearish shift.
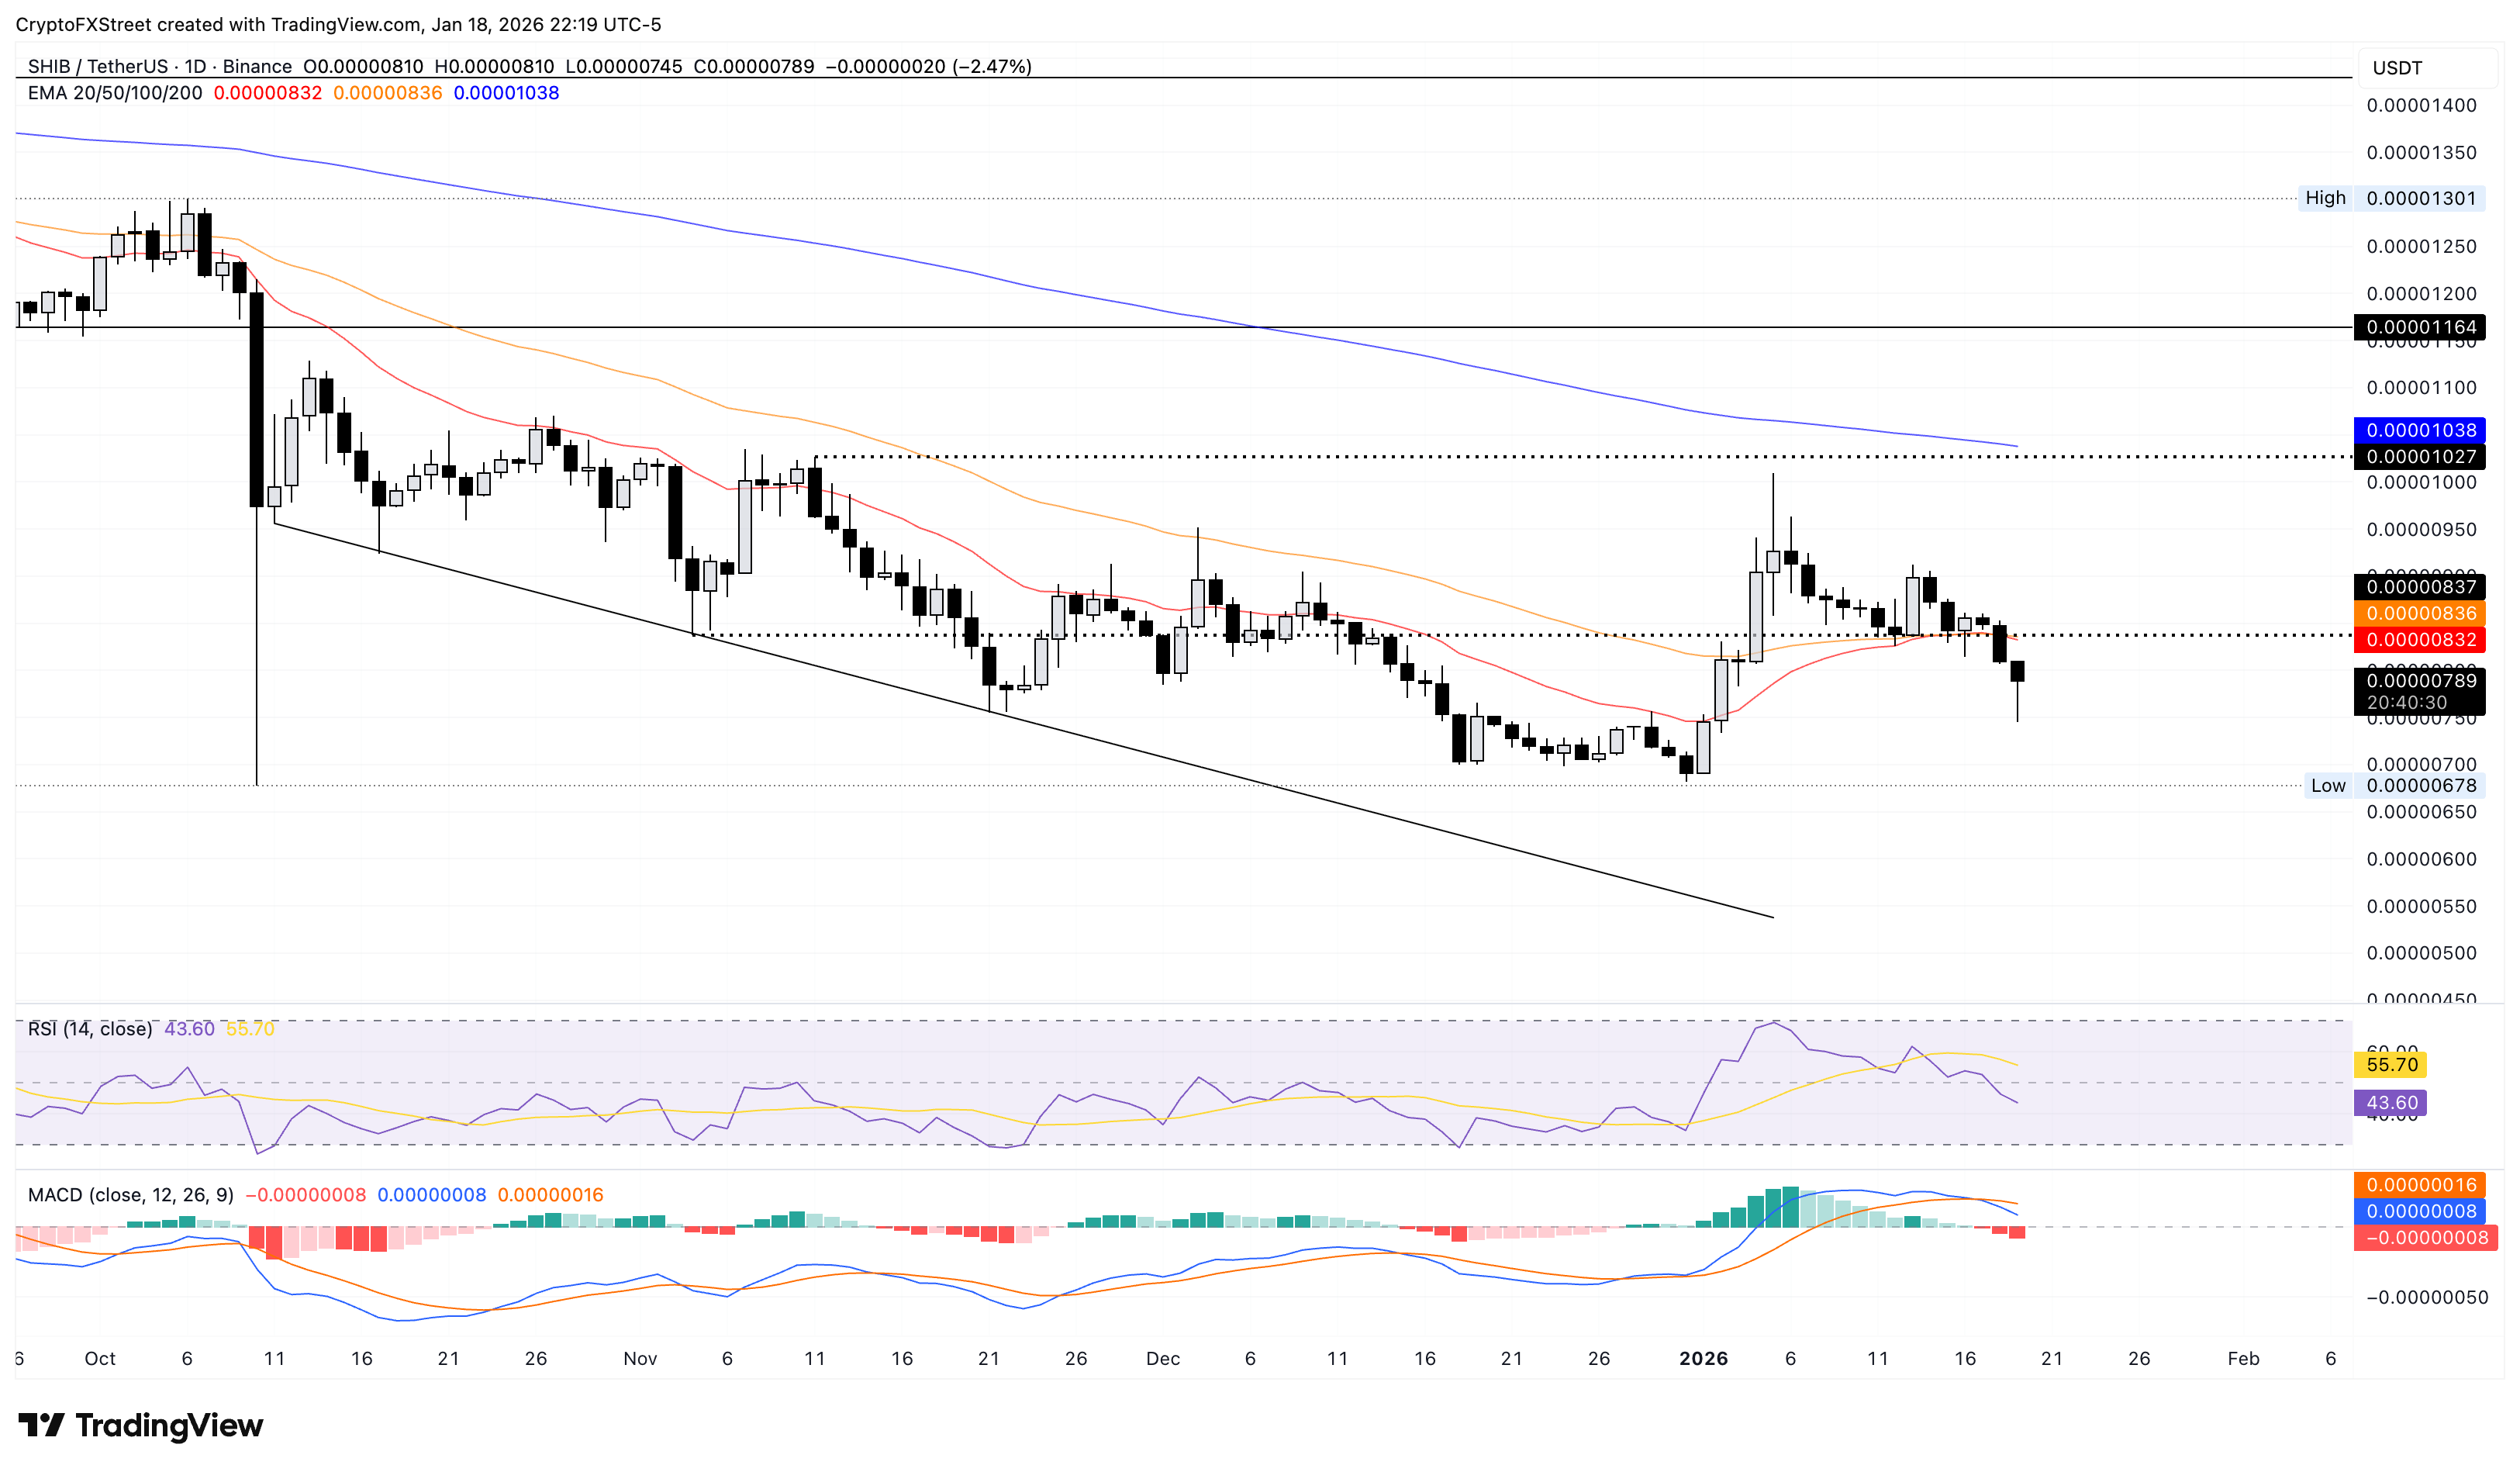
If the correction continues, SHIB could drift toward the October 10 low at $0.00000678.
Momentum signals are more muted than in DOGE. The MACD and signal line are almost on top of each other around zero, and the histogram is essentially flat, keeping the MACD read closer to neutral. RSI is at 43 and easing, suggesting upside momentum is fading rather than rebuilding.
On the upside, a clean break above the tightly clustered 20- and 50-day EMAs at $0.00000836 would be a key step toward restoring bullish momentum.
Pepe’s selloff accelerates as price breaks below the 50-day EMA
Pepe remains under heavy pressure and has entered its third straight bearish week. The frog-themed meme coin is down 4% on Monday and has slipped below the 50-day EMA at $0.00000541.
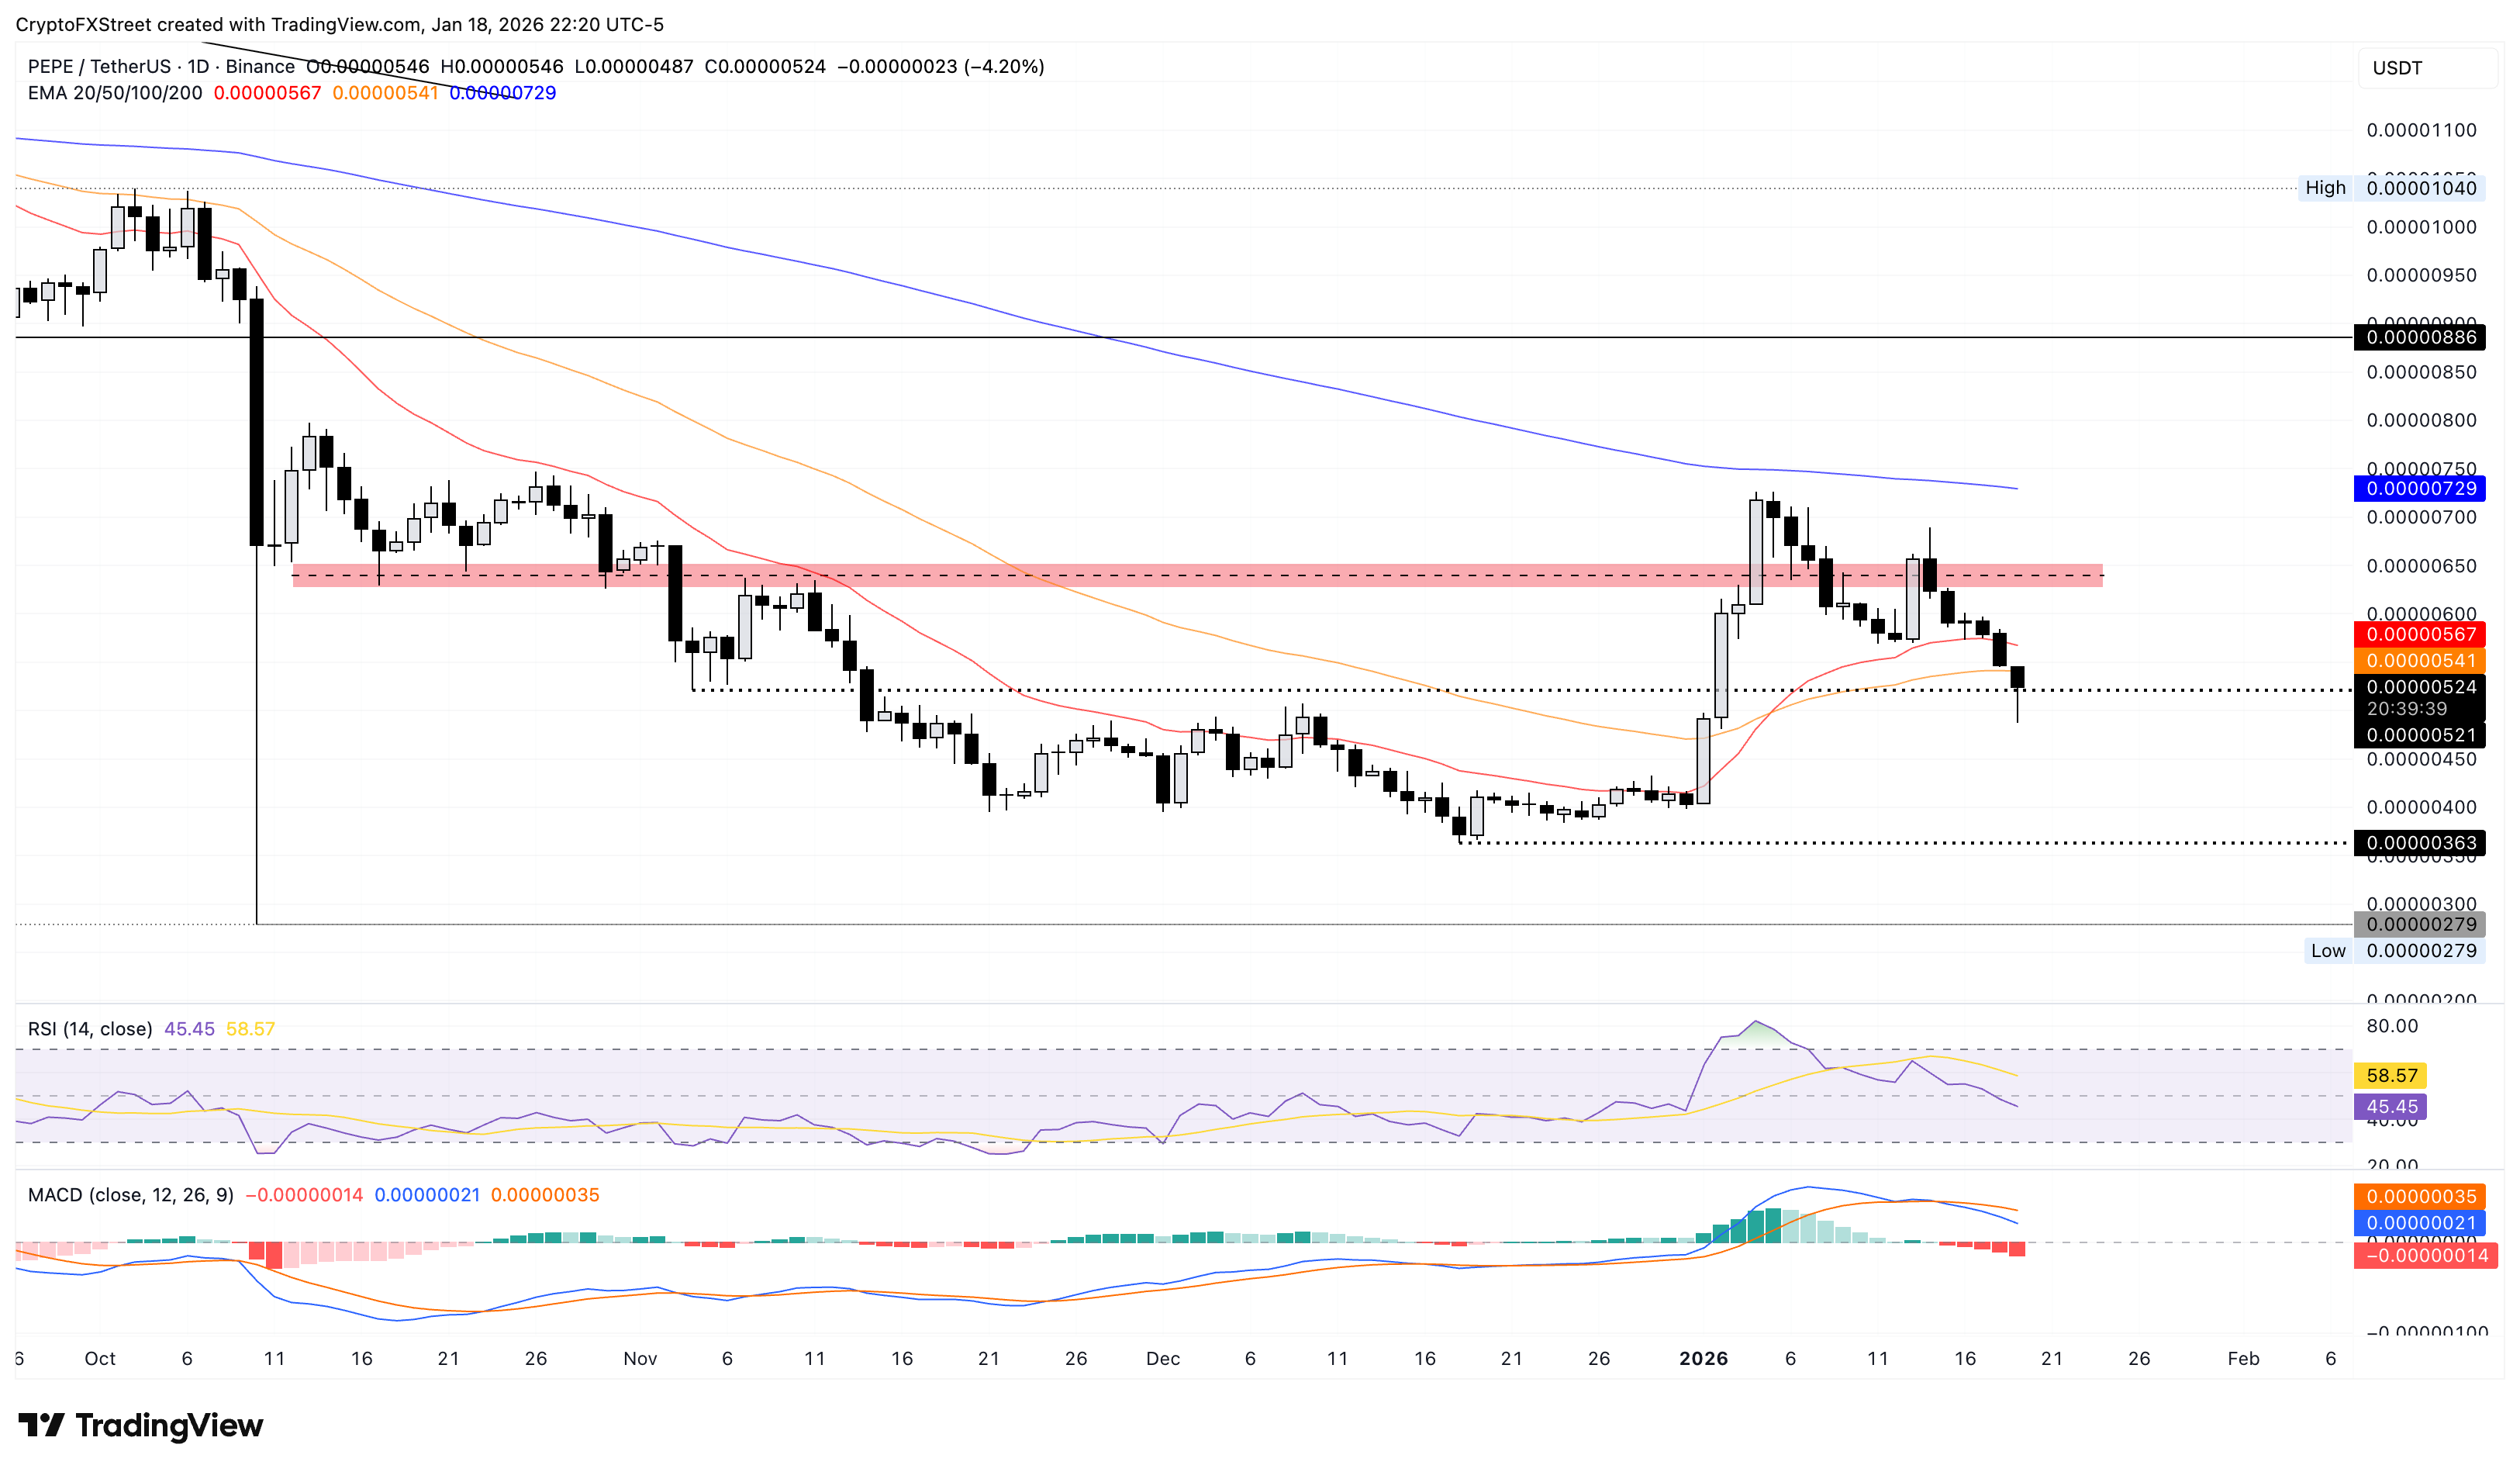
If PEPE stays in a declining trend and breaks beneath the $0.00000500 psychological level, sellers could target the December 18 low at $0.00000363.
The technical backdrop remains negative. MACD has crossed below the signal line and is tracking toward zero, while the negative histogram bars are building — both pointing to a firmer bearish tone. RSI at 43 has dipped below the midpoint, indicating a tilt toward seller control.
If a rebound attempt emerges, the 20-day EMA at $0.00000567 could act as overhead resistance and limit upside.
Read more
The above content was completed with the assistance of AI and has been reviewed by an editor.


