

3 Gold Market Signals That Suggest Bitcoin’s Price May Be Near a Bottom
Gold prices saw a modest short-term pullback after a broader rally that pushed the metal to record highs. Meanwhile, Bitcoin has underperformed during what has historically been its strongest quarter, reviving constant comparisons between the two assets.
Despite Bitcoin’s weakness, analysts are highlighting a series of macroeconomic, statistical, and technical signals from the gold market that suggest BTC may be approaching a bottom and could be setting the stage for its next major move.
2020 Playbook Returns as Gold and Silver Surge Ahead of Bitcoin
From a broader macroeconomic standpoint, analysts suggest that gold and silver typically reach their highs before Bitcoin follows. An analyst illustrated this pattern in detail through a post shared on X (formerly Twitter).
Following the March 2020 crash, the Federal Reserve pumped substantial liquidity into markets. The liquidity injection first sought safe havens.
Gold rallied from about $1,450 to $2,075 by August 2020. Silver jumped from $12 to $29. Over the same period, Bitcoin stayed around $9,000 and $12,000 for five months, as reported in an analysis by BullTheory.
“This was also after a major liquidation event which happened in March 2020 due to COVID,” the post read.
When precious metals peaked in August 2020, capital began shifting to risk assets. This rotation triggered Bitcoin’s surge from $12,000 to $64,800 by May 2021, representing a 5.5x gain. Furthermore, there was an eightfold increase in the total cryptocurrency market cap.
Currently, gold has hit record levels near $4,550, and silver has climbed to around $80. Meanwhile, Bitcoin has predominantly been trading sideways, exhibiting a pattern similar to that observed in mid-2020. BullTheory added that,
“We also had another large liquidation event recently on October 10th, similar to March 2020. And once again, Bitcoin has spent months moving slowly after that.”
The analyst argues that the Federal Reserve liquidity was the primary driver in 2020. Notably, in 2026, multiple catalysts are emerging.
These include renewed liquidity injections, expected rate cuts, potential SLR exemptions for banks, clearer crypto regulations, possible dividend checks under the Trump administration, expanded spot crypto ETFs, easier access for large asset managers, and a more crypto-friendly Fed leadership.
“Last cycle, Bitcoin rallied mainly because of liquidity. This time, liquidity plus structure is coming together. The setup looks very similar, but with more fuel. Gold and silver moving first is not bearish for crypto. Historically, it has been the early signal. If this pattern repeats, Bitcoin and crypto markets do not lead first. They move after the metals pause. That is why the current sideways action in BTC is not the start of the bear market, but rather a calm before the storm,” BullTheory remarked.
Statistical Decoupling Signals Crypto Rallies
Another key signal comes from Bitcoin’s correlation with gold and equities. Analyst PlanB noted that Bitcoin is significantly diverging from its historical correlation with both gold and stocks. A similar decoupling occurred when Bitcoin was trading below $1,000, before it went on to rally more than tenfold.
“This happened before, when BTC was below $1k, and resulted in a 10x pump,” PlanB wrote.
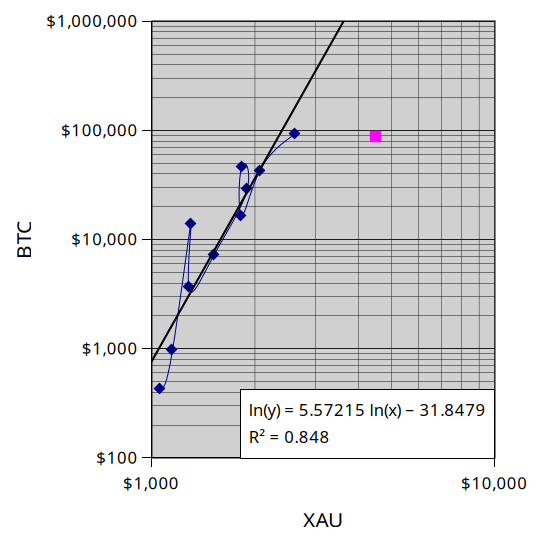 BTC and Gold Correlation. Source: X/100trillionUSD
However, the analyst cautioned that the markets evolve, and relationships between assets can break. Thus, this cycle may not repeat past outcomes.
GOLD/BTC Ratio: A Market Bottom Indicator
From a technical angle, the BTC/GOLD ratio is also flashing a key signal. Macro strategist Gert van Lagen highlighted that the ratio’s RSI is touching a key downtrend line for the fifth time in history.
In past cycles, when this happened, it coincided with major bear market bottoms in 2011, 2015, 2018, and 2022, each followed by Bitcoin regaining strength relative to gold and forming higher lows. If the pattern repeats, the current setup could indicate a similar turning point.
Thus, if these historical, statistical, and technical patterns hold, the current divergence may represent a transitional phase rather than sustained weakness, setting the stage for renewed upside for Bitcoin once precious metals pause and risk appetite returns.
Recommended Articles


